

The following publication has been lightly reedited for spelling, grammar, and style to provide better searchability and an improved reading experience. No substantive changes impacting the data, analysis, or conclusions have been made. A PDF of the originally published version is available here.
While many discuss the Midwest’s economic struggles, often overlooked are the varied performances of the region’s cities. The author looks at the performances of the region’s cities since the turn in the regional economy five years ago and assesses how each city’s performance was affected by its industry mix.
About ten years ago, economic growth in the Midwest was robust enough for the region to shake off its old moniker, the “Rust Belt.” Personal income growth in each of the states in the Federal Reserve’s Seventh District1 matched or exceeded the national average for most of the 1990s. Employment growth was slower than in the rest of the country, but in large part because workers were hard to come by. The District’s unemployment rate was below the national average throughout most of the 1990s.
Then the region was hit hard by the 2001 recession, and it has yet to fully recover. Its unemployment rate is back above the national average, and the District overall has lost 500,000 jobs from its peak in 2000. Many analysts attribute the region’s struggles to its concentration in manufacturing activity, and once again call it the Rust Belt. The Chicago Fed hosted a series of conferences to discuss the future of manufacturing and its impact on the Midwest.2
Still, in all the discussion of the struggles of the Midwest, what have been lost are the dynamics of the many cities that make up the region. Each of the cities (defined here as metropolitan statistical areas, or MSAs) has its own industry structure, and each has its own set of idiosyncratic factors that determine whether its economy will grow or not. In this Chicago Fed Letter, I assess the performances of these cities since the turn in the regional economy five years ago, identify the strong performers, and discuss their prospects to sustain that job growth.
The past five years
The Seventh District contains at least part of 55 different MSAs. The employment changes in these MSAs have been anything but uniform over the past five years (see figure 1). To put the MSA performances in perspective, U.S. nonfarm employment increased 1.3% between 2000 and 2005, while Seventh District employment decreased 2.8%. Twelve cities in the District had employment growth above the national average. Iowa City recorded the fastest employment increase at 8.9%, while Kokomo, Indiana, saw the largest decline, –12%. To some extent, the cities’ performances correlated with the performances of their states. Michigan, which experienced an employment decline of 6.1%, had only three MSAs with job gains, and Illinois, with employment down 3%, had none. Meanwhile, Indiana, having witnessed a 1.4% drop in employment, had three MSAs with job gains, including the largest city to show job gains, Indianapolis. In Wisconsin and Iowa—states that both saw employment increase 0.2% over the past five years—the majority of MSAs had a rise in jobs, and only one city in each state had employment declines worse than the regional average.
1. MSA job growth, 2000–05
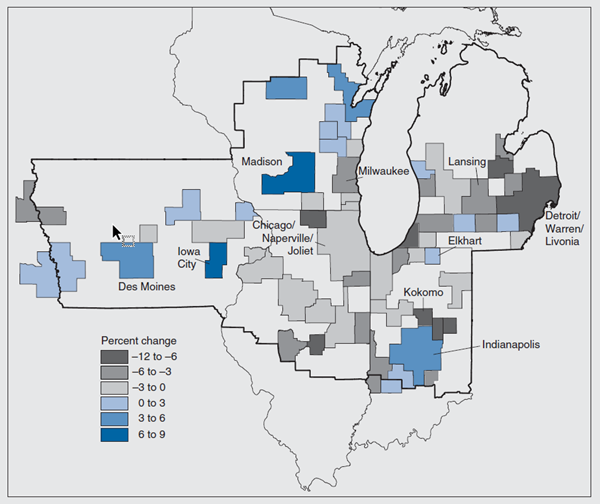
Source: U.S. Bureau of Labor Statistics from Haver Analytics.
Industry structure
While it is helpful to see which cities had employment declines and which had gains, it is an incomplete picture. A more interesting question than “Did this city experience job growth?” is “Did this city’s job growth exceed what could be expected for a city with its industry structure?”
A recent paper by Guhan Venkatu, an analyst at the Cleveland Fed, considers this question for Cleveland’s job growth from 1990 to 2003.3 Venkatu estimates what Cleveland could have expected for job growth if each of its industries grew (or shrank) at the same rate as they did nationally. That is, if Cleveland had an industry mix similar to the national economy in 1990, it would have expected to increase employment at a similar rate to the rest of the country. But it did not have such a mix—it had a larger share of jobs in manufacturing. Since manufacturing employment declined during this time, Cleveland should have expected to see slower job growth than the rest of the country. Venkatu argues that job growth in line with these expectations would suggest Cleveland’s underperformance can be blamed solely on its industry mix. However, Cleveland’s actual job growth was well short of what should have been expected, given its industry mix, which suggests other factors may have played a role. Here, I perform a similar experiment for the cities in the Seventh District during 2000–05.
There is limited industry mix data available for the MSAs in the Seventh District. Only 44 of the 55 MSAs have industry employment data for 1998–2000 readily available. For the most part, the data are for broad industry categories: construction; manufacturing; transportation and utilities; wholesale trade; retail trade; finance, insurance, and real estate; services; and the remaining industries (natural resources, government, and all other nonfarm jobs). So, in my experiment, all the industries within each of these are assumed to grow at the same rate as the broad category. For example, all manufacturing jobs—whether in motor vehicles, fabricated metals, food processing, or any others—are just classified as manufacturing and expected to grow at the same rate.
This shortcoming makes the estimate for expected job growth quite rough. Cities with a concentration in the poorest performing manufacturing industries misleadingly appear to perform well below expectations. For example, employment in primary metals manufacturing—such as steel mills—in the U.S. declined 24.6% in the past five years, while overall manufacturing employment fell 17.6%. Cities with a heavy concentration in steel mill jobs are expected to have smaller declines than they would if their concentration in steel was fully factored in.
Figure 2 shows the results for each of the cities in the Seventh District. A city’s expected job growth rate is reflected on the horizontal axis; its actual job growth rate is reflected on the vertical axis. About half of the MSAs were expected to show an increase in employment, though the average expected growth rate was –0.2%. The 15 cities that are plotted above the 45-degree line had actual job growth greater than what they could have expected, given their industry mix. Six of these had an increase in employment when they should have had a decrease, and two had a smaller decrease than expected.
2. Actual versus expected job growth for MSAs
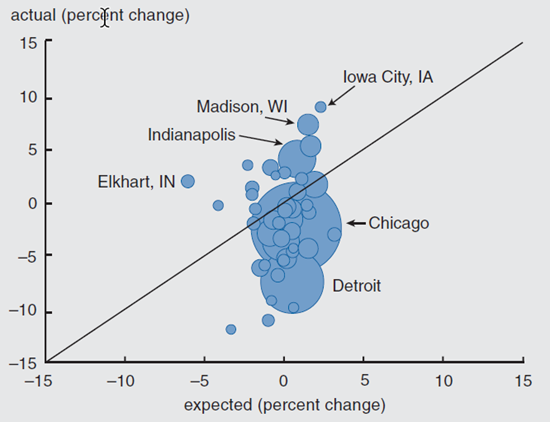
Sources: U.S. Census Bureau and author’s calculations based on data from the U.S. Bureau of Economic Analysis and the U.S. Bureau of Labor Statistics, all from Haver Analytics.
City size
A city’s population size can directly affect its rate of job growth, but in an uncertain way. For example, large cities have less room to expand than small cities, thereby driving up land prices and public service costs. However, larger cities may attract workers by offering a wider range of career opportunities. Size can also shape the industry mix, which indirectly affects the city’s job growth. Since the late 1960s, the optimal scale of manufacturing operations has been shrinking, even while global competition has sharpened. Accordingly, manufacturers have increasingly preferred to locate in smaller cities to take advantage of lower labor costs. Meanwhile, service providers tended to favor larger locales to take advantage of amenities, such as large airports. As a result, the economies of smaller cities have become relatively more dependent on manufacturing.4
Figure 3 presents a statistical analysis of the cities’ actual and expected performances, grouped by population size. The seven large MSAs (those with a population in 2000 greater than 600,000) have the lowest share of jobs in manufacturing on average, 14.5%, and were expected to have the highest job growth. However, on average, large MSAs fell short of their expected job growth by 2.3 percentage points. Only one, Indianapolis, exceeded expectations.
3. Actual and expected job growth, by MSA size
| Large | Medium | Small | All | |
| Actual job growth (% change 2000-05) |
||||
| Average | -1.8 | -1.1 | -2.3 | -1.7 |
| Median | -2.4 | -1.0 | -1.3 | -1.7 |
| Expected job growth (% change 2000-05) |
||||
| Average | 0.5 | 0.4 | -0.9 | -0.2 |
| Median | 0.5 | 0.2 | -0.7 | 0.0 |
| Average error from expectation |
-2.3 | -1.5 | -1.3 | -1.5 |
| Standard error from expectation |
3.9 | 4.0 | 5.7 | 4.8 |
| Average manufacturing share (%) |
14.5 | 15.4 | 21.3 | 17.9 |
| Number of MSAs | 7 | 17 | 20 | 44 |
Sources: Author’s calculations based on data from the U.S. Bureau of Economic Analysis and the U.S. Bureau of Labor Statistics from Haver Analytics.
The 17 medium MSAs (population between 200,000 and 600,000) had a much better performance, despite a slightly larger share of jobs in manufacturing, 15.4%. The average of the medium MSAs’ job decline was 1.1% (the lowest of the three groups), five of the cities exceeded their expected growth rate, and the group underperformed by 1.5 percentage points on average.
The performance of small MSAs (population under 200,000) varied widely. The average actual decline in jobs was 2.3%; however, with the highest concentration of manufacturing jobs (21.3%), the small cities were expected to see a 0.9% decline in employment. As a result, while the absolute performance of small MSAs was the worst of the three groups, its relative performance was the best. The small cities only underperformed by 1.3 percentage points on average, and nearly half beat their expected growth rate.
Small cities were the group with the biggest variation in relative performance. They had the largest standard error from expectation, which measures the dispersion around the expected performance (similar to how standard deviation measures dispersion around the mean). Still, the dispersion is to be expected. Small cities are more likely to be dominated by one industry or even one firm. Since the expected job growth calculation does not capture all the variation in company performance or the performance in small segments of an industry, it is natural that the actual job growth in a small city would vary more than the expected job growth.
The diamonds in the rust
A few cities stand out as places that had something special going for them during the past five years. For some, their core businesses had a stretch of good years, and these cities’ standout job growth may prove fleeting. For others, their performances reflect permanent factors that will likely continue to work in these cities’ favor.
Elkhart, IN
Elkhart is the city in the District with the largest concentration of manufacturing jobs (45% of total employment in 1998–2000), yet remarkably, it still had faster job growth than the national average. Elkhart is an example of a small city dominated by one industry: recreational vehicles (RVs) in this case. The past five years have been an especially good time to be in the RV business. Unit shipments increased at an average annual rate of 10% between 2000 and 2005; by comparison, the inflation-adjusted value of all manufacturers’ sales increased an annual average of 0.2%.5 The RV industry has benefited as the population has aged, and it has remained fairly isolated from import competition because of different international standards. The Recreational Vehicle Industry Association forecasts that shipments will moderate over the next five years, though still increase an annual average of 2.5%–5.5%.6 But, RV sales are cyclical, and Elkhart’s fortunes will be closely tied to this cycle so long as the city maintains its high concentration of jobs in this industry.
Iowa City, IA, and Madison, WI
Iowa City and Madison are grouped together because they both have expanded for the same reason: They are home to large state universities. University towns, with their large population of highly educated and highly paid workers, have been a magnet for businesses in recent decades. In fact, the rest of the District’s major university towns—Ann Arbor, MI; Bloomington, IN; Champaign, IL—also showed some relative strength during 2000–05. Certainly, the presence of a major university does not make a city immune to economic hardship, but a major university is one factor that can help a city sustain job growth. Given their industry mix, all five university towns were expected to show job growth, with an average expected gain of 1.5%. And since the mid-1990s, each one has sustained faster job growth than its state average.
Indianapolis, IN
Indianapolis was the only large city to experience job growth and exceed its expected growth rate during 2000–05. According to forthcoming research from the W. E. Upjohn Institute for Employment Research, Indianapolis offers a strong competitive environment for many of its major industries, including lighting equipment manufacturing, pharmaceutical manufacturing, and insurance. Most of its major industries have not been strong national performers, which might limit the city’s potential. But Indianapolis ranks in the top half of cities for several factors that spur employment growth (skilled work force, income equality, and business dynamics) and others that contribute to income growth (local amenities and urban/ metro structure).7
Conclusion
For the past five years, the cities in the District have seen significant job losses on average, a problem that is popularly believed to be tied to the region’s reliance on manufacturing. However, based on their broad industry structure, more than half of the cities were poised for modest job gains, and nearly one-quarter of them did expand. Still, most of the cities fell short of their expected job growth. To some extent, this shortfall reflects the ties between manufacturing and other industries. For example, business services firms here likely underperformed as well because more of their clients are manufacturers.
Nonetheless, the shortfall of job growth also suggests that other factors, in addition to industry mix, may be hindering growth here. There are some factors, such as its climate, that the Midwest can do nothing about. But there are others—such as resolving issues related to legacy costs and educating the workforce to attract more businesses or different industries—that it can and will change over time.
Notes
1 The Seventh District comprises all of Iowa and most of Illinois, Indiana, Michigan, and Wisconsin.
2 For more information, see William A. Testa, Thomas H. Klier, and Richard H. Mattoon, 2005, “Challenges and prospects for Midwest manufacturing: Report on the 2003–04 Chicago Fed Manufacturing Project,” Chicago Fed Letter, Federal Reserve Bank of Chicago, No. 211b, February.
3 Guhan Venkatu, 2006, “Cleveland (on the) rocks,” Economic Commentary, Federal Reserve Bank of Cleveland, February 1.
4 Federal Reserve Bank of Chicago, 1995, “Midwestern metropolitan areas: Performance and policy,” conference summary, November 28, pp. 6–7.
5 RV shipments data are from the Recreational Vehicle Industry Association; these figures do not include the 38,900 emergency living units shipped to victims of Hurricane Katrina. Inflation-adjusted manufacturers’ sales data are from the U.S. Bureau of Economic Analysis via Haver Analytics.
6 Recreational Vehicle Industry Association, 2006, “RV business indicators,” report, Reston, VA, February 3.
7 Randall Eberts, George Erickcek, and Jack Kleinhenz, 2006, “Dashboard indicators for the Northeast Ohio economy,” Fund for Our Economic Future, draft final report, February 7, pp. 17, 44–62.


