

People across the Federal Reserve Bank of Chicago’s Seventh District, which covers the heart of the Midwest—Iowa and parts of Illinois, Indiana, Michigan, and Wisconsin—talk to us about how a lack of access to childcare can make it difficult for them to work, posing an economic challenge to individuals, communities, and businesses. Childcare options can be limited in a variety of ways, such as high cost, a lack of slots offered by licensed providers, low quality, operating hours that do not align with families’ needs, and inconvenient locations. As part of our Spotlight on Childcare, a targeted effort to understand how access to childcare can affect employment and the economy, this article reviews evidence about limited childcare slots and high costs for states in the Seventh District, shares what others have estimated as the economic costs of a lack of access to childcare, and shows the amount of pandemic-era federal aid these states received to support childcare providers and working families. Finally, we describe several factors that, combined with low profit margins, can help explain a lack of childcare slots and high childcare costs.
Studies conclude that, across income levels and geographies, many Seventh District communities face a shortage of childcare slots.
The general approach to measuring access to childcare is to compare estimates of supply and demand for childcare in an area. The more the estimated demand exceeds the estimated supply of childcare, the less access that parents have to childcare. A straightforward method is to use the number of young children as the estimate of demand and the licensed childcare capacity as the estimate of supply, but some studies use more complex methods to try to take into account other factors, including 1) staffing shortages that cause childcare centers to have substantially fewer slots than their licensed capacity, and 2) how families’ ability to travel to childcare providers in other areas can increase supply.
Studies generally find that many Americans live in areas where the demand for childcare exceeds the supply.1 Because an area can meet childcare demand even when it has more than one child per licensed slot—about 60% of U.S. households with children under age five use non-parental childcare regularly—straightforward methods often classify an area as lacking access when it has more than three young children per licensed slot. For example, a 2018 study by the Center for American Progress found that over half of Americans live in census tracts—small areas with population between 1,200 and 8,000—with more than three young children for every licensed childcare slot. The study concluded that nearly 60% of rural and low-income urban census tracts and about 40% of high-income suburban census tracts exceeded this ratio.
In particular, families living in large cities in the Seventh District often reside in areas with more than three young children per licensed slot. A Center for American Progress study from 2016 found that in Chicago, 84% of children under the age of five live in zip codes with more than three children per childcare slot. The Detroit Free Press concluded in 2022 that 12 zip codes across Detroit faced extreme capacity shortages of up to nine children for every licensed childcare slot. Using more complex methods, IFF, a Community Development Financial Institution that engages in research and evaluation, found that 52% of children in Milwaukee lived in census tracts with limited access to childcare.
The federal government classifies childcare as unaffordable for more than half of families in Iowa, Illinois, Indiana, Michigan, and Wisconsin.
The National Database of Childcare Prices (NDCP) contains state-level estimates of 2023 childcare prices across the United States based on state surveys that collect prices of licensed childcare providers. The NDCP estimates that families in Illinois, Michigan, and Wisconsin paid more for center-based childcare for a toddler—around $12,000 to $13,000 per year—than the U.S. average of about $11,500 per year (see figure 1). Families in Iowa and Indiana paid less than $11,000 per year. The U.S. Department of Health and Human Services defines childcare as affordable if it costs no more than 7% of annual household income. The figure below compares the NDCP cost estimates to this measure of affordability. By this measure, center-based childcare is unaffordable for the median family in all five District states: the average annual cost for one toddler ranges from 8% (Indiana) to 11% (Wisconsin) of median pay for a married couple with children and from 26% (Indiana) to 37% (Illinois) of the median pay of a single mother with children.2
1. Average cost of childcare and affordability
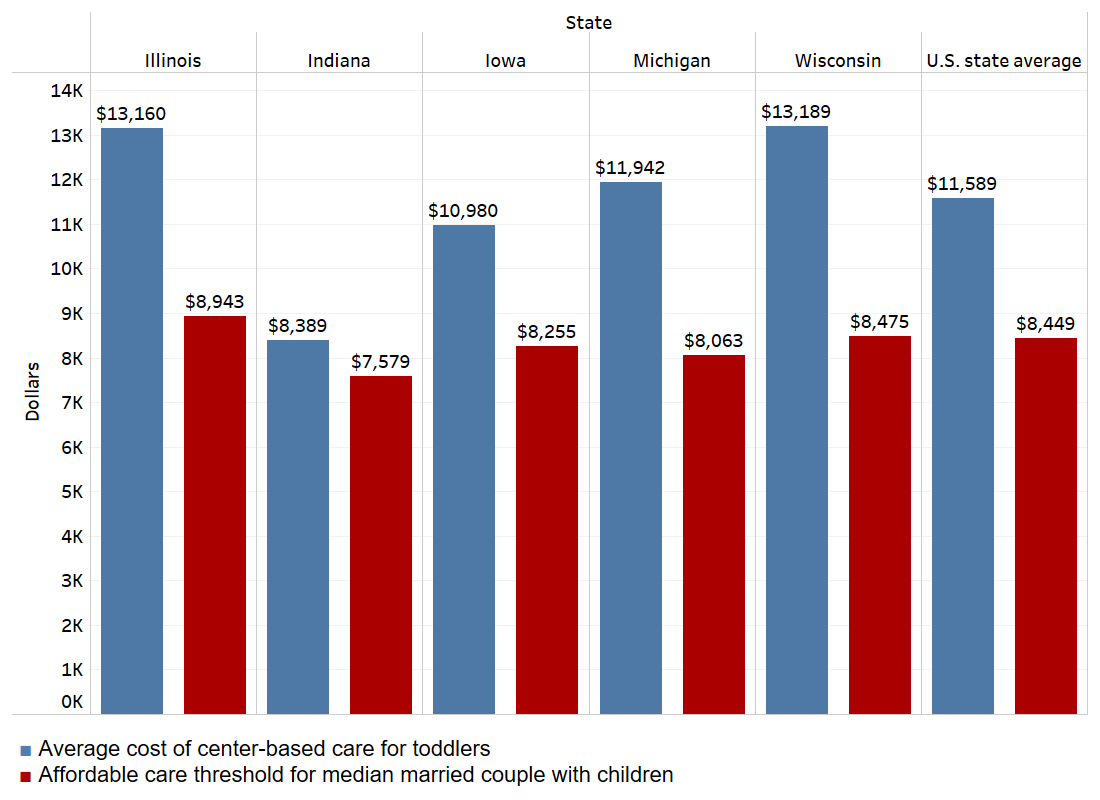
Sources: National Database of Childcare Prices, American Community Survey, and The Annie E. Casey Foundation.
Studies estimate that a lack of access to childcare costs state economies billions of dollars. Pandemic-era federal supports for the childcare industry and families are expiring.
Studies by the U.S. Chamber of Commerce and ReadyNation estimate that a lack of access to childcare costs state economies billions of dollars annually. These studies use surveys of parents with young children and economic models to estimate how challenges in childcare access and affordability affect the economy by 1) reducing parental working hours, job attendance, and earnings and increasing job search time, 2) increasing hiring costs and reducing revenue for businesses, and 3) reducing income and sales tax revenues. The Chamber of Commerce estimated the effect of insufficient childcare for parents with children under age six in eight states, while ReadyNation estimated the effect for parents with children under three in all 50 states. The estimates are similar, but slightly smaller (15% on average) in the Chamber of Commerce study than the ReadyNation numbers for the same eight states.
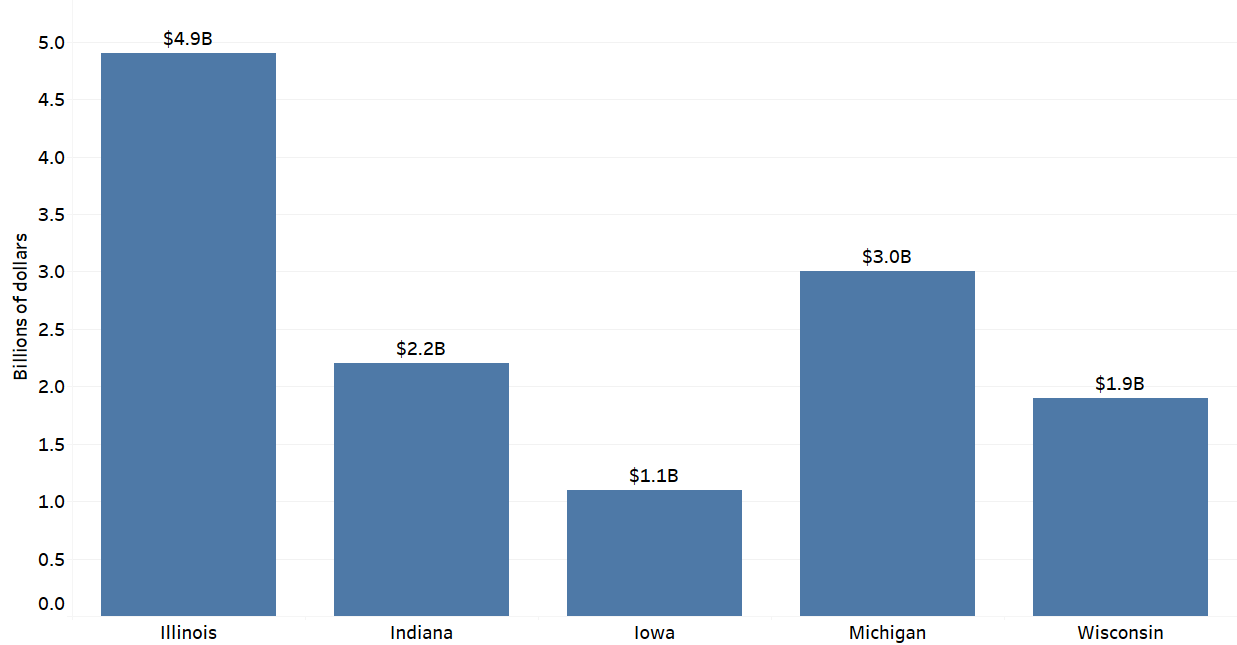
Cost estimates for Michigan—the only Seventh District state that both reports examine—are $2.3 billion (Chamber of Commerce) and $3 billion (ReadyNation) annually. ReadyNation estimates in the Seventh District range from $1 billion in Iowa to $5 billion in Illinois (see figure 2). For context, these amounts represent between 15% and 20% of annual individual income tax collections for each Seventh District state in 2022.3
2. One estimate of annual economic impact of limited access to childcare
Since women tend to adjust their work more than men when childcare issues arise, lack of childcare may be particularly salient in disproportionately female industries like education, healthcare, and social services, which employ over 23% of the Seventh District’s working population.4 As discussed in a recent Chicago Fed Insights article, limited access to childcare can also be particularly significant for women in industries with irregular working hours, such as construction, who may need childcare at times outside of providers’ traditional operating hours.
Pandemic-era federal supports for the childcare industry and families are expiring.
To preserve childcare slots and help families reduce childcare expenses, Congress provided $39 billion in funding through the American Rescue Plan Act (ARPA) of 2021. Because these pandemic-era supports were relatively large, the ending of these funds may result in centers closing or reducing capacity and families receiving less support, which would exacerbate access and affordability issues.
$24 billion of this funding was allocated for the stabilization of childcare providers. Childcare centers typically used this funding to increase wages and pay for rent or mortgages. Providers in the Seventh District perceived the ARPA stabilization funding as vital: between 33% and 46% of respondents in Seventh District states said their program would have closed during the Covid-19 public health crisis without government help. This funding expired in September 2023.
The remaining $15 billion supplemented the Child Care and Development Fund (CCDF), a federal subsidy that provides financial assistance to low-income families for childcare. This additional funding represented over a 500% increase in the program’s baseline 2021 budget. It is set to expire in September 2024.
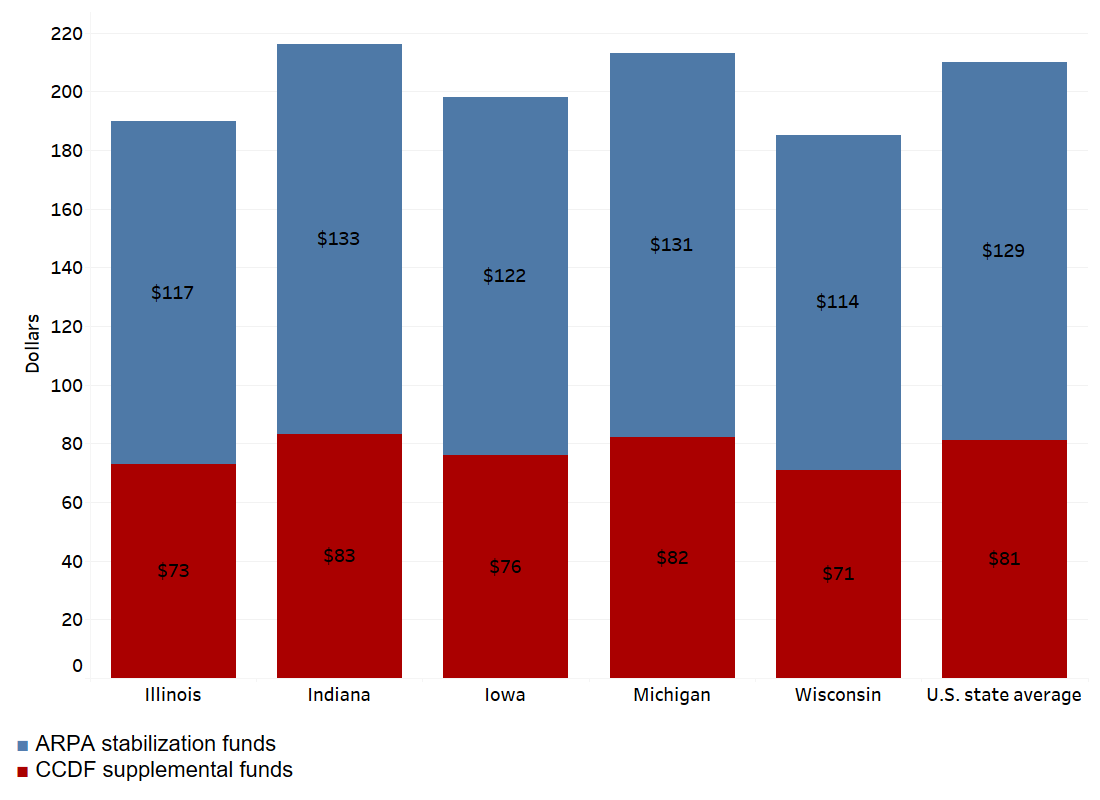
Nationwide, this $39 billion represents about $210 per child under five. In Seventh District states, the total funding amount per young child ranged from $185 in Wisconsin to $216 in Indiana (see figure 3).
3. ARPA childcare funding received per child under five
What are some key factors that help explain a lack of slots and high childcare costs?
Childcare providers often make less than 1% in profit margins. Low profit margins restrict providers’ ability to respond to financial and regulatory challenges. Here, we describe four challenges that childcare providers and researchers frequently cite that, combined with low profits, affect the availability and pricing of childcare.
1. Low pay limits supply of caregivers.
The main cost for childcare providers is labor, and most providers pay low wages to maintain their narrow profit margin. According to data from the U.S. Bureau of Labor Statistics, in May 2022, the median U.S. childcare worker earned $28,520 annually, while retail jobs paid a median salary of $30,600. Daycare owners can struggle to hire and retain employees at current wages. In a survey of early childhood education workers in the Seventh District, 68%–80% of respondents identified wages as the main challenge their center faced in recruiting new employees in 2021, while 63%–68% cited wages as the biggest reason early childhood educators leave the field. State-level reports of childcare centers across the country found similar numbers.
2. State-mandated caretaker–to–child ratios increase staffing costs and limit the number of licensed childcare slots.
State laws mandate a specific caretaker–to–child ratio. These ratios lead to high total staffing costs, with wages accounting for 50%–60% of provider expenses. Changing these staffing mandates so that more children could be cared for by a single caretaker could in theory save costs and expand childcare slots, but it also risks reducing the safety and quality of childcare programs.
3. State-mandated credentials for childcare employees may limit supply of caregivers able to work at licensed providers.
Many states, including Illinois, require college coursework for childcare employees, although there is limited evidence that it furthers child development or early academic performance. Meanwhile, given low wages, daycare owners may struggle to get applicants and retain workers with an associate’s degree or basic certificate. However, only 5% of daycare owners in Illinois surveyed by the NAEYC said finding candidates with adequate credentials was their main challenge in hiring.
4. Facility costs are increasing and can limit capacity.
Facility-related costs, including mortgage or rent, insurance, utilities, and maintenance costs, are around 15%–20% of centers’ costs and have been increasing. For example, according to data from the U.S. Bureau of Labor Statistics, from 2019 to 2023, electricity costs rose over 15% in the Midwest, and average rent increased over 20% for urban consumers nationwide (compared to 19% for overall inflation). When profit margins are low, facility-related costs can cause financial difficulties for childcare providers, increase tuition, and limit the number of childcare slots.
These four factors help explain the high cost and limited supply of childcare in many Seventh District communities, as well as the broader economic impacts. Better understanding these and other factors that contribute to challenges of childcare access can help support potential individual, community, industry, and government level approaches to addressing childcare-related barriers to employment faced by parents and other caregivers.
Notes
1 For example, see online here and here.
2 Data on median family income in 2022 inflation-adjusted dollars are from the American Community Survey.
3 Authors’ calculations using 2022 State Government Tax Tables.
4 Authors’ tabulations for Illinois, Indiana, Iowa, Michigan, and Wisconsin using ACS 5-year estimate, 2022, table DP03.


