

Russia’s invasion of Ukraine in early 2022 sparked heightened uncertainty over the economic outlook in both countries and prompted an increase in financial market volatility. One of the most impacted areas was the derivatives1 markets for wheat. As one might expect, wheat markets in the European Union (EU) showed significant effects. However, somewhat counterintuitively, the U.S. market had an even stronger price response. I attribute this to differences in market structure and greater access to U.S. markets, which allowed speculators to amplify some of the price movements.
Wheat futures prices and volumes primarily reflect supply and demand conditions for a specific type of wheat being bought and sold for physical delivery in a distinct location at a particular time. However, futures prices for similar wheat types are often highly correlated and may serve as partial substitutes for one another. As with other derivative markets, the futures markets for wheat support risk management needs by allowing producers and consumers to lock in prevailing price levels for settlement on a future date (i.e., hedging), as well as speculative activity2 where participants try to profit by buying, holding or selling derivatives.
In this Chicago Fed Letter, I provide an overview of the major global wheat-producing countries. I then show the impact to benchmark wheat contracts in the EU and the U.S. I analyze the changes in the underlying physical crop markets and compare the price changes in derivative prices in the U.S. I find that the Chicago wheat futures contracts had the strongest price response, even though the underlying physical wheat is not necessarily the same type of wheat. I attribute this to differences in market structure and greater access to U.S. markets, which allowed speculators to amplify some of the price movements.
Who produces wheat?
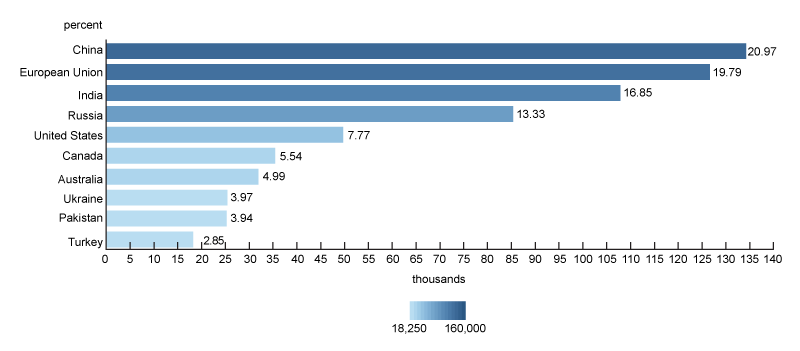
Wheat is a commodity and like most commodities, it is produced and exported by some countries and imported by others, with changes (perceived or actual) in supply expectations acting as primary price drivers. In 2020–21, Russia and Ukraine were among the top ten producers of wheat and accounted for roughly 14% and 4%, respectively, of the global wheat supply (as shown in figure 1). Prior to the invasion, Russia and Ukraine were considered the “breadbasket” of Europe as key suppliers to EU countries, given their physical proximity and the fact that many countries in the EU are net importers of wheat and other grains.3
1. Top ten countries producing wheat (metric tons), 2020–21
Wheat futures overview
Wheat market participants can use futures to hedge their price risk. Market participants trade the wheat futures at one or more futures exchanges. Specifically, producers of wheat (e.g., farmers) who are concerned about a potential decrease in future prices will sell (i.e., go short) wheat futures, while consumers (e.g., wheat processers) who are concerned about an increase in future prices will buy (i.e., go long). Since wheat futures settle to the underlying physical commodity, the prices of near-dated futures and their underlying reference generally change in tandem. The difference between futures and physical reference is commonly known as the “basis.” Still, there may be some additional variance in supply and demand differences among storage locations.
Wheat futures in the EU
The European benchmark most used to hedge and price wheat is Milling Wheat No. 2. Futures and options referencing the benchmark are traded at Euronext, which is headquartered in Paris. The contract is used by a wide range of market participants, from trading or investment firms to importers, exporters, and millers. It is the most liquid benchmark based on volumes traded for the European region and is priced in euros per ton.
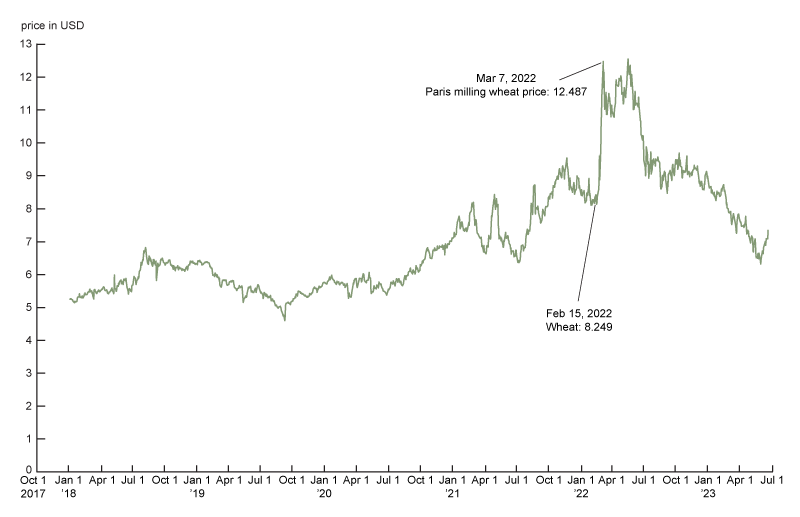
To illustrate the impact of supply forecasting, figure 2 shows the price changes since 2018 for milling wheat futures. As concerns grew about supply interruptions related to the Russian invasion of Ukraine, the prices increased in excess of 50% in U.S. dollar (USD) terms between February 15, 2022 (the week prior to the invasion, as concerns started to mount that the invasion would take place), and March 7, 2022 (close to two weeks after the invasion started). Moreover, the prices eclipsed previous peak levels observed in March 2008. The prices did eventually retract as supply concerns dissipated.
2. USD price of milling wheat
Wheat futures in the U.S.
As shown in figure 1, the U.S. is also a major producer of wheat. In the U.S. there are two wheat crop seasons—winter and spring. Winter wheat is planted in the fall. In the colder winter months, this wheat will go dormant and resume growing in the spring. Wheat can be classified as hard or soft. Spring wheat is planted in the spring and harvested in the fall. Like the Euronext contracts, futures contracts on U.S. wheat are used by a wide range of market participants. The main contracts that support the various types of wheat are:
- Hard red spring (HRS) wheat is grown mostly in the Upper Plains of the U.S., and the corresponding futures are traded on the Minneapolis Grain Exchange (MGEX).
- Hard red winter (HRW) wheat is grown mostly in the Lower Plains, and the corresponding futures are currently traded on the Chicago Board of Trade, or CBOT (part of CME Group), but originally traded on the Kansas City Board of Trade, or KCBOT.
- Soft red winter (SRW) wheat is primarily grown in the midwestern states, and the corresponding futures are traded at the CBOT. The SRW is the largest globally traded wheat contract and is widely accessible to derivatives traders, as the contract is traded on one of the largest derivatives marketplaces.4 Therefore, it has been used as the global benchmark for pricing wheat.5
- Soft white winter (SWW) wheat is grown in the northwestern states; it does not have a corresponding futures contract that is actively traded.
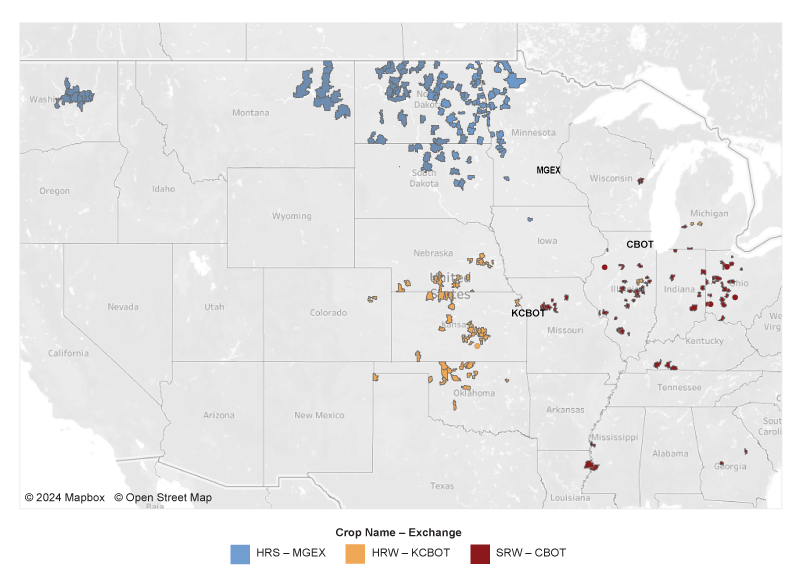
Figure 3 provides a map of crop storage locations in the U.S. In general, the original exchange that supported the trading of the relevant future tends to align with the geography of where the underlying crop storage is located. The futures contracts are priced in USD and typically trade in cents per bushel in the U.S.
3. Crop storage location by wheat type and exchange
Even though wheat is grown in different parts of the globe, different types of wheat can serve as substitutes for one another. This implies that supply concerns from other markets could impact U.S. wheat prices. To illustrate this, figure 4 shows the price changes since 2018 for the wheat futures traded on U.S. exchanges.
4. Wheat futures prices in the U.S.
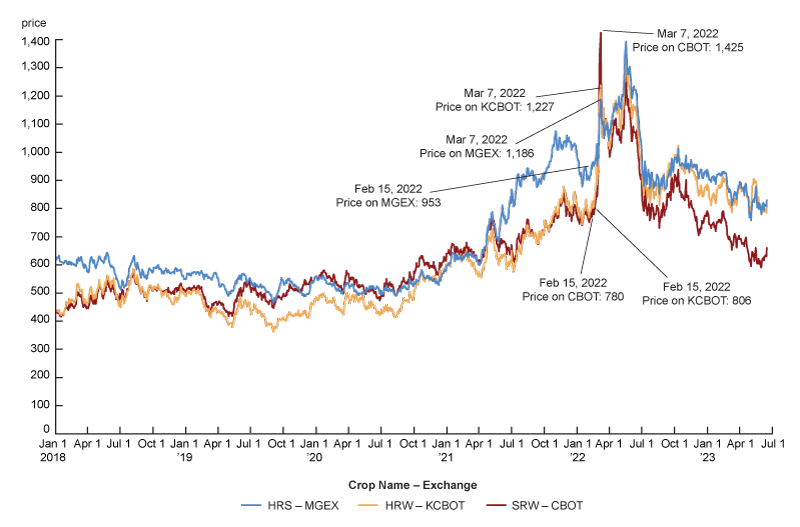
As concerns grew about supply interruptions related to the Russian invasion of Ukraine, figure 4 shows that U.S. wheat prices also increased notably from February 15, 2022, through March 7, 2022:
- In excess of 20% for hard red spring wheat;
- Greater than 50% for hard red winter wheat; and
- More than 80% for soft red winter wheat.
How did the market action in the Chicago contract compare to the Paris contract?
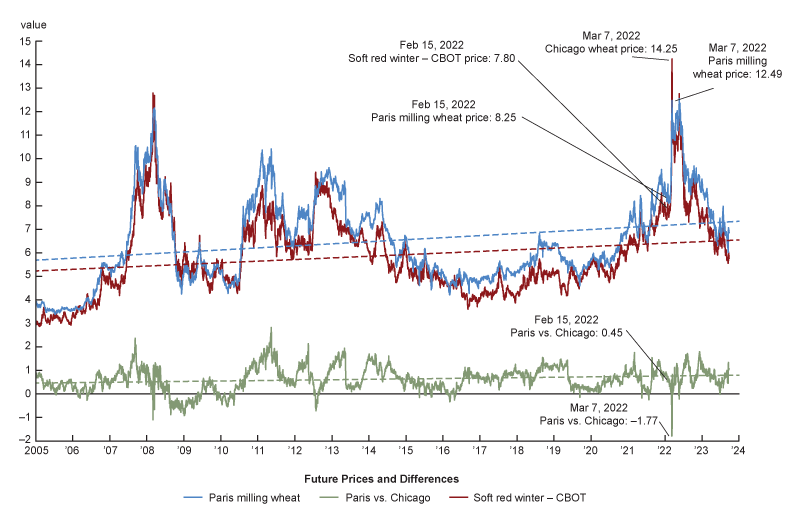
As shown in figure 4, the dramatic price swings in SRW Chicago contracts exceeded the changes of the Euronext milling wheat contracts shown in figure 2. Figure 5 shows the difference between the contracts over a longer time frame and illustrates that, even though the Chicago contract is a larger and more liquid market, the Paris-based milling contract generally traded at a premium to the Chicago contract. Part of the premium reflects the higher protein content of the type of wheat in the Paris contract; the higher protein content makes milling wheat more valuable to consumers. Nevertheless, during the stress period, the difference swung from 45 cents richer on February 15, 2022, to 177 cents cheaper on March 7.6 Moreover, the two-contract spread reached a discount level not observed in the prior two decades, implying a market dislocation.
5. Chicago and Paris wheat futures prices and differential
The dislocation in the Chicago wheat markets
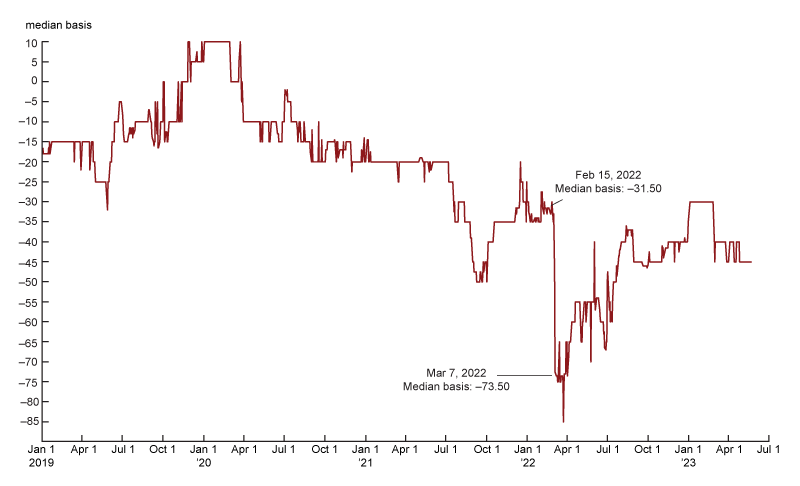
Since wheat futures settle to the underlying physical commodity, the price of the futures contract converges to the physical price at the time of settlement. However, there is a basis between futures and physical cash prices prior to expiration. Using data from GeoGrain, I calculated the median difference (i.e., the basis) between the underlying cash price at storage facilities and the closest-to-expiration futures contract (typically the contract expiring in the current month or next). Figure 6 shows that, prior to 2022, the cash price is typically between 10 cents richer to 50 cents cheaper to the corresponding futures price. However, it is evident that the median basis changed dramatically, that is, the cash price went from trading 31.5 cents cheaper to 73.5 cents cheaper from February 15, 2022, to March 7, 2022.
6. Basis of soft red winter wheat
What caused the dislocation?
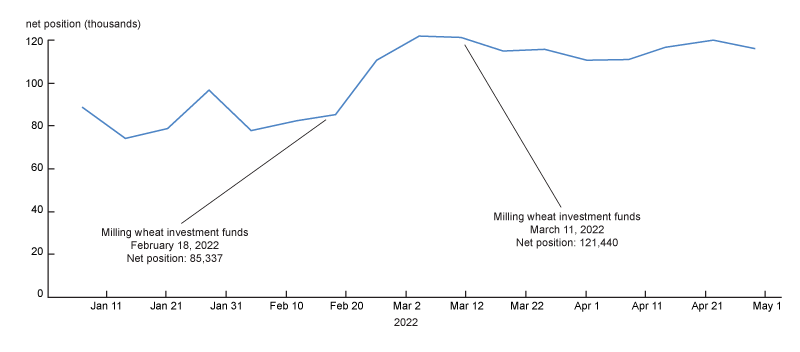
As mentioned previously, there are many different types of market participants in the commodity futures market. As with other futures markets, speculators are active participants in commodities. Speculators transact in commodity futures with the aim to garner profits. The positioning of speculators is tracked by market regulators, and periodic reports showing positions are available to the public. For the Chicago SRW contract, a weekly report by the Commodity Futures Trading Commission (CFTC) shows the aggregate positions of money managers. For the Paris contract, Euronext issues a weekly report of investment fund positions. The positions of these speculators are shown in figure 7 for the first four months of 2022.
7. Positioning of speculators in Chicago and Paris wheat futures
A. Euronext Commitments of Traders report, investment funds
B. CFTC Commitments of Traders report, money manager positions
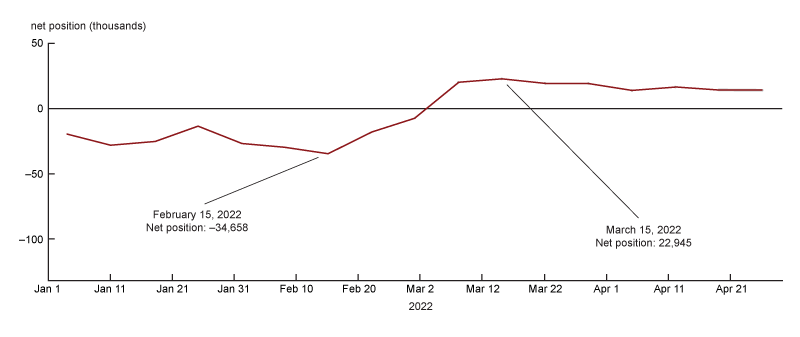
While the reports do not show positioning on the exact dates highlighted in the prior figures, the nearest dates are marked. Based on the figure, it appears the long positioning on the Paris contract did increase by approximately 36,000 (roughly an increase of 120 million bushels). However, in the Chicago contract, the speculative positions flipped from net short roughly 35,000 to net long in excess of 20,000 (roughly a change of 275 million bushels).7 Since these position changes coincided with the massive price changes in the Chicago wheat contract, it is likely that short covering drove—and likely exacerbated—the price swings in the futures contract.
Why did speculators appear to be more active in the Chicago contract than elsewhere?
Discussions with market participants revealed the possibility that speculators rushed to buy U.S. wheat futures upon the news of Russia invading Ukraine, simply because that contract was easily available to participants to trade. As I mentioned previously, the CBOT exchange is within the CME Group, and almost all derivatives traders have access to CME as it hosts a broad spectrum of derivative products. On the other hand, Euronext has less connectivity to derivative traders due to its smaller set of derivative products. This distinction, and the CBOT contract’s presumed correlation to its European counterpart, may have been why speculative traders created buying imbalances for the Chicago contract. The speculative buying activities were either constrained because the participants had no access to the Paris contract or perhaps because they were misinformed about the difference in the wheat futures contracts. It logically follows that such participants would have quickly unwound their positions, which also helps explain the subsequent reversion of price differentials to historical trends.
Conclusion
The wheat futures markets are an important means of hedging risk for producers and consumers, as well as for speculating with a view to generating trading profits. In reviewing the events of 2022, I observed a notable increase in price volatility among the various wheat futures contracts when Russia invaded Ukraine. While wheat futures prices increased by 50% in the Paris markets, the prices increased even more in the Chicago markets. Moreover, the Chicago futures markets deviated substantially from the physical prices of the related wheat inventory and appeared to be driven at least in part by changes in positioning of speculators from short to long over the period. As I mentioned earlier, the wider access to the Chicago derivatives market relative to the Paris market likely led to speculators’ preference to trade the Chicago contract.
The wheat markets are a complex network of derivative products and market participants, and there is potential for speculators to create dislocations in these markets. In reviewing the 2022 market dislocations, I identified three key takeaways. First, while convergence of physical grain and futures prices will eventually occur at settlement, in the short term the price dislocations can be large. Since commercial producers and consumers rely on the futures markets to hedge price risk for a wide variety of commodities, such stress events may force them to endure temporary mark-to-market losses, requiring them to have more available funding than usual to collateralize their derivative positions (Patel, 2020). Second, if participants choose to hedge with a similar and more liquid futures contract (i.e., a proxy hedge), these issues can be even more profound. Ironically, the efficiency and cost benefits of maintaining hedges using the most liquid instruments can become costly in times of stress, given the potential for severe price dislocations as I documented. Finally, without proper funding for producers and consumers to maintain their futures positions amid large but temporary price dislocations, these firms may also have to unwind their positions. This can further exacerbate price swings and create concerns for financial stability in the affected markets. Potential solutions to mitigate temporary impacts of severe price dislocations to commercial hedgers may be a worthwhile subject for future examination.
Note: I would like to thank Tim Fawls for his research data assistance. I would like to thank Cindy Hull, Michael O’Connell, and David Oppedahl of the Federal Reserve Bank of Chicago and Shengwu Du of the Federal Reserve Board, Sam Schulhofer-Wohl of the Federal Reserve Bank of Dallas, Jeff Ollada of Mizuho Americas, Damien Lefebvre, and Larry Weithers of DRW for their helpful comments.
Notes
1 Derivatives are financial contracts where buyers and sellers agree to settle obligations at a future date. The final settlement for a commodity derivative typically is when one party of a trade delivers the physical commodity to the other party.
2 More information about the impact of speculation in markets is available online.
3 More details are available online.
4 More information is available online.
5 More details are available online.
6 Note that the time zones of the two markets are different, and therefore, the results in the figure would change if prices from the exact same time across the two exchanges were used. However, I reviewed intraday data from a market participant that illustrates similar divergence between the two contracts.
7 The Euronext contract is 50 tons, which is equivalent to 3,387.19 bushels based on the conversion from the U.S. Grains Council.


