Measuring the Decline in Economic Activity During the Covid-19 Pandemic
On June 8, 2020, the National Bureau of Economic Research (NBER) issued a statement announcing that its Business Cycle Dating Committee determined U.S. economic activity had reached a cyclical peak in February 2020. Beginning in March 2020, a multitude of economic indicators declined sharply as public health orders that required nonessential businesses to close were implemented during the early stages of the Covid-19 pandemic here in the U.S. The declines then accelerated in April as these orders were expanded to cover nearly the entire country. However, the data for May released so far seem to indicate that once the orders were eased or lifted, the rates of decline slowed. Here, we take a closer look at these changes using several summary indexes of economic activity.
The first index we examine is the Chicago Fed National Activity Index (CFNAI). The CFNAI is a monthly index designed to gauge overall economic activity for the U.S. based on 85 economic indicators drawn from four broad categories of macroeconomic data: production and income; employment, unemployment, and hours; personal consumption and housing; and sales, orders, and inventories. Each indicator measures some aspect of macroeconomic activity. The derived index then provides a single summary measure of the most important factor common to all of them. To arrive at this factor, a statistical technique referred to as principal components analysis is used.
The CFNAI is constructed to have an average value of zero and a standard deviation of one. Since economic activity tends toward a trend growth rate over time, a positive index reading has historically been associated with growth above trend and a negative index reading with growth below trend.1 The latest release of the CFNAI—which came out on May 26, 2020, for data through April 2020—reported the index had reached an all-time low in its history extending back to March 1967. Many of the underlying data series that make up the index similarly experienced record declines. For example, industrial production dropped by roughly 11% in April—its largest single monthly decline on record since 1921, when it started to be tracked. Similarly, nonfarm payrolls fell by almost 14% in April—its largest single monthly decline in its history going back to 1939.
Figure 1 plots the CFNAI along with a similar index produced by the Federal Reserve Bank of Philadelphia called the Aruoba-Diebold-Scotti Business Conditions Index (ADSBCI). Both indexes are shown as standard deviations from their sample means. While the ADSBCI covers only six macroeconomic data series, five of them are also in the CFNAI and they tend to be those that receive large weights in that index.2 Accordingly, a close correspondence with the CFNAI is evident in the figure. At –17.07 standard deviations from trend, the ADSBCI’s value in April was slightly lower than the CFNAI’s, which stood at –16.74 standard deviations from trend. However, both values represent record lows for their respective indexes and far exceeded what was experienced during any recent recession in the U.S. (the shaded regions in the figure).
Figure 1. Chicago Fed National Activity Index (CFNAI) versus Aruoba-Diebold-Scotti Business Conditions Index (ADSBCI)
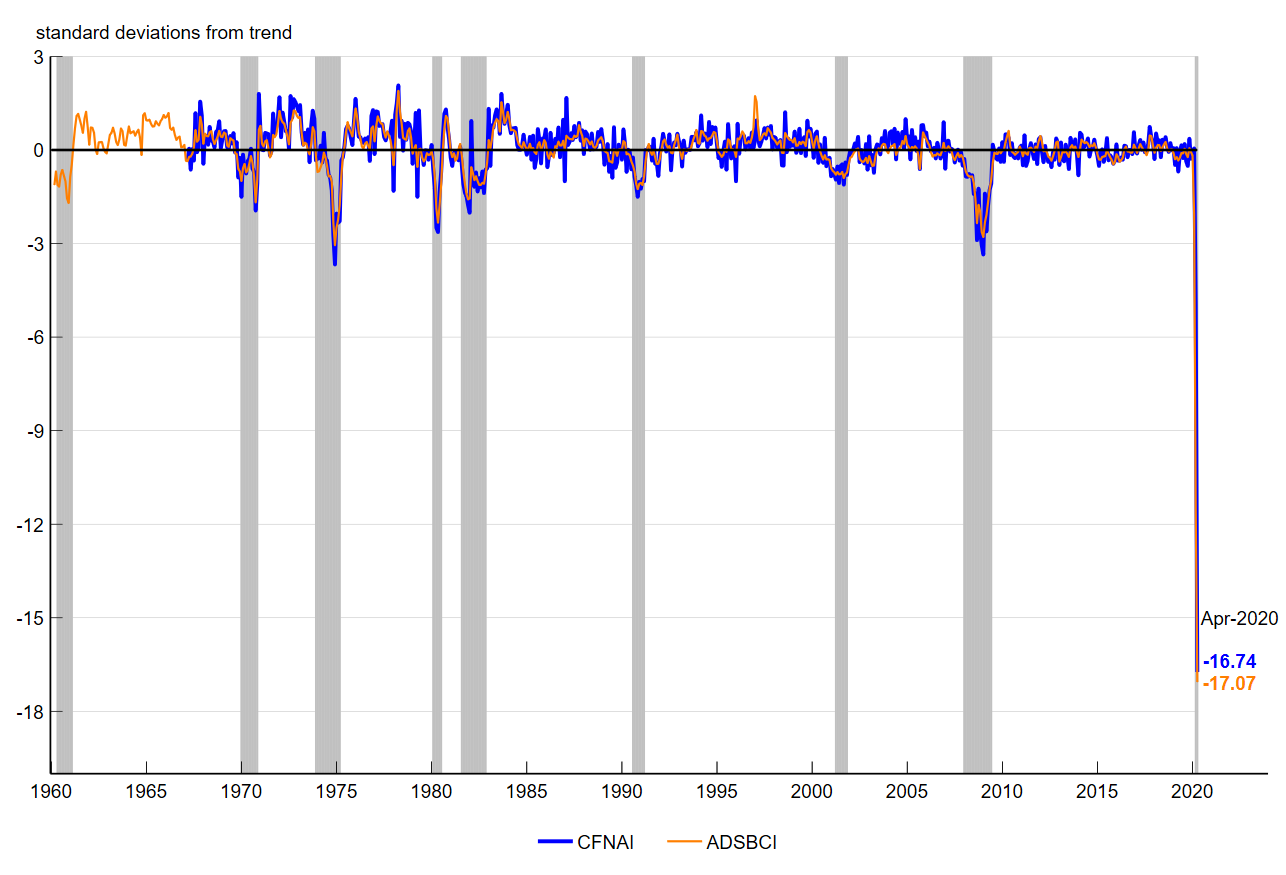
Sources: Federal Reserve Bank of Chicago; and authors’ calculations based on data from the Federal Reserve Bank of Philadelphia from Haver Analytics.
The ADSBCI uses a different statistical technique referred to as dynamic factor analysis to weight up its weekly and monthly data series along with quarterly U.S. gross domestic product (GDP). An advantage of this technique is that the index can be easily updated in real time as new data are released. Data releases for May (such as the Employment Report from the U.S. Bureau of Labor Statistics) suggest that the nadir for economic activity might have been in April. The more recent history of the ADSBCI using the data available through June 11, 2020, shown in figure 2, suggests some improvement in economic activity in May. Yet, it is worth pointing out that the available data for May used in the ADSBCI was limited to initial unemployment insurance (UI) claims and nonfarm payrolls at the time of writing this post. Initial UI claims decreased by almost 2 million in May, and nonfarm payrolls increased by a record 2.5 million jobs in May. As additional May data become available, the ADSBCI will be updated to incorporate this information.
Figure 2. Brave-Butters-Kelley (BBK) Coincident Index versus Aruoba-Diebold-Scotti Business Conditions Index (ADSBCI)
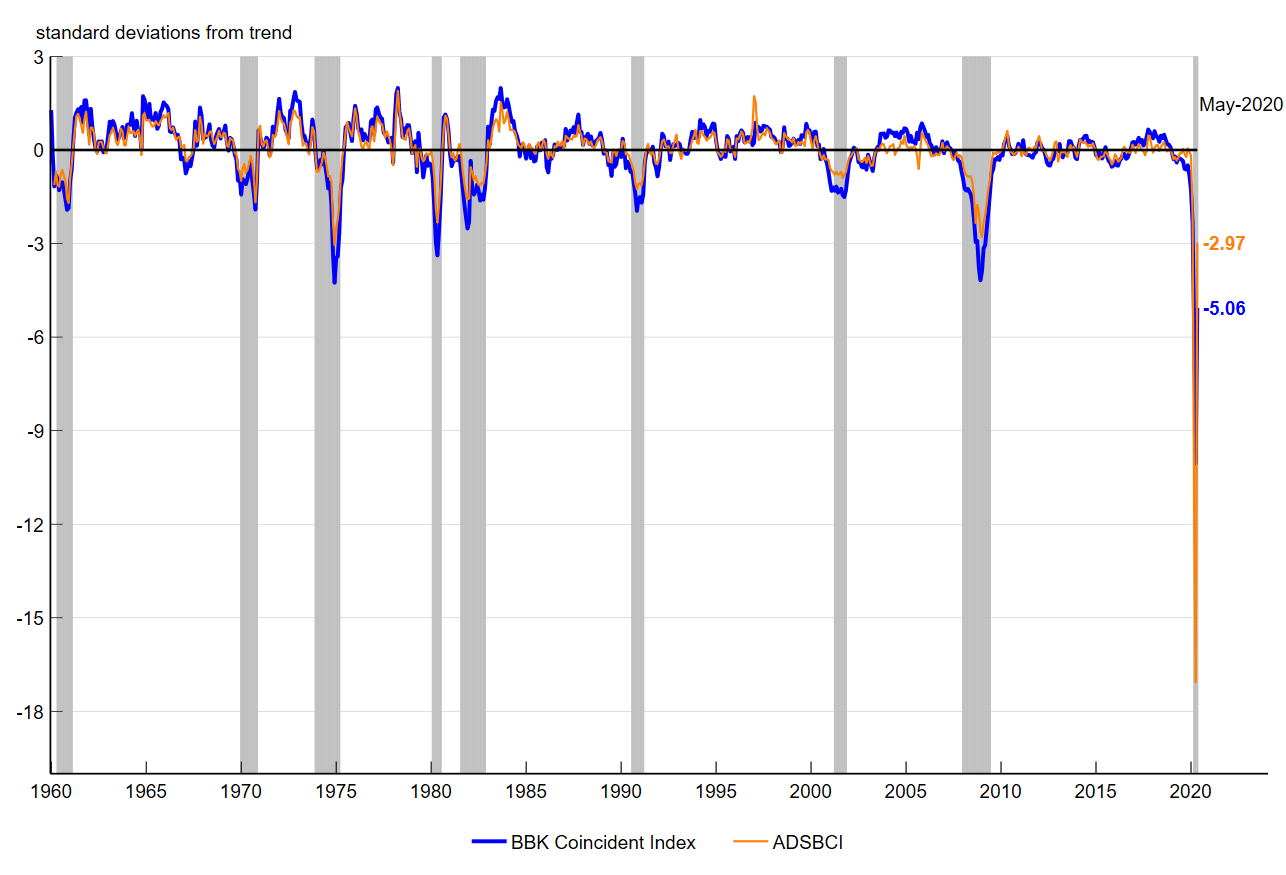
Sources: Authors’ calculations based on data from the Federal Reserve Bank of Chicago and Federal Reserve Bank of Philadelphia from Haver Analytics.
Besides the CFNAI, the Chicago Fed also produces the Brave-Butters-Kelley Indexes (BBKI)—economic activity indexes constructed using collapsed dynamic factor analysis. This technique combines elements of principal components analysis and dynamic factor analysis, and allows us to easily update the indexes as data become available. The Brave-Butters-Kelley Indexes are based on a set of 500 monthly indicators of growth in U.S. economic activity and quarterly GDP growth—almost six times more indicators than used for the CFNAI. Figure 2 plots a preliminary estimate for May of one of the BBKI—the BBK Coincident Index—along with the ADSBCI. This estimate of the BBK Coincident Index is based on 200 of 500 data series that were available through May as of June 12, 2020. The BBK Coincident Index is scaled similarly to the ADSBCI in the figure, capturing growth in standard deviations from trend. Trend growth for the BBK Coincident Index is explicitly measured by trend U.S. real GDP growth since January 1960.
Given the limited amount of data available for May at this time, the May value for the BBK Coincident Index in figure 2 should be treated as a first read on the macroeconomic data. The official release of the BBKI for May will not come out until July 1, 2020. With that caveat aside, one can see from the figure that the BBK Coincident Index and ADSBCI track each other fairly closely and align quite well with historical U.S. recessions. Both indexes declined sharply in March and April of this year and have improved some so far in May based on the available data; but the decline in April was less steep and the increase in May less pronounced for the broader BBK Coincident Index.
A similar pattern can also be seen in figure 3—which compares one of the BBKI with the Weekly Economic Index (WEI), a new economic activity index produced by the Federal Reserve Bank of New York. Like the ADSBCI, the WEI is published on a weekly basis. It is scaled in terms of year-over-year GDP growth. To make an apples-to-apples comparison in this case, we transform BBK Monthly GDP Growth (an index estimated from the BBKI model) into year-over-year GDP growth. Unlike the other indexes described previously, the WEI through May (using data available as of June 12, 2020) has yet to show much improvement in economic activity from April. In contrast, BBK Monthly GDP Growth on a year-over-year basis (using data available as of June 12, 2020) declined less in April than the WEI, and was much less negative in May than the WEI. It should be noted, however, that unlike the WEI, BBK Monthly GDP Growth includes actual GDP data as one of its indicators. Official GDP data will not be made available for the second quarter of 2020 until the end of July. As such, BBK Monthly GDP Growth could be revised when this information becomes available from the U.S. Bureau of Economic Analysis.
Figure 3. Brave-Butters-Kelley (BBK) Monthly GDP Growth versus Weekly Economic Index (WEI)
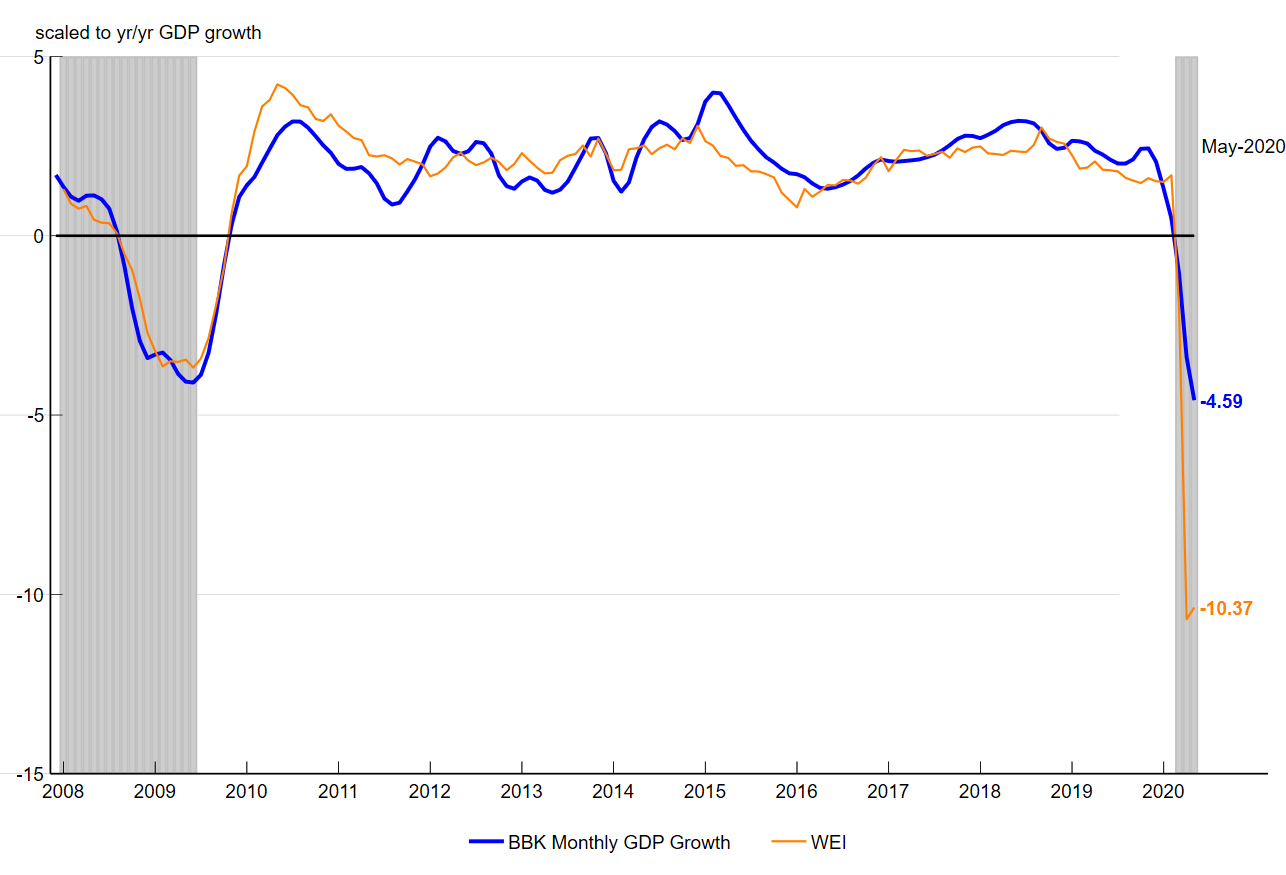
Sources: Authors’ calculations based on data from the Federal Reserve Bank of Chicago and Federal Reserve Bank of New York from Haver Analytics.
Based on the data through June 12, 2020, the speed and magnitude of the decline in economic activity during the Covid-19 pandemic have no parallels in the recent past. Table 1 contains the recent values of all of the indexes discussed here since the beginning of the current recession in March 2020. With the public health orders in the U.S. having been relaxed or lifted altogether in recent weeks, economic activity is changing across the country. These summary indexes of activity should continue to shed further light on the path of the economy in the coming months. More information on the CFNAI and BBKI can be found on the Chicago Fed’s Economic Data page.
For further analysis on how all these summary indexes tracked the subsequent recovery in economic activity, please read this follow-up post.
Table 1. Recent index values, 2020
| Mar | Apr | May | |
|---|---|---|---|
| std. dev. units | |||
| CFNAI | –4.97 | –16.74 | |
| ADSBCI | –11.51 | –17.07 | –2.97 |
| BBK Coincident Index | –5.83 | –10.05 | –5.06* |
| y/y GDP growth rate | |||
| BBK Monthly GDP Growth | –1.04 | –3.39 | –4.59* |
| WEI | –1.98 | –10.69 | –10.37 |
Notes: This table shows recent values for each series presented in figures 1–3. The values for the Chicago Fed National Activity Index (CFNAI), Aruoba-Diebold-Scotti Business Conditions Index (ADSBCI), and Brave-Butters-Kelley (BBK) Coincident Index are in standard deviation units, and the values for BBK Monthly GDP Growth and the Weekly Economic Index (WEI) are scaled to year-over-year GDP growth.
Sources: Authors’ calculations based on data from the Federal Reserve Bank of Chicago, Federal Reserve Bank of Philadelphia, and Federal Reserve Bank of New York from Haver Analytics.
Notes
1 The index was first developed as a method of better predicting inflationary pressures, but over time, it has primarily been used instead to capture turning points in the U.S. business cycle; see, e.g., “The 2001 recession and the Chicago Fed National Activity Index: Identifying business cycle turning points” and “The Chicago Fed National Activity Index and business cycles.”
2 The six indicators are nonfarm payrolls, industrial production, real manufacturing and trade sales, real personal income less transfer payments, initial unemployment insurance claims, and real gross domestic product growth for the U.S. The last series is not used to construct the CFNAI.


