Introducing CARTS: A New Index Tracking National Retail Spending
During the early days of the Covid-19 pandemic in the U.S., the speed with which economic activity responded to the spread of the virus and the public policy responses that followed laid bare the need for both accurate and timely measures of consumer spending. In this Chicago Fed Insights blog post, we discuss a new Chicago Fed index called CARTS and its implications for the high-frequency measurement of consumer spending. For more information and to sign up to receive CARTS updates by email, go to this page.
What is CARTS?
CARTS—which is short for Chicago Fed Advance Retail Trade Summary—refers to a weekly index of national retail spending that tracks the U.S. Census Bureau's Monthly Retail Trade Survey (MRTS) using a mixed-frequency dynamic factor model to combine high-frequency time series from five private companies (Consumer Edge, Facteus, Morning Consult, SafeGraph, and Womply), as well as two federal agencies (the U.S. Energy Information Administration and the U.S. Census Bureau). By using multiple sources of information on consumer spending measured at different frequencies, this model accurately predicts the MRTS in real time as well as reveals substantial week-to-week variation in retail spending that cannot be seen in the MRTS. For further details on the index’s construction and how we test its accuracy against consensus forecasts, baseline autoregressive models, and other high-frequency data, see “Tracking U.S. consumers in real time with a new weekly index of retail trade.”
What does CARTS tell us about national retail spending?
The MRTS is a vital snapshot of consumer spending on goods and select services in the U.S. The Census Bureau notes the following about MRTS:
These data are widely used throughout government, academic, and business communities. The Bureau of Economic Analysis uses the estimates to calculate Gross Domestic Product. The Bureau of Labor Statistics uses the estimates to develop consumer price indexes and productivity measurements. The Council of Economic Advisers uses the estimates to analyze current economic activity. The Federal Reserve Board uses the estimates to assess recent trends in consumer purchases. The media use the estimates to report news of recent consumer activity. Financial and investment companies use the estimates to measure recent economic trends.1
However, because official statistics on consumer spending such as the MRTS are typically only available at a monthly frequency, analysts often turn to other more-frequent sources of information to supplement them. Reconciling these alternative high-frequency data sources with official statistics can be very difficult. CARTS was designed with this challenge in mind. Thus, CARTS provides at a weekly frequency an early and reliable snapshot of the MRTS using several high-frequency alternative data sources on credit & debit card transactions, mobility (capturing retail foot traffic and gasoline sales), and consumer sentiment. Unlike these individual alternative measures, however, CARTS is also benchmarked to the MRTS, such that historical values when averaged over the month are identical to the Census Bureau’s estimates of retail & food services sales excluding motor vehicles & parts (ex. auto). When this data series is not yet available for the latest month, CARTS estimates it.
This can be seen in figure 1 showing our Weekly Index of Retail Trade from the July 9, 2021, CARTS release in comparison with the historical MRTS data and the Census Bureau’s most recent advance estimates of retail spending—which are called the MARTS (Advance Monthly Retail Trade Survey) and are the preliminary release of the MRTS data. When the MARTS is not yet available, recent weekly readings of the Weekly Index of Retail Trade can be used to project current monthly retail & food services sales ex. auto. For example, in its July 9 release, CARTS suggested that retail & food services sales ex. auto increased by 0.8% in June relative to May. This result was somewhat higher than the median of consensus forecasts for retail & food services sales ex. auto available on July 8—a gain of 0.3% in June relative to May.2
Figure 1. Retail & food services sales ex. auto
billions of $, seasonally adjusted
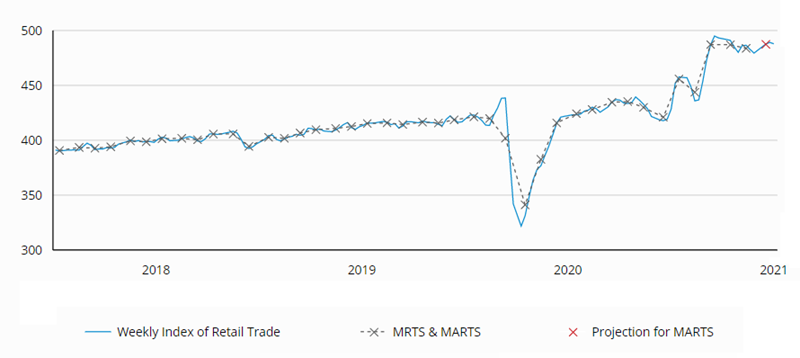
Source: Federal Reserve Bank of Chicago, CARTS.
This CARTS projection can be explained by two factors: 1) past values of the monthly MRTS and MARTS and 2) recent weekly readings on credit & debit cards, mobility, and consumer sentiment. For June, past values of the MRTS and MARTS contributed around 0.3%, credit & debit cards contributed about 0.1%, and mobility measures contributed roughly 0.4% (while consumer sentiment made a neutral contribution) to our projection. These contributions reflect an expected rebound from the decline in May in the MARTS data, boosted by gains in seasonally adjusted credit & debit card transactions and gasoline consumption.
What else does CARTS tell us about consumer behavior?
In addition to being able to use CARTS to project the MRTS in real time, its weekly frequency of observation allows us to study the high-frequency drivers of consumer spending at a more granular level. We can see this historically in figure 2, which displays the week-over-week (w/w) percent change (in logs) for our Weekly Index of Retail Trade broken down into contributions from the monthly MRTS and MARTS data and the weekly data on credit & debit cards, mobility, and consumer sentiment.
Figure 2. Weekly Index of Retail Trade
log percent change, w/w
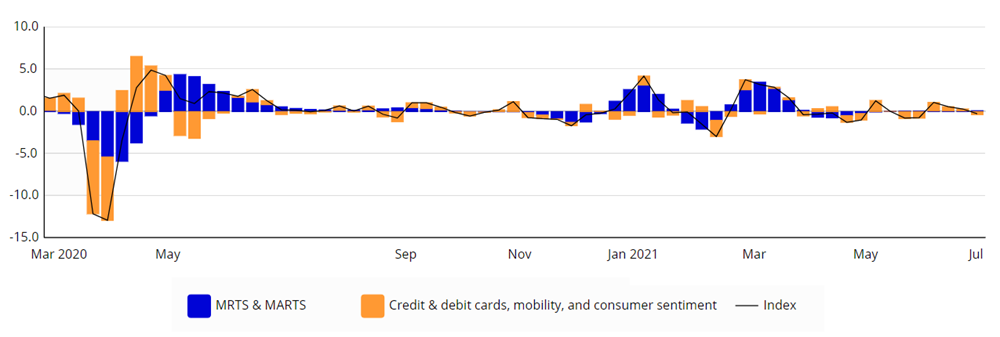
Source: Federal Reserve Bank of Chicago, CARTS.
We can see from figure 2 that both data types are important in explaining high-frequency fluctuations in national retail spending. The use of multiple types and frequencies of data is, thus, an advantage that CARTS has over other existing alternatives. For example, our Weekly Index of Retail Trade tracks retail spending with less volatility than several alternatives that rely solely on credit & debit card data and at the same time reveals facets of national retail spending that cannot be seen in the MRTS. For example, in March 2020 our weekly index identifies a stockpiling effect in the early stages of the Covid-19 pandemic, which is not noticeable in the averaged monthly spending data from the MRTS. Additional examples such as this include tracking the real-time effects of Covid-19 cases and the economic impact payments on consumer spending. Further details on the usefulness of CARTS as a weekly indicator of consumer spending are available online.
Is CARTS adjusted for inflation?
Table 1 shows recent values for the month-over-month (m/m) percent change in retail & food services sales ex. auto in addition to our projection for June. These data (as well as those in figures 1 and 2) are shown in nominal terms, meaning that they are not adjusted for changes over time in the prices of retail goods and services. To account for the fact that real consumer spending is often desired, the table also displays an inflation-adjusted version of the data, where we use a corresponding price index from the U.S. Bureau of Economic Analysis (BEA) to measure retail price inflation.
Table 1. Recent monthly values
percent change, m/m
| Jun '21 | May | Apr | Mar | Feb | Jan | |
|---|---|---|---|---|---|---|
| Retail & food service sales ex. auto | 0.8* | –0.7 | 0.0 | 9.8 | –2.7 | 8.3 |
| Inflation adjusted | 0.5* | –1.1 | –0.4 | 8.6 | –3.3 | 7.2 |
| BEA price index | 0.3* | 0.5 | 0.4 | 1.1 | 0.7 | 1.0 |
Source: Federal Reserve Bank of Chicago, CARTS.
Like the MRTS, the BEA price index is only available with a lag. Therefore, to display recent values in the table, we must project it. To do so, we use a mixed-frequency vector autoregression that includes the monthly BEA price index and a weekly index of online prices from State Street PriceStats. We have found this model to be a reliable predictor of the BEA data.3
Retail prices have risen considerably in early 2021. However, online price inflation has since moderated somewhat; and based on these data, we project the BEA price index to have increased 0.3% in June. Adjusting for inflation, retail & food services sales ex. auto is projected to have increased 0.5% in June after declining in both May and April.
Conclusion
Updates to CARTS are released at 10:00 a.m. ET on scheduled days. Note that while CARTS is a weekly index, we release it only twice per month: The first release of the month covers the entirety of the previous month (final release), and the second release covers the first half of the current month (preliminary release).
Notes
2 The consensus forecasts referenced in the text refer to the median forecasts from surveys by Action Economics and Informa Global Markets accessed via Haver Analytics.
3 We use the log first-difference of the monthly BEA price index and the weekly State Street PriceStats overall measure of online prices to project monthly retail price inflation with an MF-VAR that includes two weekly lags. Based on pseudo real-time out-of-sample testing of this model, we find that it outperforms a monthly autoregressive model including two monthly lags of the BEA price index by about 20% in terms of lower root mean-squared error and mean absolute error over a sample period that covers 2014 to the present.


