

This article explains what the Detroit Economic Activity Index (DEAI) tells us about Detroit’s economic progress as of late 2019. Although the rate of progress had slowed some since 2016, the city continued to make headway last year in its recovery from bankruptcy.
In a previous Chicago Fed Letter,1 we introduced the DEAI to show that Detroit was doing better in late 2016 than in late 2014, when it exited bankruptcy. According to the DEAI, there were signs of increasing private investment, higher employment, lower unemployment, rising incomes, and improving real estate values in December 2016. In this article, we discuss the DEAI’s performance through the end of 2019, which suggested that Detroit’s economy was still improving, although at a slower rate than before.
The DEAI and Detroit’s recovery in 2019
The Detroit Economic Activity Index (DEAI) measures growth in economic activity for the city of Detroit using a mixed-frequency dynamic factor model of 24 Detroit-specific data series.2 These data series are broadly classified into four categories: labor, income, real estate, and trade. An index value greater than zero points to above-trend growth, and conversely, a value less than zero points to below-trend growth. The index is then measured in standard deviations from trend growth. The recent history of the DEAI (see figure 1) points to generally above-trend growth in Detroit’s economic activity since the city exited bankruptcy in December 2014. However, its growth in economic activity decelerated some in 2019.
1. The Detroit Economic Activity Index (DEAI)
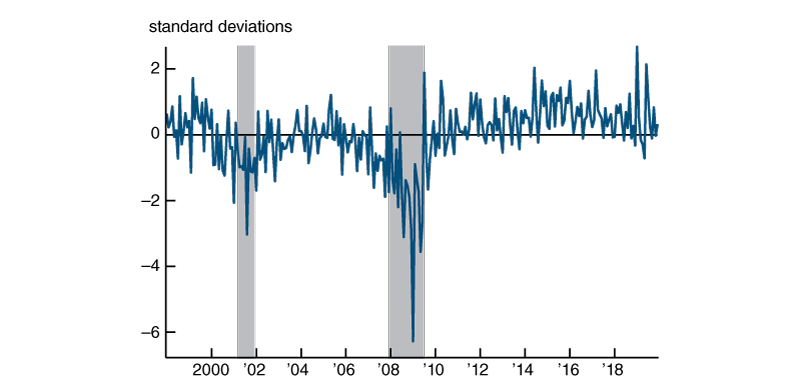
Sources: Authors’ calculations based on data from Haver Analytics, U.S. Census Bureau, Realcomp II Ltd., CoStar, DTE Energy Co., and City of Detroit.
While the index itself is a useful summary measure of economic growth, perhaps its greatest strength is its ability to generate projections of annual real gross city product (GCP) and real per capita income (PCI)—two of the broadest measures of the city’s economic health.3 Growth in Detroit’s real GCP is projected to have been 2.4% in 2019, down from a recent peak of 4.2% in 2015. For comparison, real gross domestic product (GDP) growth for the U.S. was 2.3% in 2019. Despite exceeding the national growth rate, the city still has a lot of ground to make up after a challenging start to the twenty-first century. By our estimates, Detroit real GCP in 2019 was only about 9% higher than in 1997 (see figure 2), whereas U.S. real GDP in 2019 was nearly 66% higher than in 1997.4
2. Detroit real gross city product (GCP)
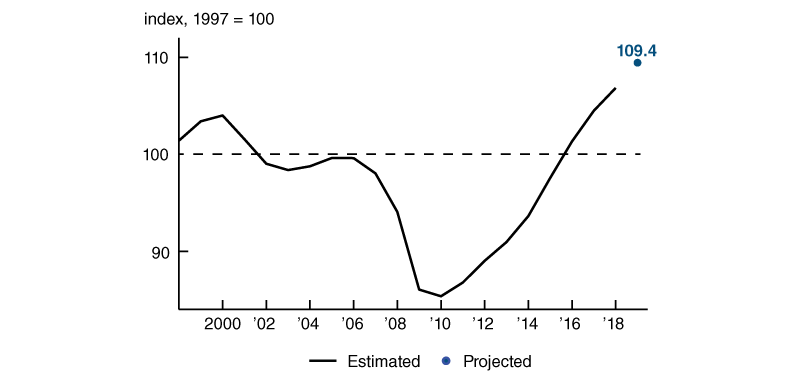
Sources: Authors’ calculations based on data from Haver Analytics, U.S. Census Bureau, Realcomp II Ltd., CoStar, DTE Energy Co., and City of Detroit.
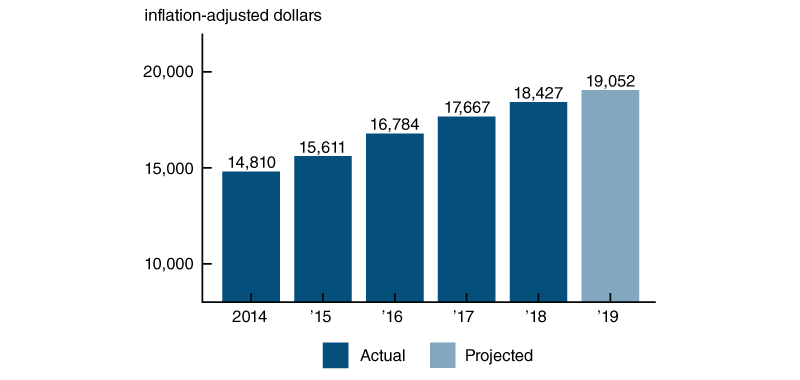
Overall, the latest DEAI results suggest that Detroit was approaching a new normal for economic growth in 2019, following several years recovering from a precipitous decline. This new normal, while slower than the growth of the recent past, was a welcome development. Nowhere is this clearer than in the real PCI data for Detroit. Our latest projection, shown in figure 3, points to continued growth in real incomes for the city (up 3.3% in 2019). If accurate, this would mark the seventh consecutive year of growth in real incomes for Detroit—and an increase of 36.5% since 2012.5
3. Detroit real per capita income
Transitioning to a new normal in 2019
The transition over the past few years to a somewhat slower rate of growth for Detroit is closely connected to developments for the automotive industry. While there has been a concerted effort to diversify Detroit’s economy for many years, the city and the surrounding region still rely significantly on the auto industry for jobs and trade. According to data from the U.S. Bureau of Labor Statistics and U.S. Census Bureau, Michigan’s motor vehicle industry accounts for about 6% of the Detroit metro region’s employment and about 30% of its commodity trade.6 Following the 2007–09 recession, U.S. new light vehicle sales steadily increased from a low of 10.4 million units in 2009 (their lowest level since 1991) to a peak of 17.5 million units in 2016. Since 2016, sales have come down some, averaging around 17.0 million units per year; and projections (made before the Covid-19 outbreak) from the March 2020 Blue Chip Economic Indicators pointed to a further decline to 16.6 and 16.5 million units in 2020 and 2021, respectively.7
As light vehicle sales have slowed, so has growth for Detroit. This can also be seen in the trade data for the city of Detroit used in the DEAI. Total trade activity (exports plus imports) for the port of Detroit grew on a year-over-year basis by over 4% in both 2015 and 2016.8 Following 2016, trade remained relatively flat (as did new light vehicle sales) until early in 2018 when it started to decline, resulting in a 3.3% decline in 2018 compared with 2017. The decline continued through May 2019, with total trade having decreased on a year-over-year basis by an average of 5.5%. Trade then ended 2019 on a positive note, having increased on a year-over-year basis by an average of 4.5% from June through the end of the year.
It is difficult to say whether the decline in trade in 2018 and early 2019 was directly related to the tariffs that were in effect during this time; yet the tariffs levied back then did include those on auto parts, so they likely played some role in the downturn in trade. Other events had a negative impact on Detroit’s recovery in 2019. For instance, shortly after Detroit’s total trade started to recover in June 2019, a contract dispute between General Motors (GM) and the United Auto Workers (UAW) arose. The UAW authorized its members at GM to start a strike on September 15, 2019; the strike lasted for 40 days, ending on October 25, 2019. During this period, light vehicle production fell by 15.5% for the region and 9.2% for the city of Detroit, decreasing the demand for parts from both inside and outside the U.S.9
While changes in trade activity certainly drove some of the movements in the DEAI throughout 2019, the labor category continued to be the DEAI’s largest contributor. The labor data for the city showed signs of continued improvement in 2019, although at a slower pace than in the recent past. Employment growth was only slightly higher in 2019 (1.63%) than in 2015 (1.58%). Yet, the unemployment rate was unchanged in 2019 from 2018; this sharply contrasted with what happened in 2015, when it fell 4.2 percentage points from 2014. That steep drop in unemployment made the labor category’s contribution to the DEAI much higher in 2015 than in 2019. Part of the reason for the steadiness of unemployment in 2019 versus 2015, despite the similar gains in employment, was a substantial increase in the labor force—which was a positive development for the city. We discuss Detroit’s expanding labor force in more detail later on.
Even with the progress Detroit has made, the city still faces many challenges. One of those challenges is the distribution of new wealth that has been generated during its economic recovery. Evidence is mounting that not all of the city is sharing equally in the benefits of its revival. This can be seen, for instance, in the DEAI’s real estate category. According to our calculations using data from Realcomp II Ltd., residential homes in the city have yet to recover most of the value they lost during the 2007–09 recession, with prices still about 36% below their 2003 peak. In contrast, condos (which are mostly located near downtown, where the majority of private investment has occurred in recent years) have increased in price by about 87% since 2003. The median price of condos in Detroit was about $240,000 as of February 2020. In contrast, the median price of single-family homes, most of which are located on the city’s perimeter, was around $42,000.
The development along the Woodward Corridor has exacerbated this bifurcation in residential real estate prices in different parts of the city. This is where a $180 million three-mile stretch of a light rail streetcar system, the QLine, was recently built. The line runs the length of Woodward Avenue from Grand Boulevard to the river, and it has spurred about $7 billion in development, including residential homes and condos, retail stores, restaurants and bars, office space, hotels, and the new Little Caesars Arena—now home to both the Detroit Red Wings hockey team and the Detroit Pistons basketball team.10 While there has been some investment in other neighborhoods bordering the Woodward Corridor, most of the development has occurred in this major residential and business artery leading into the city’s downtown.
Figure 4 is a map of the city showing the location of the Woodward Corridor in relation to other areas of the city. For each district (defined by zip codes), we used DTE Energy Co. data to calculate the percent change in residential utility customers between April 2017 and December 2019 and then the share of total customers across the city in December 2019. As the figure shows, only the Woodward Corridor has experienced an increase in demand for residential utility services over this period, but it represents only slightly more than 10% of the customer accounts for Detroit. The stark difference between the Woodward Corridor and the other districts in this figure highlights the economic difficulties that Detroit still faces.
4. DTE Energy Co. residential utility customers across Detroit, by city district
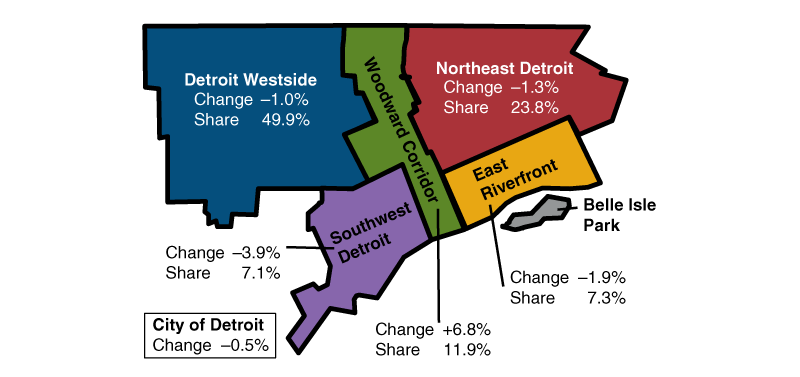
Source: Authors’ calculations based on data from DTE Energy Co.
The volatility in the DEAI in 2019
During the first half of 2019, the DEAI recorded both an all-time high (in January) and one of its lowest readings (in May) since the end of the 2007–09 recession. Panel A of figure 5 shows the source of this volatility. In January, employment for Detroit increased by over 3,500 jobs—the highest one-month increase dating back to 1997. This increase led to a large contribution from the labor category to the index and caused it to spike to a record high. Shortly thereafter, however, the labor category contributions declined, and the DEAI turned negative.
5. Detroit Economic Activity Index (DEAI), by category
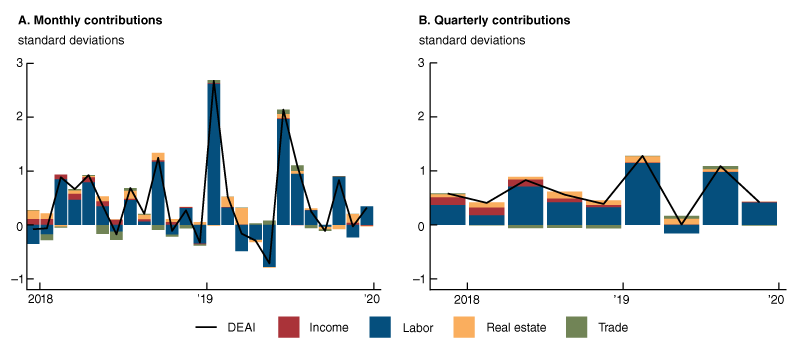
Sources: Authors’ calculations based on data from Haver Analytics, U.S. Census Bureau, Realcomp II Ltd., CoStar, DTE Energy Co., and City of Detroit.
These large swings in the DEAI can often be hard to understand, and sometimes (for reasons that we will explain shortly) are not all that informative for the future direction of growth. To address this issue, we also provide quarterly values of the index—which help to smooth out some of the volatility.11 For instance, instead of growth going from well above to well below trend in a span of just five months, the quarterly values of the index (see panel B of figure 5) indicate that economic activity continued to expand at a rate at or above its long-term trend in the first half of 2019.
On the DEAI’s current data webpage,12 we also provide all 24 individual indicators’ contributions to the index in each month and quarter to help identify the root cause of movements in the index. For example, what happened in the first half of 2019 in the Detroit labor market provides an interesting case of something that seems at first glance to be negative when in fact it is not.
The labor category contains both the labor force participation rate and the unemployment rate. The former captures the share of the population that is either employed or actively seeking work. The latter is the share of the labor force that is not employed but still actively seeking a job. Since the unemployment rate is a function of the labor force (i.e., those employed or actively seeking work), it can increase if the labor force grows faster than the number of employed persons. For example, when people who were previously not looking for a job begin to search for work again, the labor force increases, but so does the number of unemployed if these individuals do not immediately find work.
An increase in the unemployment rate contributes negatively to the DEAI. An increase in the labor force participation rate, however, contributes positively to the DEAI, as it tends to signal an underlying trend of an improving labor market. When both rates increase, their respective contributions to the DEAI potentially offset each other. That said, notably, the unemployment rate data used for the DEAI are monthly, while the labor force participation rate data used for the index are annual and, hence, updated less frequently.13 Thus, this offsetting only happens with a lag. Because of these features of the model, there are times when a monthly increase in the number of unemployed will be unfavorable at first for the DEAI, but it can be positive in the longer run if it is due to an expanding labor force.
The road ahead
As of year-end 2019, it appeared that additional economic progress for Detroit could be more challenging to achieve, given that the low-hanging fruits of the city’s revitalization efforts had likely already been picked. Some evidence of this was starting to be seen in the rising cost of investment projects in the busiest areas of the city. As the city now grapples with the economic impacts of the Covid-19 outbreak, the DEAI remains a useful tool to track its progress. The index is updated four times a year on the first Thursday of March, June, September, and December on the DEAI webpage, accompanied by analysis on the Michigan Economy Blog.
Notes
2 The full list of data series is available online.
3 Data do not exist for Detroit real gross city product. We instead estimate this series by relating the DEAI to real gross metropolitan product (GMP) data for the Detroit–Warren–Dearborn metropolitan statistical area (MSA) from the U.S. Bureau of Economic Analysis. When the GMP data are unavailable, the model projects Detroit GCP using the available data for the DEAI and its historical relationship with GMP for the Detroit–Warren–Dearborn MSA.
4 The U.S. GDP values mentioned in this paragraph are based on data from Haver Analytics. For more on the history of Detroit’s decline, see Veronica Guerrieri, Daniel Hartley, and Erik Hurst, 2012, “Within-city variation in urban decline: The case of Detroit,” American Economic Review, Vol. 102, No. 3, May, pp. 120–126. Crossref
5 The city’s real PCI, derived from the U.S. Census Bureau’s American Community Survey, is released with a substantial lag such that final data for 2019 will not be available until the fall of this year.
6 These statistics are reported for the Detroit–Warren–Dearborn MSA, which includes the city of Detroit.
7 The U.S. new light vehicle sales values through 2019 are based on data from Haver Analytics. Information on Blue Chip Economic Indicators consensus forecasts is available online.
8 These series enter the DEAI separately, but both receive a positive weight in the index that is similar in magnitude. In addition, we adjust them both for inflation with import and export price indexes.
9 Authors’ calculations based on data from WardsAuto InfoBank.
11 The quarterly and annual values we report in the DEAI release are not “simple” averages, but instead “triangle” averages of the monthly values. For growth rate measures like the DEAI, the triangle average best approximates a quarterly or annual growth rate from a monthly growth rate. It gets its name from the tent-like nature of the weights applied to current and past values in the averaging process. A simple average weights current and past values equally, while a triangle average has weights that peak in the recent past and are equally spaced going backward and forward in time from the peak.
13 Monthly labor force data for the city of Detroit are available, but the population data used to scale them to arrive at the labor force participation rate are only available annually.


