

In this article, we explore differences in inflation dynamics across cities (and other areas) within the Midwest. We look independently at the impact of consumption patterns and price changes by expenditure categories, and find that the recent gaps in inflation across midwestern cities have existed largely because of disparities in price changes for housing and transportation, as well as differences in the consumption patterns (as captured by expenditure weights) for transportation and housing.
In a previous Chicago Fed Letter, we investigated the roles of regional expenditure weights and price changes for expenditure categories in explaining the differences in the Consumer Price Index (CPI) inflation rates across the four Census regions of the United States. We now take this analysis one step further by examining the roles of expenditure weights and price changes in explaining differences in inflation rates across cities within a single Census region: the Midwest region, where the entirety of the Chicago Fed’s Seventh District is located.
In our previous article, we found that the majority of differences in CPI inflation across Census regions can be attributed to differences in price changes in housing services. When we examine discrepancies in inflation at a more localized level within the Midwest, we continue to find that differences in housing services inflation play a major role in explaining such discrepancies within the region, but also find a more complex pattern, with differences in transportation inflation and different expenditure weights for transportation and housing services also contributing.
Data
In addition to providing data on inflation by Census region in the form of regional Consumer Price Indexes, the U.S. Bureau of Labor Statistics (BLS) provides inflation data for numerous areas within each of the four Census regions. For the Midwest region, the BLS provides such data for two large areas: the East North Central and West North Central divisions. The East North Central division comprises Illinois, Indiana, Michigan, Ohio, and Wisconsin; and the West North Central division comprises Iowa, Kansas, Minnesota, Missouri, Nebraska, North Dakota, and South Dakota. Furthermore, the BLS provides inflation data for some midwestern cities and groups of cities.1 Data are provided for each city with a population greater than 2.5 million, as well as for all of these large cities combined. These are called “Class A cities.” The four Class A cities in the Midwest are Chicago, Detroit, Minneapolis, and St. Louis. In addition, data are available for midwestern cities with a population of 2.5 million or less each, but only for all of them combined (not individually). These are called “Class B/C cities.”2 Currently, data for the Midwest region, East North Central division, West North Central division, Class A cities (combined), Class B/C cities (combined), and Chicago are published by the BLS every month. A full set of data for St. Louis, Minneapolis, and Detroit are published every other month. Minneapolis data are only available in odd months (January, March, and so on), and Detroit and St. Louis data are only available in even months (February, April, and so on). Figure 1 displays detailed information on inflation data availability for areas within the Midwest since January 2020.
1. Available Consumer Price Index (CPI) data for the Midwest region and areas within it, 2020–23
| Months when CPI data are available | Number of CPI categories (2023) | Published expenditure weights | |
|---|---|---|---|
| United States | All months | 382 | Yes |
| Midwest region | All months | 76 | Yes |
| East North Central division | All months | 60 | No |
| West North Central division | All months | 60 | No |
| Class A cities | All months | 61 | Yes |
| Chicago | All months | 61 | Yes |
| Detroit | Even months | 60 | Yes |
| Minneapolis | Odd months | 61 | Yes |
| St. Louis | Even months | 60 | Yes |
| Class B/C cities | All months | 60 | Yes |
Notes: The U.S. Census Bureau’s geographic definitions of the Midwest region and East North Central and
West North Central divisions are available online.
According to U.S. Bureau of Labor Statistics definitions, Class A cities have a population greater than
2,500,000 and Class B/C cities have a population of 2,500,000 or less. CPI data for a small selection of
categories are available for every month in those places with bimonthly data.
Source: U.S. Bureau of Labor Statistics from Haver Analytics.
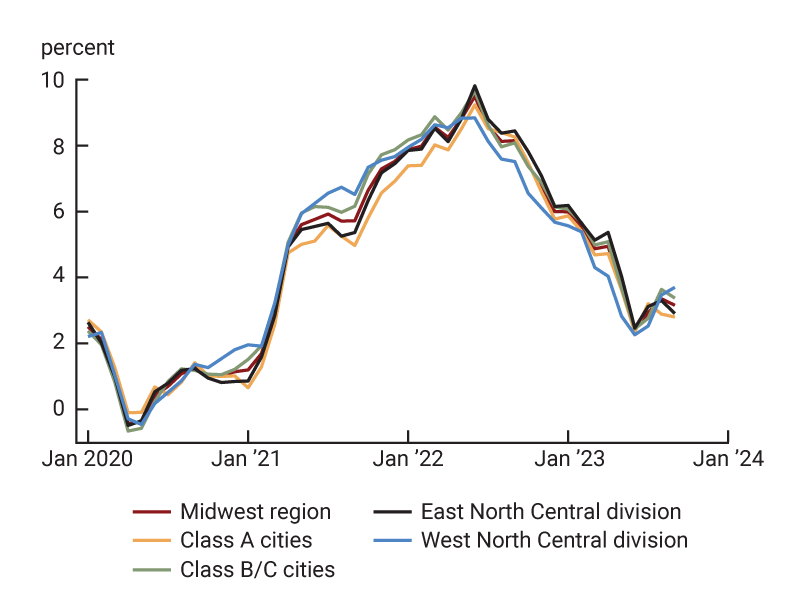
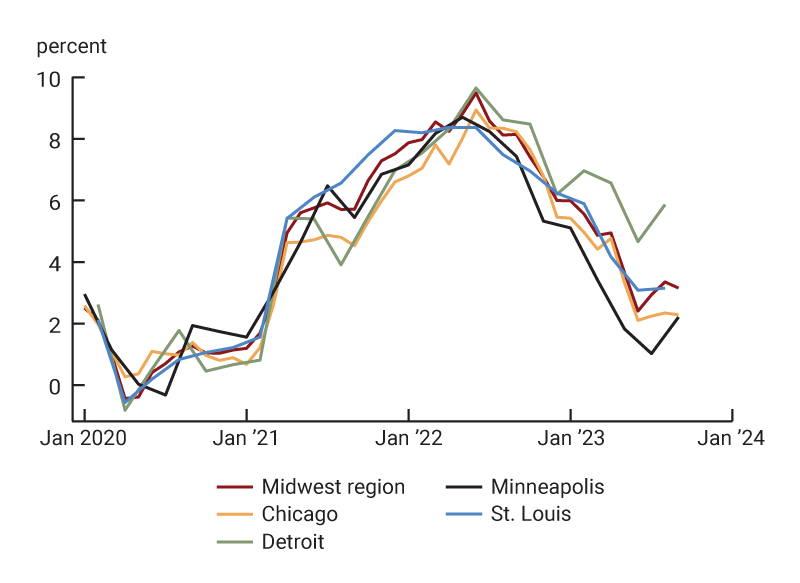
We take a closer look at inflation within the Midwest in figures 2 and 3. Figure 2 shows cumulative inflation from January 2020 through August 2023 for the Midwest region and the areas (Census divisions and Class A and B/C cities) within it according to the official BLS data (first row). Figure 3 graphs year-over-year monthly inflation based on the official BLS data for the Midwest region and the areas within its boundaries. Panel A of figure 3 graphs inflation from January 2020 through September 2023 for the Midwest region, the Class A and B/C city groups, and the East North Central and West North Central divisions; panel B of figure 3 graphs inflation over the same period for the Midwest region and the four midwestern Class A cities individually.3
2. Cumulative Consumer Price Index (CPI) inflation in areas within the Midwest, using different weights and price changes, January 2020–August 2023
| Midwest region | East North Central division | West North Central division | Class A cities | Class B/C cities | Difference between Class A and B/C cities | Chicago | Detroit | Minneapolis | St. Louis | Maximum gap between Class A cities | Percentage change in maximum gap | |
|---|---|---|---|---|---|---|---|---|---|---|---|---|
| Official BLS data | 19.0 | 18.5 | 19.9 | 17.7 | 19.7 | 2.0 | 16.2 | 20.8 | 16.6 | 19.4 | 4.5 | |
| Using area weights and area price changes | 18.9 | n.a. | n.a. | 17.8 | 19.6 | 1.9 | 16.3 | 20.6 | 16.8 | 19.3 | 4.3 | |
| Using Midwest weights and area price changes | 18.9 | 18.4 | 20.0 | 17.7 | 19.6 | 1.9 | 16.5 | 20.5 | 17.3 | 19.0 | 4.0 | –6 |
| Using area weights and Midwest price changes | 18.9 | n.a. | n.a. | 18.9 | 18.9 | 0.0 | 18.8 | 19.6 | 18.2 | 19.0 | 1.3 | –69 |
Notes: All values are in percent. The U.S. Census Bureau’s geographic definitions of the Midwest region
and East North Central and West North Central divisions are available online.
According to U.S. Bureau of Labor Statistics (BLS) definitions, Class A cities (Chicago, Detroit,
Minneapolis, and St. Louis in the Midwest) have a population greater than 2,500,000 and Class B/C cities
have a population of 2,500,000 or less. For this figure, outside of the first row of data (which
reflects official BLS data, with expenditure weights that are updated every month), we perform our own
calculations using data on annual expenditure weights and price changes from the BLS; see note 6 for
further details. For all rows, we interpolate missing data to provide estimates of inflation for
odd-month-reporting cities in even months and vice versa. Because of the data needed for this
imputation, we present the data through the month (August 2023) prior to the month of the most recent
CPI data release (September 2023). See note 5 for more details on the interpolation of missing data. The
BLS does not produce expenditure weights for the East North Central and West North Central divisions.
Note that n.a. indicates not available. The differences in cumulative inflation rates between Class A
and B/C city groups may not equal the differences reported in the sixth column of data because of
rounding; similarly, the differences between the highest and lowest cumulative inflation rates for
individual Class A cities may not equal the maximum gaps reported in the penultimate column. The
second-to-last value (last value) in the final column is the percentage change between the third row’s
(fourth row’s) maximum gap in cumulative inflation rates between Class A cities and the second row’s
maximum gap.
Source: Authors’ calculations based on data from the U.S. Bureau of Labor Statistics from Haver
Analytics.
3. Annual Consumer Price Index inflation in the Midwest, January 2020–September 2023
A. Class A and B/C city groups and Census divisions
B. Individual Class A cities
Source: Authors’ calculations based on data from the U.S. Bureau of Labor Statistics from Haver Analytics.
There are a couple of noticeable patterns within the panels of figure 3. First, the lines track one another reasonably closely—in other words, inflation is highly correlated across the Midwest region, its divisions, and its cities. Second, the inflation data for cities are choppier, probably because of the lower numbers of observations used for generating the inflation measures and less frequent sampling. Third, after mid-2021, a few gaps between the annual inflation rates emerged. From mid-2021 through mid-2022, West North Central inflation was higher than East North Central inflation; and over the same span, Class B/C cities had higher inflation than Class A cities (figure 3, panel A). Among the region’s Class A cities, St. Louis generally had higher inflation than the Midwest during this period, whereas Chicago, Detroit, and Minneapolis generally had lower inflation (figure 3, panel B). Since mid-2022, West North Central inflation has generally been lower than Midwest inflation (figure 3, panel A). Among the Midwest’s Class A cities, Detroit’s inflation has been comparatively higher than the other cities’ (as well as the overall region’s) since mid-2022, while Minneapolis’s inflation has been comparatively lower (figure 3, panel B).
We see similar patterns if we look closely at the first row of figure 2. In particular, we see that there has been some divergence in cumulative inflation across different areas within the Midwest. Since January 2020, Class B/C cities collectively have had higher inflation than the Midwest. In contrast, Class A cities as a whole have had lower inflation than the region. Among the four Class A cities, Chicago has had the lowest cumulative inflation, followed by Minneapolis, then St. Louis, and finally Detroit (with the highest).
However, there is substantial commonality in inflation across the areas within the Midwest. In particular, if we look at correlations across the areas over the January 2020–September 2023 period (not shown), we find that the lowest correlation is between Detroit and the West North Central division, but it’s still nearly 0.90.4
Expenditure patterns versus price changes
Inflation in an area, as measured by the CPI, is the weighted average of price changes for categories of expenditure in the area, with the weights depending on area expenditure patterns. In order to better understand the sources of disparities in inflation across areas within the Midwest, we would like to be able to separately investigate the contributions of category expenditure weights and price changes by category as we did for the four U.S. Census regions in our previous Chicago Fed Letter. To do this, we will need a full panel of data on area price changes by expenditure category. To create this full panel, we estimate the unavailable months of data for those places where data are not available from the BLS for some months (e.g., Detroit) by linearly interpolating the level of the CPI and then calculating annual price changes based on the imputed level; we do this for the overall CPI as well as for the price indexes for each of the eight major categories of expenditure.5 While imperfect, this allows us to compare inflation across areas within the Midwest over identical time horizons and gives us the entire suite of data required for our calculations.
We use these data on price changes enhanced by our imputations, along with information on expenditure weights, to “re-create” area inflation for cities within the Midwest. We do this so that our future calculations investigating the separate contributions of expenditure weights and price changes are consistent with our data on area inflation. We cannot do this for the East North Central and West North Central divisions as there are no published expenditure weights (see figure 1). Area inflation values generated in this way are close but not identical to the official inflation numbers published by the BLS. Across the areas we cover in this article, the monthly correlations for annual inflation between the official and re-created inflation values from January 2020 through August 2023 range from 0.997 to above 0.999.6 The second row of figure 2 shows cumulative inflation calculated using our re-created area inflation data. These levels and patterns across areas are similar to those in the first row, but not identical. Graphs (not shown) with our re-created area inflation data look very similar to those generated with the official BLS data (figure 3).
As was the case with our previous Chicago Fed Letter, we are interested in separately investigating the importance of differences in expenditure patterns (as captured by the category weights) versus differences in category price changes in explaining the disparities in CPI inflation across various areas of a larger geographic unit. To do this, we first investigate differences across the weights by area and differences in category price changes by area. Subsequently, we perform a series of counterfactual exercises, where we hold either the category weights or price changes constant at Midwest regional levels for various areas to find out what’s driving the heterogeneity of inflation across these areas.
Figure 4 shows expenditure weights of the eight main CPI expenditure categories for the nation, the Midwest, and cities within the Midwest in 2022.7 As noted in our previous article, housing’s weight for the Midwest is lower than its weight for the nation, while transportation’s weight for the region is higher than its weight for the country; this is also true for the Midwest’s Class B/C cities compared with the entire nation. There are pronounced differences between the Class A and B/C cities, as shown in figure 4. Class A cities have higher weights on housing than Class B/C cities; in particular, Chicago’s weight for housing—which is in line with the nation’s weight for this category—is much higher than Class B/C cities’ weight for housing. In addition, all four Class A cities, collectively and individually, have transportation weights below those for the Midwest region and the nation. The transportation weight for Chicago is particularly low, which is not surprising given that Chicago has the most advanced public transit infrastructure in the region. In contrast, Class B/C cities collectively have a higher transportation weight than the region and the country.
4. Expenditure weights, by category, for the Midwest and its cities, 2022
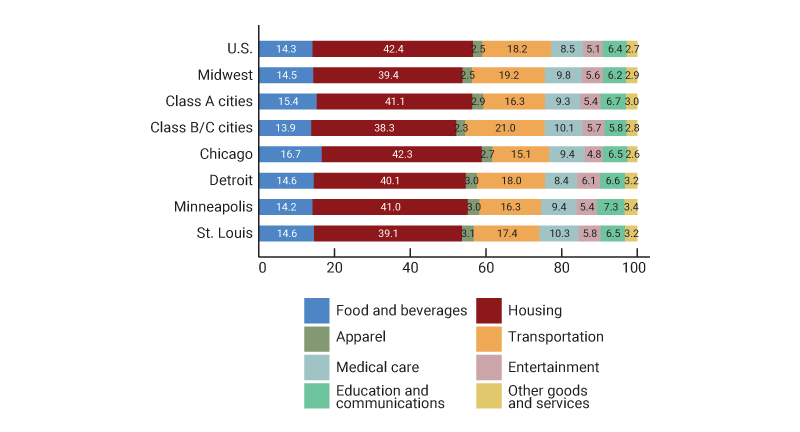
Source: U.S. Bureau of Labor Statistics from Haver Analytics.
Figure 5 shows cumulative CPI inflation by major expenditure category for areas within the Midwest from January 2020 through August 2023, as well as the maximum gap in inflation across the Class A cities. There are some large maximum gaps for the apparel and entertainment categories. The maximum gap between Class A cities for housing services is the fifth largest for all such gaps for the eight categories. This result is in contrast with the maximum gap in inflation for housing services across the four regions of the United States, which was shown in our previous article to be quite large and is the largest gap across U.S. regions in the January 2020–August 2023 period (see figure A2 in the appendix).
5. Cumulative Consumer Price Index price changes, by area and expenditure category, January 2020–August 2023
| Midwest region | East North Central division | West North Central division | Class A cities | Class B/C cities | Chicago | Detroit | Minneapolis | St. Louis | Maximum gap between Class A cities | |
|---|---|---|---|---|---|---|---|---|---|---|
| Total | 19.0 | 18.5 | 19.9 | 17.7 | 19.7 | 16.2 | 20.8 | 16.6 | 19.4 | 4.5 |
| Food and beverages | 24.5 | 24.7 | 24.0 | 23.8 | 24.9 | 24.2 | 23.7 | 24.0 | 23.3 | 0.9 |
| Housing | 19.0 | 18.7 | 19.5 | 18.1 | 19.5 | 16.2 | 23.9 | 16.2 | 19.9 | 7.8 |
| Apparel | 6.6 | 3.1 | 13.5 | 5.8 | 7.0 | 1.4 | –2.5 | 13.9 | 11.8 | 16.3 |
| Transportation | 32.9 | 32.2 | 34.8 | 30.8 | 34.2 | 31.0 | 31.3 | 29.2 | 31.8 | 2.6 |
| Medical care | 8.0 | 5.2 | 14.5 | 5.3 | 9.4 | 2.9 | 4.1 | 9.4 | 7.3 | 6.5 |
| Entertainment | 12.7 | 13.9 | 10.2 | 10.0 | 13.9 | 13.4 | 11.7 | 2.4 | 11.7 | 11.1 |
| Education and communications | 2.9 | 2.8 | 2.8 | 3.1 | 2.7 | –1.2 | 8.6 | 4.2 | 4.8 | 9.9 |
| Other goods and services | 17.9 | 18.2 | 17.1 | 17.4 | 18.3 | 14.3 | 18.7 | 23.7 | 16.6 | 9.3 |
Notes: All values are in percent. The U.S. Census Bureau’s geographic definitions of the Midwest region
and East North Central and West North Central divisions are available online.
According to U.S. Bureau of Labor Statistics (BLS) definitions, Class A cities (Chicago, Detroit,
Minneapolis, and St. Louis in the Midwest) have a population greater than 2,500,000 and Class B/C cities
have a population of 2,500,000 or less. For this figure, we use official BLS data for the Midwest
region, East North Central division, West North Central division, Class A cities, Class B/C cities, and
Chicago, with expenditure weights that are updated every month, and these data enhanced by
interpolations for unavailable data for Detroit, Minneapolis, and St. Louis; see the text and notes 5
and 6 for further details. The maximum gaps between Class A cities may not equal the differences between
the highest and lowest Class A city cumulative inflation rates for the expenditure categories because of
rounding.
Source: Authors’ calculations based on data from the U.S. Bureau of Labor Statistics from Haver
Analytics.
From figures 4 and 5, we see that there are meaningful differences across areas in expenditure patterns and substantial differences in cumulative inflation rates across some expenditure categories, indicating that these categories’ weights and price changes may influence inflation gaps across areas within the Midwest.
Counterfactual exercises
Next, we do two sets of counterfactual calculations to determine whether differences in inflation rates primarily stem from different expenditure weights or different price changes across the categories. In particular, we first fix expenditure weights at Midwest regional levels and vary price changes in line with the data for each of the areas within the Midwest (specifically, city groups and individual cities). When we fix weights, we are observing the impact of price changes. Next, we fix price changes at Midwest regional levels and vary expenditure weights in line with the data for each of the areas within the Midwest. When we fix price changes, we are observing the impact of weights.8 The results of these calculations are in figure 2’s third row of data for the counterfactual exercise using fixed Midwest expenditure weights and in its fourth row for the counterfactual exercise using fixed Midwest price changes.
If we compare the results in the second and third rows of figure 2, we find that using fixed Midwest regional weights modestly narrows the maximum inflation gap across the biggest midwestern cities. As shown in figure 2’s third row, final column, the maximum gap between individual Class A cities falls by 6%. If we graph these data, we get pictures (not shown) that are similar to the panels of figure 3. Combined, the data suggest that differences in expenditure weights are a factor, but not the key factor driving inflation heterogeneity across the Midwest; we still have quite large differences in inflation when we use identical weights.
Next, we analyze inflation by using fixed Midwest regional price changes and varying area weights. We display the results of this counterfactual exercise in panels A and B of figure 6 and the fourth row of figure 2. Here the patterns look quite different from those in panels A and B of figure 3. Using identical Midwest price changes substantially narrows the maximum gap in inflation across areas but does not fully eliminate it. For example, the largest cumulative inflation gap between individual Class A cities is 69% lower (as noted in figure 2’s fourth row, final column) than when we used the actual weights and price change data for each area (the results of which are reported in figure 2’s second row). This percentage difference suggests that different price changes by category are a major source of inflation differentials across the largest cities of the Midwest because shutting down this channel substantially reduces the gaps.
6. Annual Consumer Price Index inflation using Midwest city weights and Midwest regional price changes, January 2020–August 2023
A. Class A and B/C city groups
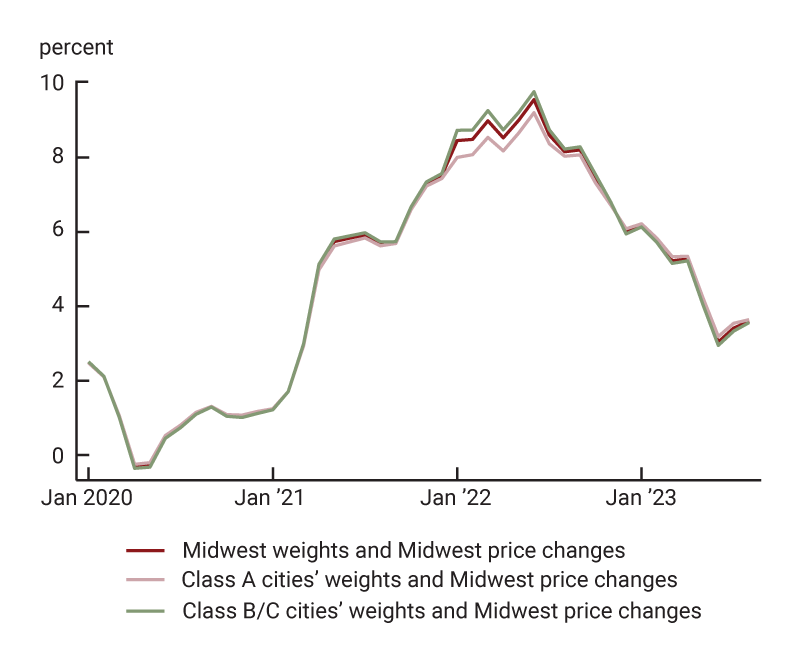
B. Individual Class A cities
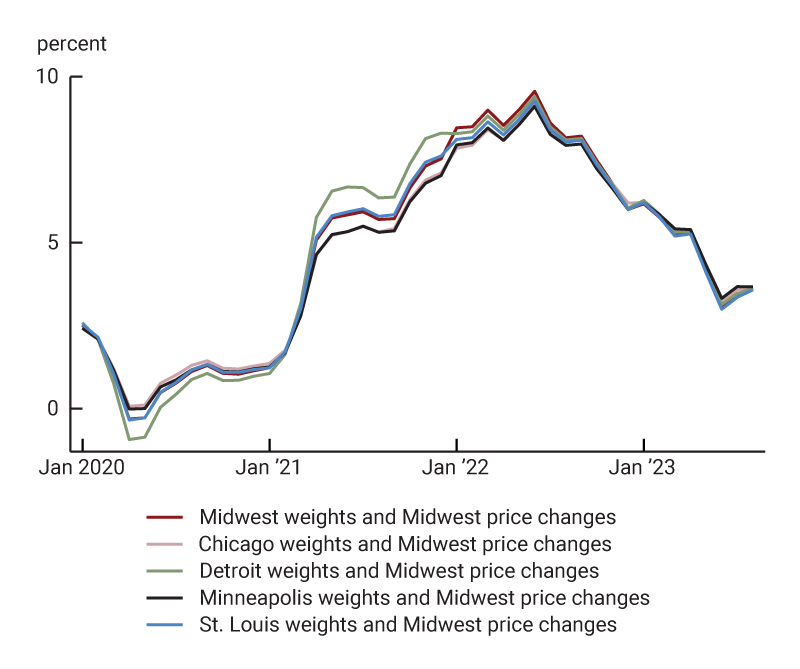
Source: Authors’ calculations based on data from the U.S. Bureau of Labor Statistics from Haver Analytics.
The remaining gaps in both panels of figure 6 (after using identical Midwest price changes) merit further exploration. We note two particularly interesting patterns across the areas within the Midwest. First, we see that throughout most of 2022, inflation rates using Class B/C city weights and Midwest regional price changes by category are higher than Midwest inflation, while inflation rates using Class A city weights and Midwest regional price changes by category are lower (figure 6, panel A). What could cause this? When using the same price increases by category and different weights, inflation is higher in an area if categories with high expenditure weights in that area have higher inflation or if categories with low weights have lower inflation. With this mind, we dig into the data from the 2020–23 period. We find that two factors drive these gaps. First and foremost, transportation inflation far exceeded total inflation in the Midwest (and elsewhere) during most of 2022 (see figure 7). In 2022, Class A cities had a lower weight, while Class B/C cities had a higher weight, on the transportation category than the Midwest as a whole did (see figure 4). Second, in the Midwest, housing services inflation was below total inflation throughout most of 2022 (see figure 7) and Class A cities had a higher weight, while Class B/C cities had a lower weight, on the housing category than the entire region did (see figure 4).
7. Midwest inflation in transportation and housing relative to overall regional inflation
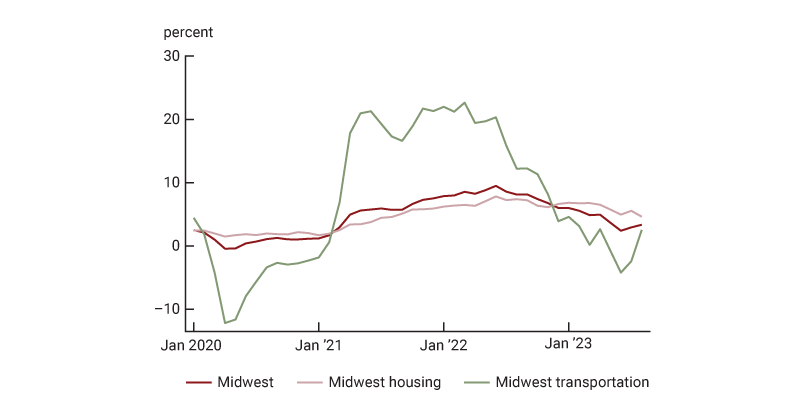
Source: Authors’ calculations based on data from the U.S. Bureau of Labor Statistics from Haver Analytics.
We observe in panel B of figure 6 that in 2021, the counterfactual inflation line for Detroit was higher than the actual inflation line for the Midwest, while the counterfactual inflation lines for Minneapolis and Chicago were lower. The higher Detroit counterfactual inflation during this period can largely be attributed to transportation inflation, given that Detroit has a high transportation weight relative to the other Class A cities. For both Chicago and Minneapolis counterfactual inflation, housing drives their respective gaps relative to Midwest inflation; housing services inflation was below total inflation in 2021, and both cities had high housing weights in 2021 (not shown).
Narrowing in by category
We have found that different levels of inflation by expenditure category are driving most of the differences in overall inflation across areas within the Midwest. We can also further dig into the source of inflation differentials by investigating which category price changes are particularly responsible for the inflation gaps across areas. We do this by running a different counterfactual exercise that allows us to look at the contributions of price changes one category at a time (not shown). In other words, we fix everything at the area level (expenditure weights and price changes by category) except we allow the price change for one category to vary at the Midwest regional level instead. When we performed a similar exercise for U.S. regions in our previous article, we found that using national housing services inflation closed a large portion of the gaps across the regions, by about two-thirds, over a comparable time horizon to what we’ve investigated here. For areas within the Midwest, we find a more complex picture. We find that using either Midwest transportation or Midwest housing services inflation narrows the gap between the Class A and B/C cities, but only by about 25% of the small gap. Using Midwest housing services inflation closes the maximum gap the most between the individual Class A cities, by about 70%, primarily because low housing inflation readings in Chicago and Minneapolis are driving so much of the recent gaps between the largest midwestern cities.9
Conclusion
We can conclude that differences in inflation within the Midwest over the 2020–23 period can be attributed to a variety of factors, including different expenditure weights and different price changes for transportation and housing. The differences for the transportation expenditure category across various areas within the Midwest are a particularly notable feature in recent years, given that transportation inflation has been extremely high. As shown in figure 4, certain places in the Midwest, particularly the Class B/C cities, have higher transportation expenditure weights. Although people in less densely populated areas often have shorter commutes, reliance on cars tends to be greater and individuals allocate more of their income to transportation costs in smaller cities or rural areas (as supported by Chakrabarti, Garcia, and Pinkovskiy, 2023). As shown in our previous Chicago Fed Letter, disparities in inflation across U.S. regions can be almost exclusively attributed to differences in price changes for housing services; however, across areas within the Midwest, housing is not the only main driver of inflation differentials. Most notably, differences in transportation expenditure patterns (as captured by the category’s expenditure weights) and transportation price changes also play significant roles.
Notes
1 More precisely, the BLS provides inflation data for core-based statistical areas (CBSAs), as defined by the Office of Management and Budget and used by the BLS for CPI purposes, as explained in the CPI’s 2018 geographic revision notice. However, we will use city rather than CBSA throughout this article. For instance, we refer to the CBSA of Chicago–Naperville–Elgin, IL–IN–WI as the city of Chicago (or Chicago metro area).
2 To collect the Class B/C city data, the BLS collects data on a sample of cities, which represents the entire group of cities. For the Midwest Census region, the 12 sampled cities are Cincinnati, OH; Cleveland, OH; Columbus, OH; Dayton, OH; Flint, MI; Frankfort, IN; Janesville, WI; Lincoln, NE; Milwaukee, WI; Omaha, NE; Wichita, KS; and Wahpeton, ND. Data for each of these cities are not published individually. See Steven P. Paben, William H. Johnson, and John F. Schilp, 2016, “The 2018 revision of the Consumer Price Index geographic sample,” Monthly Labor Review, U.S. Bureau of Labor Statistics, October. Crossref
3 In our previous Chicago Fed Letter, we investigated two time periods January 2002–January 2023 and January 2019– January 2023. In this Chicago Fed Letter, we only focus on the period January 2020–August 2023 as this recent period is more interesting because of high inflation volatility. For the appendix, we repeat the calculations in figure 2 for the period January 2002–August 2023 and present them in figure A1.
4 We cannot correlate Minneapolis data with Detroit or St. Louis data because Minneapolis is measured by the BLS in different months than Detroit and St. Louis, as we explained previously.
5 See figure 4’s legend for the CPI’s eight major categories of expenditure. There are some cases of additional missing metro area data, even in months when that city is surveyed. We also interpolate these missing data whenever possible. For example, there is one missing month of inflation data for the medical care expenditure category for the Chicago CPI. In addition, medical care data are missing for the Detroit CPI for a stretch of time at the end of the sample, so we cannot impute data for those months and instead assign Detroit the monthly medical care inflation rate of all midwestern Class A cities.
6 The differences here arise from a couple of sources. First, for our calculations, we use fixed expenditure weights for each area of the Midwest and the region overall for each year, while for the official data, the BLS updates the weights every month in response to price changes, increasing the weights for the items where prices increased relatively more. This adjustment is called relative importance. Second, our imputation procedure, particularly for missing medical care expenditure data, is imperfect (see note 5). Figure 2’s first row and figures 3, 5, and 7 are based on official BLS data, with expenditure weights updated every month. The vast majority of figure 2 (aside from the first row) and the entirety of figure 6 are based on our calculations using annual expenditure weights from the BLS.
7 The expenditure weights change over time as new survey data are released and in response to price changes. However, the relative patterns across areas tend to be fairly consistent.
8 These counterfactual exercises are not as clean as this breakdown suggests because the annual expenditure weights partly depend on past price changes and the price changes partly depend on expenditure weights for the items within each expenditure category.
9 Low inflation in Minneapolis, led by low housing services inflation, has generated quite a bit of recent press. See, e.g., this August 2023 Insider story by Sebastian Cahill.


