

Detroit Area Bank Branch Locations
Presence of Banks within 1 Mile of the Center of the Census Tracts in Detroit, 2010
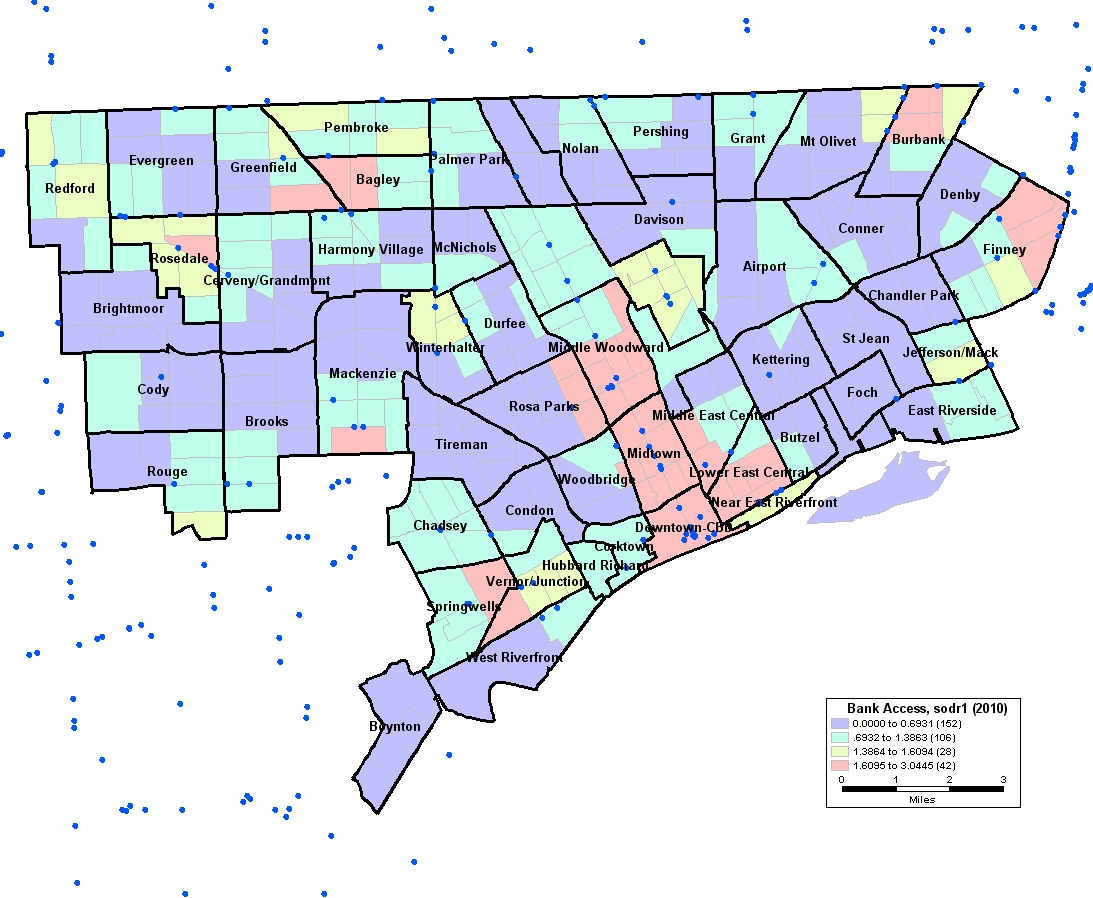 Enlarge Image
k= bank branch
I = census tracts
D = distance of bank branches (at one mile) from centroid of the census tract
Blue = census tracts are in lowest 25 percent of the “Bank Access Measure” distribution for the three counties
Green = census tracts are in second lowest (25 – 50 percentile) of the “Bank Access Measure” distribution for the three counties
Yellow = census tracts are in second highest (50- 75 percentile) of the “Bank Access Measure” distribution for the three counties
Pink = census tracts are in the highest 25 percent of the “Bank Access Measure” distribution for the three counties
Presence of Banks within 5 Miles of the Center of the Census Tracts in Detroit, 2010
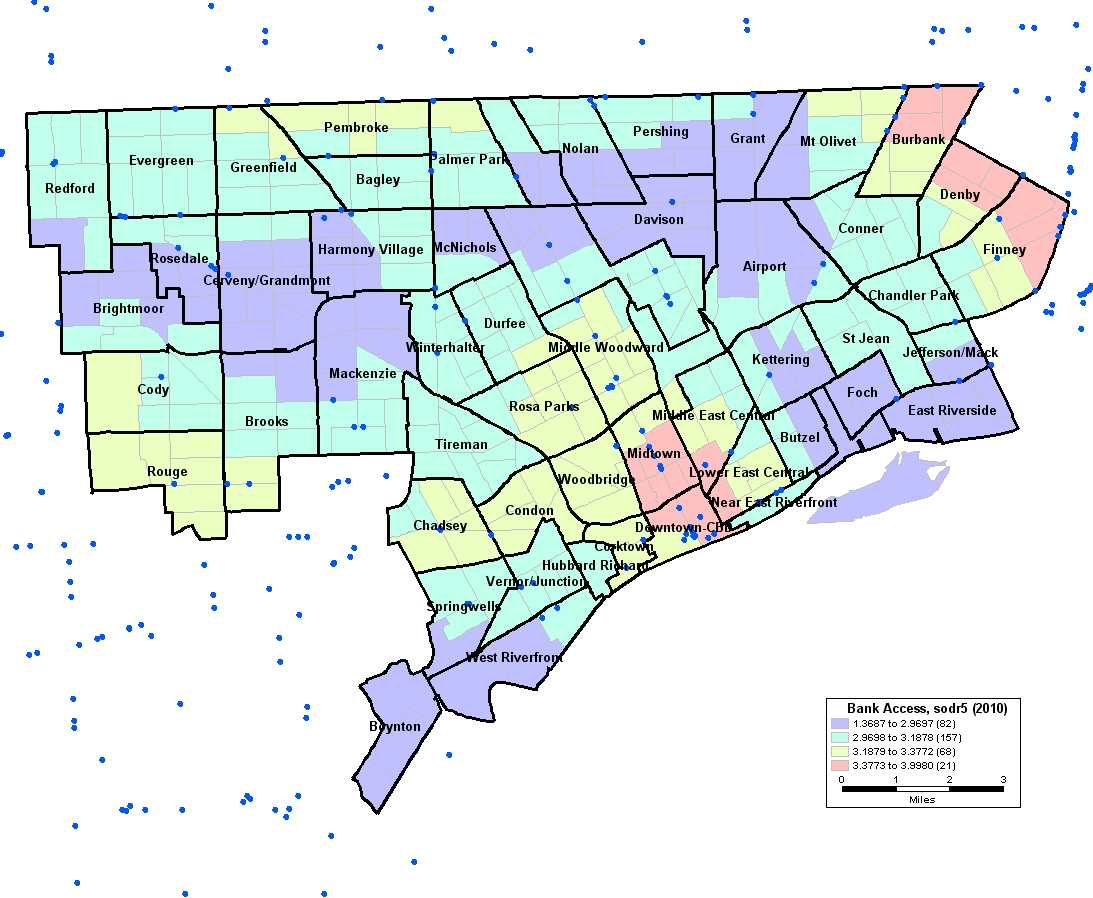 Enlarge Image
k= bank branch
I = census tracts
D = distance of bank branches (at one mile) from centroid of the census tract
Blue = census tracts are in lowest 25 percent of the “Bank Access Measure” distribution for the three counties
Green = census tracts are in second lowest (25 – 50 percentile) of the “Bank Access Measure” distribution for the three counties
Yellow = census tracts are in second highest (50- 75 percentile) of the “Bank Access Measure” distribution for the three counties
Pink = census tracts are in the highest 25 percent of the “Bank Access Measure” distribution for the three counties
Presence of Banks within 5 Miles of the Center of the Census Tracts in Macomb, Oakland and Wayne Counties, 2010
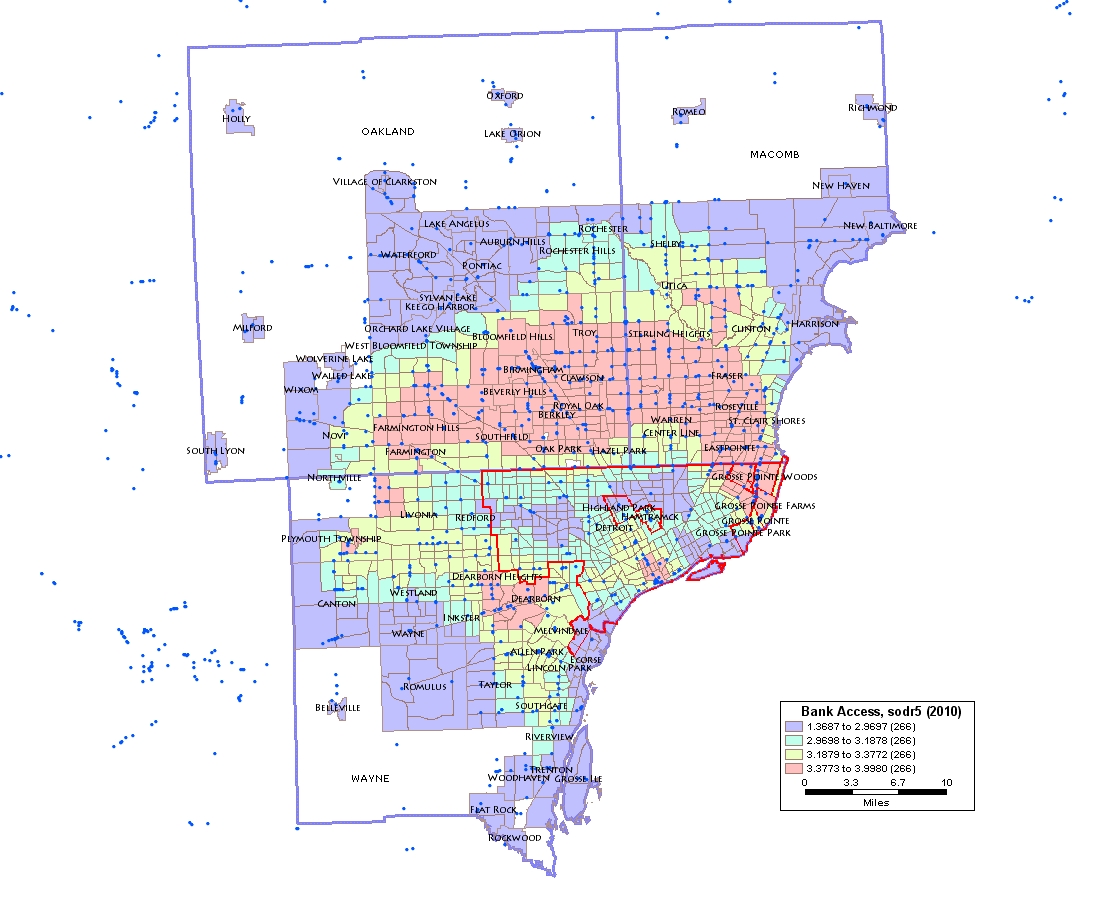 Enlarge Image
k= bank branch
I = census tracts
D = distance of bank branches (at one mile) from centroid of the census tract
Blue = census tracts are in lowest 25 percent of the “Bank Access Measure” distribution for the three counties
Green = census tracts are in second lowest (25 – 50 percentile) of the “Bank Access Measure” distribution for the three counties
Yellow = census tracts are in second highest (50- 75 percentile) of the “Bank Access Measure” distribution for the three counties
Pink = census tracts are in the highest 25 percent of the “Bank Access Measure” distribution for the three counties
Sources for the maps are FDIC Summary of Deposits, Maptitude Version 5, U.S. Census Bureau boundary data, as obtained through Maptitude version 5, The Google Geocoding API, Version 2, and Federal Reserve Bank of Chicago calculations.


