

Summary
Agricultural land values in the Seventh Federal Reserve District suffered a third consecutive annual decrease, yet the 1 percent decrease for 2016 was smaller than the 3 percent declines for the previous two years. “Good” farmland values in the fourth quarter of 2016 were down 1 percent from the third quarter, according to 192 survey respondents from District banks. Nearly 60 percent of the survey respondents expected farmland values to be stable during the January through March period of 2017, while 40 percent expected farmland values to decrease in their local areas.
Farm credit conditions deteriorated further in the fourth quarter of 2016. Lower repayment rates on non-real-estate farm loans in the October through December period of 2016 versus the same period of 2015, combined with higher rates of loan renewals and extensions, suggested a worsening credit climate. Additionally, for 2017, 3 percent of farm loan customers were not expected to qualify for operating credit at the banks of the survey respondents. With non-real-estate loan demand up more than funds available for lending compared to their respective levels of a year ago, the average loan-to-deposit ratio for the District (75.0 percent) was higher than a year ago. Finally, average interest rates on agricultural loans jumped up at the end of 2016 to their highest levels since the end of 2013.
Farmland values
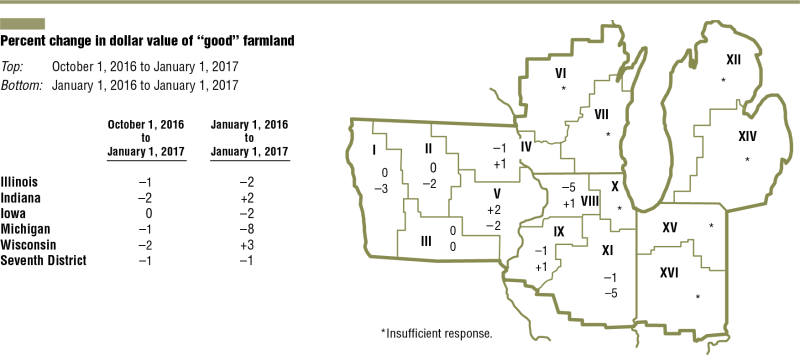
The District experienced an annual decrease of 1 percent in “good” farmland values for 2016, marking the third year in a row of declines. However, this stretch of decreases has been much more moderate than the previous such stretch during the 1980s (see chart 1). Also, the final quarter of 2016 was the tenth straight quarter without the District as a whole seeing a year-over-year increase in agricultural land values. In the fourth quarter of 2016, Illinois, Iowa, and Michigan saw year-over-year decreases in agricultural land values, while Indiana and Wisconsin saw modest increases (see table and map below). The District’s farmland values were down 1 percent in the fourth quarter of 2016 relative to the third quarter.
The District’s decrease in farmland values for 2016 was 2 percent after adjusting for inflation. In real terms, the decrease in the District’s agricultural land values from their peak in 2013 through the end of 2016 was 9.5 percent (see chart 2). Since their 2013 peaks, Illinois, Indiana, and Michigan farmland values have experienced real declines of 11 percent, 7 percent, and 12 percent, respectively. Additionally, since their 2012 peak, Iowa farmland values have experienced a real decline of 15 percent. In contrast, Wisconsin agricultural land values have risen 4 percent in real terms since 2013. (Changes in farmland values are based on index values adjusted for inflation.) Even after three annual declines, the index of inflation-adjusted farmland values for the District was nearly 60 percent higher in 2016 than its previous peak in 1979.
1. Annual percentage change in Seventh District farmland values

Softening the slide in farmland values, record harvests of corn and soybeans for District states were produced in 2016. According to U.S. Department of Agriculture (USDA) data, 2016 output in the five District states increased 11 percent for corn and 8.7 percent for soybeans from 2015 levels. The District states’ corn yield jumped 9.0 percent in 2016 from 2015—to a record 192 bushels per acre. Additionally, the District states’ soybean yield climbed 7.8 percent in 2016 from 2015—to a record 58.3 bushels per acre. In 2016, Iowa and Wisconsin set records for corn yields, and all five states set records for soybean yields.
Similarly, according to the USDA, national corn production for 2016 established a new record of 15.1 billion bushels—up 11 percent from 2015. U.S. soybean output for 2016 set a record of 4.3 billion bushels—up 9.7 percent from the previous year. Even though plentiful supplies of corn and soybeans exerted downward pressures on corn and soybean prices in 2016, reinvigorated demand for these crops (particularly for export) helped allay fears of even lower crop prices. In fact, according to USDA data on trade volumes, soybean exports in 2016 also set an all-time high. Soybean prices in December 2016 were, on average, 10 percent higher than a year ago, yet were 6 percent lower than two years ago (see table at the end). In December 2016, corn prices were, on average, 9 percent lower than a year ago and 12 percent lower than two years ago. Total usage of corn at 14.6 billion bushels in the 2016–17 crop year would result in U.S. ending stocks of 2.36 billion bushels. At 16 percent, the stocks-to-use ratio for corn would be the highest since the 2004–05 crop year. Total soybean usage of 4.11 billion bushels in the 2016–17 crop year would result in ending stocks of 420 million bushels for the U.S. At 10 percent, the stocks-to-use ratio for soybeans would be the highest since the 2006–07 crop year.
2. Indexes of Seventh District farmland values

Livestock prices dropped in 2016 relative to the previous year, but not by as much as in 2015. The index of prices for livestock and associated products (featured in the table at the end) in December 2016 was down 3 percent from a year ago and 26 percent from two years ago. While the average price of cattle continued to move lower in 2016 (down 8 percent in December 2016 from a year earlier), December milk and hog prices were up 9 percent and 1 percent from a year ago. Indeed, not all farm prices moved down in 2016, so there was at least some relief from the bleak circumstances for farm income observed at the end of 2015. Acknowledging the boost from bumper harvests, a responding banker commented that “2016 looks to be a break-even year (give or take) for most area farmers.” Without a major hit to the returns of most farms in the District, the downturn in agricultural land values didn’t gain momentum in 2016 but sustained itself for another year.
Credit conditions
Agricultural credit conditions stumbled again in the fourth quarter of 2016. The index of non-real-estate farm loan repayment rates had not been higher since the fourth quarter of 2014, yet repayment rates, on the whole, were once again lower than the same period of the previous year. With 4 percent of survey respondents reporting higher rates of loan repayment and 39 percent reporting lower rates, the index of repayment rates was 65 in the final quarter of 2016. Non-real-estate farm loan renewals and extensions in the fourth quarter of 2016 were higher than in the fourth quarter of 2015, as 39 percent of respondents reported increases in them while only 3 percent reported decreases. Moreover, the volume of the farm loan portfolio deemed to have “major” or “severe” repayment problems grew to 5.9 percent in the fourth quarter of 2016, matching the share in 2002 and the highest such proportion in 15 years.
Credit standards tightened compared with a year ago, as 40 percent of the survey respondents reported their banks had tighter credit standards for agricultural loans in the fourth quarter of 2016 relative to the fourth quarter of 2015 and 60 percent reported no change. In addition, 24 percent of responding bankers noted that their banks required larger amounts of collateral for customers to qualify for non-real-estate farm loans during the October through December period of 2016 relative to the same period of a year ago, and only 1 percent required smaller amounts. Another notable development was an upward shift in agricultural interest rates. As of January 1, 2017, the average interest rates for farm operating loans (5.03 percent), feeder cattle loans (5.10 percent), and agricultural real estate loans (4.71 percent) were all at their highest levels since the end of 2013.

During the October through December period of 2016 there was more interest among agricultural producers in taking out non-real-estate loans than during the same period of 2015. With 34 percent of survey respondents seeing an increase in the demand for non-real-estate loans and 20 percent seeing a decrease, the index of loan demand stood at 114 in the fourth quarter of 2016. Funds availability during the fourth quarter of 2016 was also above the level of a year ago, as it had been in the final quarter of every year since 2000. The index of funds availability was up a bit at 105, with funds availability higher at 12 percent of the survey respondents’ banks and lower at 7 percent. The District’s average loan-to-deposit ratio was higher than a year ago, at 75.0 percent—5.8 percentage points below the average level desired by the responding bankers.
Looking forward
Survey respondents indicated 3 percent of their farm customers with operating credit in 2016 were not likely to qualify for new operating credit in 2017 (up a full percentage point from their year-ago projections for 2016). Responding bankers anticipated non-real-estate agricultural loan volumes (primarily operating loans and loans guaranteed by the USDA’s Farm Service Agency) to be higher during the first quarter of 2017 relative to the same quarter of a year earlier. Volumes for grain storage loans, farm machinery loans, feeder cattle loans, and farm real estate loans were forecasted to be lower in the January through March period of 2017 relative to the same period of 2016.
At the end of 2016, survey respondents still expected capital spending by farmers to be lower in the year ahead compared with the year just ending. The outlook for capital spending on land or improvements, buildings and facilities, machinery and equipment, and trucks and autos hasn’t been positive since the end of 2012. Also, 40 percent of the responding bankers envisaged agricultural land values to decline in the first quarter of 2016, while almost 60 percent envisaged them to be steady. According to a survey respondent, “2016 ended much better than expected,” assisted by strong crop yields and some increases in product prices from a year ago. Yet, survey respondents forecasted the downward trends for farmland values and agricultural credit conditions to continue into 2017.


