

Summary
Agricultural land values for the Seventh Federal Reserve District as a whole remained stable in the first quarter of 2019, with average farmland values unchanged from a year earlier. There was a 1 percent increase in “good” farmland values from the fourth quarter of 2018 to the first quarter of 2019, according to the survey responses of 168 District agricultural bankers. The amount of farmland for sale in the three- to six-month period ending with March 2019 was slightly higher than in the same period ending with March 2018, even as the demand to purchase agricultural land was a bit lower. Also, the number of farms sold and the amount of acreage sold were roughly the same during the winter and early spring of 2019 compared with a year ago. Almost a quarter of the responding bankers expected District farmland values to decrease during the second quarter of 2019, while three-fourths of them expected agricultural land values to be steady. Moreover, cash rental rates for District farmland eased for the sixth consecutive year in 2019.
District agricultural credit conditions deteriorated once again during the first quarter of 2019. Repayment rates for non-real-estate farm loans were lower than a year ago, and renewals and extensions of these loans were higher. In addition, demand for non-real-estate loans in the first quarter of 2019 was up from a year ago. While the amount of collateral required was higher than a year earlier, the availability of funds to lend was lower. At 78.6 percent, the average loan-to-deposit ratio in the first quarter of 2019 increased from a year ago, yet decreased from the previous quarter. Although average nominal interest rates on farm loans declined in the first quarter of 2019 from the previous quarter, real farm interest rates rose as inflation dipped further.
Farmland values
District agricultural land values were the same in the first quarter of 2019 as in the first quarter of 2018, although they did move up 1 percent from the fourth quarter of 2018 (see table and map below). Indiana and Iowa saw year-over-year decreases in farmland values, while Illinois and Wisconsin saw no changes. Somewhat surprisingly, Wisconsin did not have a year-over-year decrease in farmland values, despite being the lone state that experienced a quarterly decline. After being adjusted for inflation with the Personal Consumption Expenditures Price Index (PCEPI), District agricultural land values were down (by 1 percent) on a year-over-year basis for the 19th straight quarter in the first quarter of 2019.

The stability of District farmland values persisted even as the demand for agricultural land softened from a year ago and the supply on the market grew modestly. As an Indiana banker noted, “There are people in rural communities who have really strong balance sheets and are in an offensive position, with the capability of buying land.” That said, there was some downward pressure on farmland markets in the three- to six-month period ending with March 2019 relative to the same period ending with March 2018, given that 7 percent of the survey respondents reported higher demand to purchase farmland and 28 percent reported lower demand. Also, there was an uptick in the amount of agricultural land for sale during the most recent winter and early spring relative to a year ago, as 28 percent of the responding bankers reported more farmland was up for sale in their areas and 22 percent reported less. The number of farms and the amount of acreage sold were roughly the same in the winter and early spring relative to a year earlier. Notwithstanding several comments by responding bankers that investor interest in farmland was robust, survey participants generally indicated that the mix of agricultural acres purchased by farmers and investors was about the same in the three- to six-month period ending with March 2019 as in the corresponding period ending with March 2018.
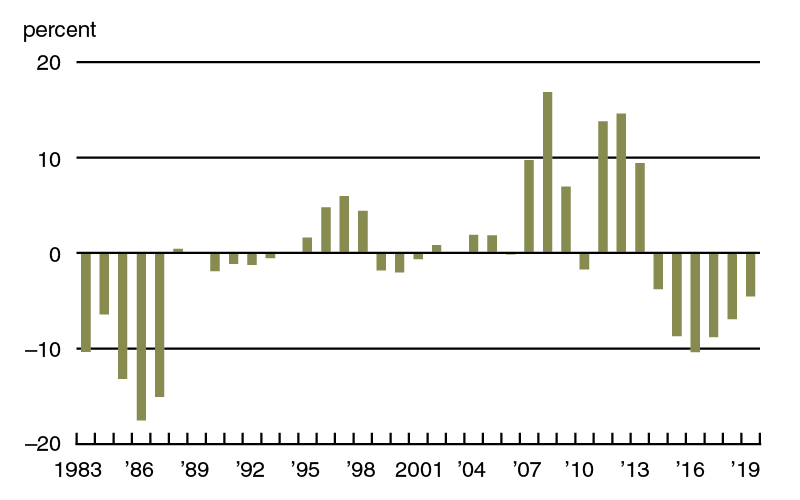
Another indicator of weakening markets for farmland was a 3 percent decrease in cash rental rates for District agricultural ground from 2018 to 2019. For 2019, average annual cash rents to lease farmland were down 2 percent in Illinois, 3 percent in Indiana, 4 percent in Iowa, 2 percent in Michigan, and 4 percent in Wisconsin. After being adjusted for inflation with the PCEPI, District cash rental rates slipped 5 percent from 2018 (see chart 1). This was the sixth straight year of declining real cash rents—the longest such downturn since 1981 (when the survey started to track cash rents).
1. Annual percentage change in Seventh District farmland cash rental rates adjusted by PCEPI
Even though the current streak of decreasing real cash rental rates is the longest one on record in the survey, the District’s index of inflation-adjusted cash rental rates fell by more in percentage terms during the 1980s (see chart 2). The index of real cash rents was reduced by nearly 50 percent from 1982 to 1987. In nominal and real terms, both the index of farmland cash rental rates and the index of agricultural land values peaked in 2013. As of 2019, the index of real cash rents dropped 36 percent below its level in 2013, reaching its lowest level since 2007; the index of real farmland values dropped only 10 percent from its 2013 peak (and was last lower in 2012). As of March 2019, the corresponding six-year dips in real corn and soybean prices were even larger—at 53 percent and 47 percent, respectively—according to calculations using data from the U.S. Department of Agriculture (USDA). With the current earnings potential of farmland (reflected by cash rents and crop prices) declining relatively more than agricultural land values, farmland purchasers seem to desire more strongly either long-term income prospects or other characteristics over the near-term returns of farm ownership.
2. Indexes of Seventh District farmland adjusted by PCEPI
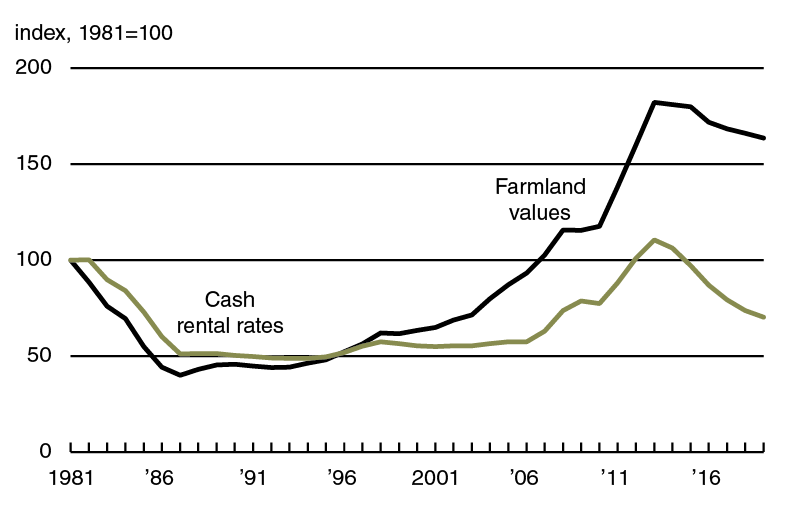
Sources: Author’s calculations based on data from Federal Reserve Bank of Chicago surveys of farmland values; and U.S. Bureau of Economic Analysis, Personal Consumption Expenditures Price Index (PCEPI), from Haver Analytics.
Credit conditions
There was “a continued working capital erosion for our overall customer base,” reported an Iowa banker. This sentiment was representative of the gradual decay in agricultural credit conditions for the District in recent quarters, including the first quarter of 2019. The index of repayment rates for non-real-estate farm loans edged down to 52, with 2 percent of responding bankers observing higher rates of repayment and 50 percent observing lower rates for the first quarter of 2019 relative to the first quarter of 2018. Furthermore, 42 percent of the survey respondents reported higher levels of loan renewals and extensions over the January through March period of 2019 compared with the same period last year, while just 1 percent reported lower levels of them. Credit tightening also continued in the first quarter of 2019; 28 percent of survey respondents noted that their banks required larger amounts of collateral for loans during the January through March period of 2019 relative to the same period of 2018, while none noted that their banks required smaller amounts. Additionally, the share of loans guaranteed by the USDA’s Farm Service Agency (FSA) in the portfolios of the reporting banks rose slightly to 8 percent for the District as a whole (FSA guarantees help some less creditworthy farmers qualify for loans); only Wisconsin’s share (17 percent) was higher than the District’s share—reflective of the difficulties the dairy sector has faced.
The index of demand for non-real-estate farm loans (141) was last higher in the first quarter of 2016, as 49 percent of the responding bankers noted higher loan demand compared with a year ago and 8 percent noted lower demand. At 86, the index of funds availability showed a deterioration in funding levels from a year ago; 8 percent of the survey respondents indicated their banks had more funds available to lend and 22 percent indicated their banks had less. At 78.6 percent, the average loan-to-deposit ratio for the District was higher in the first quarter of 2019 than a year ago, yet a bit lower than in the fourth quarter of 2018; the ratio was 2.8 percentage points below the average level desired by the survey respondents. As of April 1, 2019, the average nominal interest rates on operating loans (6.04 percent), agricultural real estate loans (5.53 percent), and feeder cattle loans (6.11 percent) were all lower than at the end of the fourth quarter of 2018. However, after being adjusted for inflation using the PCEPI, average agricultural interest rates moved up to their highest levels since the fourth quarter of 2015. In real terms, interest rates on farm loans increased for the third consecutive quarter, assisted by lower inflation readings.

b Bankers responded to each item by indicating whether conditions in the current quarter were higher or lower than (or the same as) in the year-earlier quarter. The index numbers are computed by subtracting the percentage of bankers who responded “lower” from the percentage who responded “higher” and adding 100.
Note: Historical data on Seventh District agricultural credit conditions are available for download from the AgLetter webpage.
Looking forward
The vast majority of the survey respondents anticipated agricultural land values to be unchanged in the second quarter of 2019: 75 percent of responding bankers expected farmland values to be stable, 24 percent expected them to decline, and 1 percent expected them to rise. Survey respondents projected that the overall volume of non-real-estate farm loans would increase in the District during the April through June period of 2019 relative to the same period of 2018, with 32 percent of responding bankers predicting higher levels of non-real-estate farm loans and 12 percent predicting lower levels. While survey respondents expected higher volumes for both operating and FSA-guaranteed loans, they expected lower volumes for grain storage, farm machinery, dairy, and feeder cattle loans. The overall volume of farm real estate loans was forecasted to be nearly the same in the second quarter of 2019 as in the second quarter of 2018. With regard to 2018, an Indiana banker commented, “My customers were generally able to meet all their obligations and maintain their financial positions.” But that banker also noted, “This year could get ugly.” Given generally low commodity prices and weather disruptions (including flooding in some areas), 2019 could end up being quite a challenging year for the District’s agricultural producers.
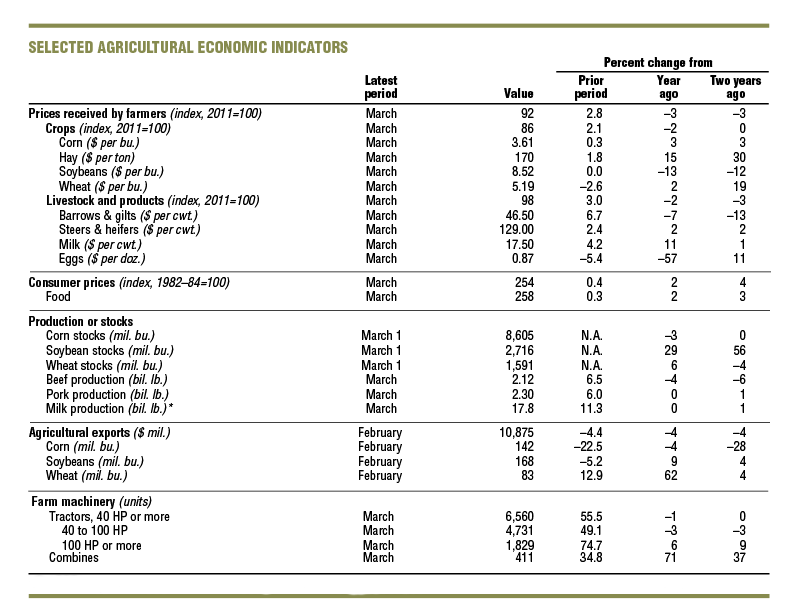
* 23 selected states.
Sources: Author’s calculations based on data from the U.S. Department of Agriculture, U.S. Bureau of Labor Statistics, and the Association of Equipment Manufacturers.
SAVE THE DATE
On November 20, 2019, the Federal Reserve Bank of Chicago will hold a conference on Midwest agriculture and the environment, including conservation practices. Additional information about the event will become available in the coming months on the event page.


