

Summary
Farmland values for the Seventh Federal Reserve District moved up 1 percent in the second quarter of 2020 from a year ago, even as the economy endured a major hit from the Covid-19 pandemic. Values for “good” agricultural land in the District were unchanged from the first quarter to the second quarter of 2020, according to a survey of 150 bankers. Respondents indicated that around 80 percent of their borrowers were at least modestly affected by the pandemic in the first half of 2020. Even so, 79 percent of responding bankers expected District agricultural land values to be stable during the third quarter of 2020.
Given the widespread adverse effects of the pandemic in the second quarter of 2020, unsurprisingly agricultural credit conditions for the District weakened compared with a year earlier. For the second quarter of 2020, repayment rates for non-real-estate farm loans were again lower than in the same quarter of the previous year. The portion of the District’s agricultural loan portfolio reported as having “major” or “severe” repayment problems (8.3 percent) had not been higher in the second quarter of a year since 1988. Moreover, renewals and extensions of non-real-estate farm loans in the District were up from a year ago. For the April through June period of 2020, the demand for non-real-estate farm loans was nearly the same as a year earlier, while the availability of funds for lending by agricultural banks was higher. For the second quarter of 2020, the District’s average loan-to-deposit ratio was 77.6 percent. Average nominal interest rates for feeder cattle, farm real estate, and operating loans ended the second quarter of 2020 at their lowest points in the history of the survey.
Farmland values
All in all, District farmland values were the same in the second quarter of 2020 as in the first quarter. Yet, there was a year-over-year increase of 1 percent in District agricultural land values. Indiana and Wisconsin had year-over-year increases in their farmland values, while Illinois and Iowa farmland values held steady (see map and table below). After being adjusted for inflation with the Personal Consumption Expenditures Price Index (PCEPI), District farmland values were still up slightly in the second quarter of 2020 from the second quarter of 2019, given that inflation slowed. This uptick broke a streak of year-over-year declines in real farmland values that had extended back six years.
Percent change in dollar value of “good” farmland
| April 1, 2020 to July 1, 2020 |
July 1, 2019 to July 1, 2020 |
|
|---|---|---|
| Illinois | +1 | 0 |
| Indiana | –1 | +4 |
| Iowa | –1 | 0 |
| Michigan | * | * |
| Wisconsin | +3 | +1 |
| Seventh District | 0 | +1 |
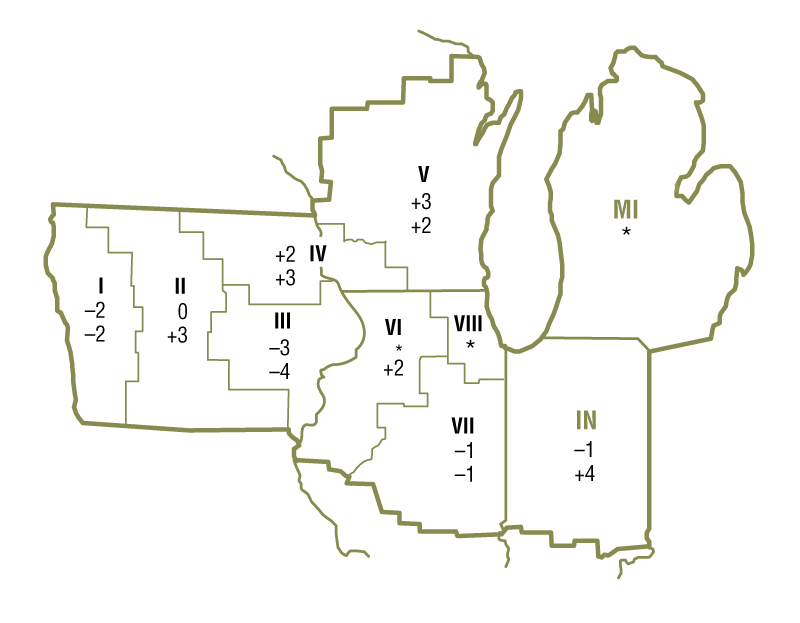
Top: April 1, 2020 to July 1, 2020
Bottom: July 1, 2019 to July 1, 2020
These results belied the wallop taken by the economy, including the agricultural sector, from the Covid-19 pandemic. Not only were millions of jobs lost, but food consumption patterns were altered—people ate more food at home and less at restaurants and other food service establishments. These changes led to losses of off-farm income (and benefits) for many farm households and a major drop in farm income, as prices for commodities fell. The U.S. Department of Agriculture's (USDA) June index of prices received by farmers was down 5 percent from a year earlier (see final table). Especially hard hit, corn prices were down 21 percent from a year ago in June, following a plunge in ethanol usage; similarly, hog prices were down 30 percent from a year earlier. Despite some categories (such as dairy) seeing gains in exports, cumulative exports of agricultural products were down over the past 12 months (including in June) compared with the 12 months that preceded them, given that trade slowed because of the pandemic and lingering disputes.
Survey responses revealed the broad financial distress from the Covid-19 pandemic in rural areas. Respondents indicated that 97 percent of their lending areas were at least modestly affected by the pandemic in the first half of 2020—larger than the reach of extreme weather events in 2019. Moreover, according to responding bankers, 30 percent of their agricultural borrowers were significantly affected by the pandemic in the first six months of 2020 and another 51 percent were modestly affected. In response to the pandemic’s impact on farming, the federal government instituted additional assistance to agriculture—beyond that of the Market Facilitation Program (MFP), which had been designed to deal with lost farm income from shrinking exports. By the end of June, the Coronavirus Food Assistance Program (CFAP) had already dispersed nearly $1.3 billion to farm operations in the five states of the District (27 percent of the almost $5 billion sent in total). As one Illinois banker observed, the “Market Facilitation Program, CFAP, and other farm programs have contributed to stability in spite of low commodity prices.”
Corn and soybean prices have been pressured down by pandemic-related factors; they have also been weighed down by forecasts of large harvests due to increased plantings and mostly favorable crop conditions. Using trend yields, the USDA estimated in July that 2020’s harvest of corn for grain would be 15.0 billion bushels (second only to the record set in 2016) and that this year’s harvest of soybeans would be 4.1 billion bushels (the fourth largest of all time). The USDA estimated prices for the 2020–21 crop year of $3.35 per bushel for corn and $8.50 per bushel for soybeans. When calculated with these prices, the projected revenues from the 2020 U.S. harvests relative to revenues from the previous year’s would be 2.5 percent larger for corn and 15.7 percent larger for soybeans. So, even with lower expected crop prices, corn and soybean revenues in 2020 should bounce back from their levels in 2019, when they struggled. Farmland values seemed to benefit not only from the rebound in crop revenues and higher government payments, but also from lower nominal interest rates and a “flight to safety” mentality spurred by the pandemic.
Credit conditions
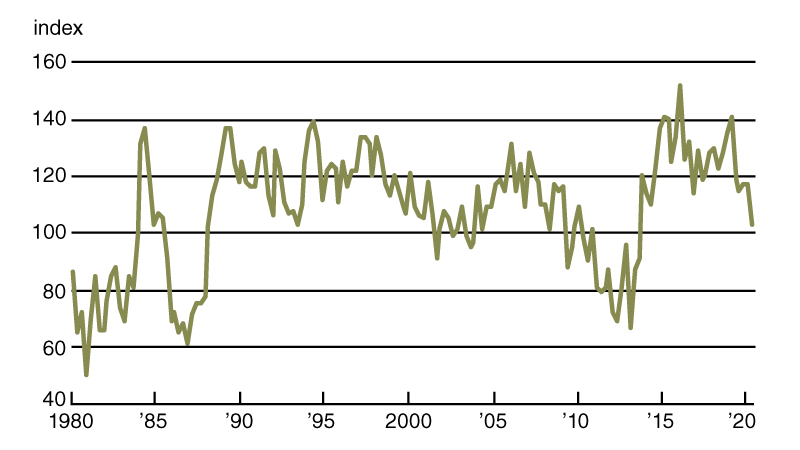
Even as overall agricultural credit conditions in the second quarter of 2020 continued to deteriorate, nominal interest rates reached new lows for the survey. As of July 1, 2020, the District’s average nominal interest rates on new feeder cattle, farm operating, and real estate loans had fallen to 4.94 percent, 4.77 percent, and 4.40 percent, respectively. Although nominal borrowing costs in the second quarter of 2020 were lower, demand for non-real-estate farm loans remained about the same as a year ago. With 27 percent of survey respondents noting demand for non-real-estate farm loans above the level of a year ago and 24 percent noting demand below that of a year ago, the index of loan demand was 103 for the second quarter of 2020 (its second-lowest reading in seven years, as seen in chart 1). Interestingly, over the first half of 2020, District banks made about their normal amount of agricultural real estate loans, but a higher-than-normal amount of farm operating loans, according to responding bankers. In the first six months of 2020, the Farm Credit System, as well as merchants, dealers, and other input suppliers, reportedly expanded their agricultural lending, while such lending by life insurance companies was steady. With 26 percent of survey respondents reporting their banks had more funds available to lend in the second quarter of 2020 than a year ago and 7 percent reporting they had less, the index of funds availability was 119 for the second quarter of 2020 (its highest reading in six years). With demand for non-real-estate farm loans little changed from a year ago and funds available to lend higher on the whole, the District’s average loan-to-deposit ratio for the second quarter of 2020 eased to 77.6 percent (it was 5.3 percentage points below the average level desired by the responding bankers). Credit was again tighter than in the previous year for the second quarter of 2020, as 23 percent of the survey respondents reported that their banks required larger amounts of collateral than a year ago and none reported that their banks required smaller amounts.
1. Index of demand for Seventh District non-real-estate farm loans
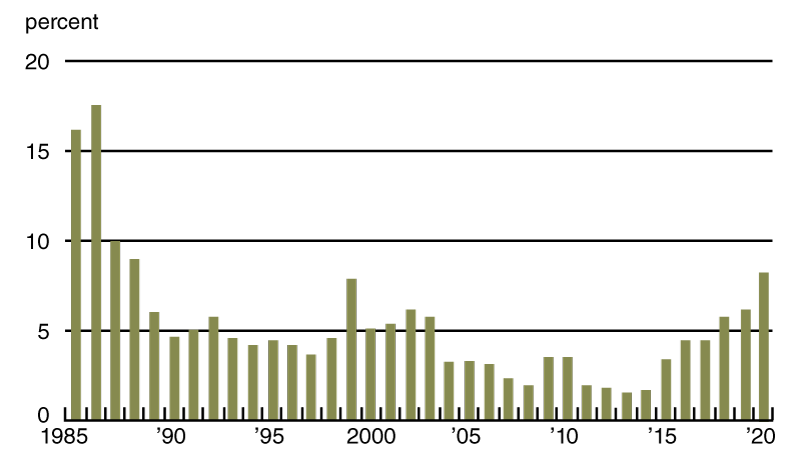
Despite an influx of government support, repayment rates for non-real-estate farm loans were lower in the second quarter of 2020 compared with the second quarter of 2019. The index of loan repayment rates was 64 for the second quarter of 2020 (3 percent of responding bankers noted higher rates of loan repayment than a year ago and 39 percent noted lower rates). At 8.3 percent of the District loan portfolio, the share of farm loans with “major” or “severe” repayment problems (as measured in the second quarter of every year) was last higher in 1988 (see chart 2). Furthermore, renewals and extensions of non-real-estate farm loans during the April through June period of 2020 were higher than during the same period of a year ago, as 49 percent of survey respondents reported more of them and just 1 percent reported fewer of them.
2. Percentage of Seventh District farm loan portfolio with “major” or “severe” repayment problems
Credit conditions at Seventh District agricultural banks
| Interest rates on farm loans | |||||||
| Loan demand | Funds availability | Loan repayment rates | Average loan-to-deposit ratio |
Operating loansa | Feeder cattlea | Real estatea | |
|---|---|---|---|---|---|---|---|
| (index)b | (index)b | (index)b | (percent) | (percent) | (percent) | (percent) | |
| 2019 | |||||||
| Jan–Mar | 141 | 86 | 52 | 78.6 | 6.04 | 6.11 | 5.53 |
| Apr–June | 119 | 93 | 74 | 80.2 | 5.98 | 6.14 | 5.39 |
| July–Sept | 115 | 103 | 70 | 78.8 | 5.71 | 5.77 | 5.08 |
| Oct–Dec | 117 | 107 | 79 | 78.9 | 5.49 | 5.61 | 4.97 |
| 2020 | |||||||
| Jan–Mar | 117 | 107 | 59 | 78.9 | 4.83 | 5.01 | 4.51 |
| Apr–June | 103 | 119 | 64 | 77.6 | 4.77 | 4.94 | 4.40 |
bBankers responded to each item by indicating whether conditions in the current quarter were higher or lower than (or the same as) in the year-earlier quarter. The index numbers are computed by subtracting the percentage of bankers who responded “lower” from the percentage who responded “higher” and adding 100.
Note: Historical data on Seventh District agricultural credit conditions are available online.
Looking forward
Even with additional government funds and expectations of large harvests of corn and soybeans, most survey respondents anticipated District farmland values would be stable in the near term: 79 percent of responding bankers projected no change in farmland values for the third quarter of 2020 (20 percent projected them to decrease, while only 1 percent projected them to increase). Survey respondents expected volumes of non-real-estate farm loans to stay about the same in the third quarter of 2020 compared with year-earlier levels, although they expected volumes of operating loans and loans guaranteed by the Farm Service Agency of the USDA to increase. Meanwhile, they anticipated the volume of farm real estate loans to decrease. As one Wisconsin banker noted, “The drop in all commodity prices will certainly impact many and force some to make tough decisions this fall.”
Selected agricultural economic indicators
| Percent change from | |||||
|---|---|---|---|---|---|
| Latest period | Value | Prior period | Year ago | Two years ago | |
| Prices received by farmers (index, 2011=100) | June | 89 | 1.0 | –5 | –6 |
| Crops (index, 2011=100) | June | 92 | –3.3 | 2 | 2 |
| Corn ($ per bu.) | June | 3.16 | –1.3 | –21 | –12 |
| Hay ($ per ton) | June | 162 | –1.2 | –8 | –1 |
| Soybeans ($ per bu.) | June | 8.34 | 0.7 | 0 | –13 |
| Wheat ($ per bu.) | June | 4.56 | –4.2 | –5 | –12 |
| Livestock and products (index, 2011=100) | June | 87 | 5.0 | –11 | –12 |
| Barrows & gilts ($ per cwt.) | June | 42.20 | –19.9 | –30 | –29 |
| Steers & heifers ($ per cwt.) | June | 110.00 | –0.9 | –4 | –3 |
| Milk ($ per cwt.) | June | 18.10 | 33.1 | 0 | 11 |
| Eggs ($ per doz.) | June | 0.72 | –7.1 | 1 | –30 |
| Consumer prices (index, 1982–84=100) | June | 258 | 0.5 | 1 | 2 |
| Food | June | 270 | 0.5 | 5 | 7 |
| Production or stocks | |||||
| Corn stocks (mil. bu.) | June 1 | 5,224 | N.A. | 0 | –2 |
| Soybean stocks (mil. bu.) | June 1 | 1,386 | N.A. | –22 | 14 |
| Wheat stocks (mil. bu.) | June 1 | 1,044 | N.A. | –3 | –5 |
| Beef production (bil. lb.) | June | 2.37 | 27.3 | 1 | 3 |
| Pork production (bil. lb.) | June | 2.40 | 27.7 | 13 | 19 |
| Milk production (bil. lb.) | June | 18.3 | –3.7 | 1 | 0 |
| Agricultural exports ($ mil.) | June | 9,958 | –3.7 | –8 | –15 |
| Corn (mil. bu.) | June | 198 | –11.7 | 64 | –29 |
| Soybeans (mil. bu.) | June | 68 | –8.4 | –44 | –45 |
| Wheat (mil. bu.) | June | 84 | –2.7 | 6 | 49 |
| Farm machinery (units) | |||||
| Tractors, 40 HP or more | June | 9,199 | 15 | 22 | 15 |
| 40 to 100 HP | June | 7,624 | 17 | 28 | 21 |
| 100 HP or more | June | 1,575 | 4 | –1 | –9 |
| Combines | June | 485 | 78 | 37 | 5 |
Sources: Author’s calculations based on data from the U.S. Department of Agriculture, U.S. Bureau of Labor Statistics, and the Association of Equipment Manufacturers.
SAVE THE DATE
On December 1, 2020, the Federal Reserve Bank of Chicago will hold a virtual event on Midwest agriculture and the changes it may face from shifts in consumer demand. Event details are available online.


