

Summary
Farmland values for the Seventh Federal Reserve District climbed 14 percent on a year-over-year basis in the second quarter of 2021—their largest such gain in eight years. Values for “good” agricultural land moved up 3 percent in the second quarter of 2021 from the first quarter, according to a survey of 152 District bankers. With 70 percent of the survey respondents forecasting higher District farmland values during the July through September period of 2021 and 30 percent forecasting stable values, such values were expected to rise again during the third quarter of this year.
Agricultural credit conditions for the District were better in the second quarter of 2021 than a year earlier, in spite of the pandemic’s impact on rural regions. Seventy-two percent of the responding bankers indicated that their respective lending areas had been at least modestly affected by the pandemic during the past year; yet, on average, just 34 percent of their agricultural borrowers were negatively affected by the pandemic over the same time frame. In the second quarter of 2021, repayment rates for non-real-estate farm loans dramatically improved from the same quarter of the previous year. The portion of the District’s agricultural loan portfolio reported as having “major” or “severe” repayment problems (2.8 percent) had not been lower in the second quarter of a year since 2014. Notably, this share was markedly lower than the 8.3 percent registered for the second quarter of 2020. Furthermore, renewals and extensions of non-real-estate farm loans in the District decreased from a year ago. For the April through June period of 2021, the demand for non-real-estate farm loans was much smaller than a year earlier, but the funds available for lending by agricultural banks were much greater. Hence, for the second quarter of 2021, the District’s average loan-to-deposit ratio was down to 67.5 percent. Average nominal interest rates on operating, feeder cattle, and farm real estate loans ended the second quarter of 2021 at their lowest points in the history of the survey.
Farmland values
At 14 percent, the year-over-year increase in the value of District farmland for the second quarter of 2021 was the largest recorded since 2013’s third quarter. All five District states exhibited double-digit year-over-year gains in their agricultural land values (see map and table below, but note that too few Michigan bankers responded to report a numerical change in farmland values). “Good” agricultural land in the District increased 3 percent in the second quarter of 2021 relative to the first quarter. This was the third quarterly gain in a row for District agricultural land values; there had not been such a streak since the first quarter of 2013.
Percent change in dollar value of “good” farmland
| April 1, 2021 to July 1, 2021 |
July 1, 2020 to July 1, 2021 |
|
|---|---|---|
| Illinois | +3 | +12 |
| Indiana | +2 | +12 |
| Iowa | +6 | +18 |
| Michigan | * | * |
| Wisconsin | 0 | +13 |
| Seventh District | +3 | +14 |
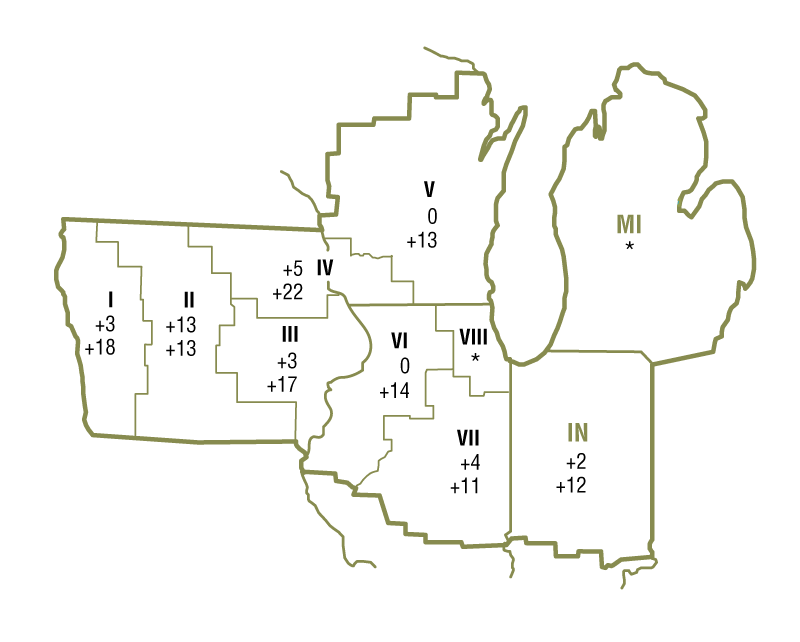
Top: April 1, 2021 to July 1, 2021
Bottom: July 1, 2020 to July 1, 2021
After the recession induced by the Covid-19 pandemic ended in April 2020, agricultural prices began to bounce back over the summer of 2020. The U.S. Department of Agriculture’s (USDA) June index of prices received by farmers was up 22 percent from a year earlier (see final table). Of particular relevance to the District were the June corn, soybean, and hog prices, which were up 90 percent, 74 percent, and 100 percent from a year ago, respectively. Accelerating exports of agricultural products helped push prices higher, after trade had slowed because of the pandemic and various disputes.
Nearly three-fourths of the survey respondents (72 percent) indicated that the Covid-19 pandemic had some negative impacts in the rural areas served by their respective banks over the past year. Yet, according to these bankers’ survey responses, on average, only around one-third of their farm customers were negatively affected by the pandemic over the same time frame (6 percent were significantly adversely affected, and 28 percent were modestly so). These results were much better than those of similar survey questions asked a year ago. The remarkable recovery for farm borrowers was assisted by rising product prices and federal government funds allocated for agriculture. By the end of July 2021, the Coronavirus Food Assistance Program (CFAP) had dispersed over $5.7 billion to farm operations in the five states of the District (23 percent of the $24.4 billion sent nationwide). Additional resources flowed to agriculture through the Paycheck Protection Program (PPP), and many farms qualified for forgiveness of PPP loans. An Illinois banker stated that “government payments have buoyed the agricultural sector.”
Corn and soybean prices have been supported by tight stocks, higher levels of exports during the pandemic, and concerns about the impact of drought on yields in the western Corn Belt. Using trend yields, the USDA estimated in July that 2021’s harvest of corn for grain would be 15.2 billion bushels (a potential record) and that this year’s harvest of soybeans would be 4.4 billion bushels (the third largest of all time). The USDA forecasted prices for the 2021–22 crop year of $5.60 per bushel for corn and $13.70 per bushel for soybeans. When calculated with these prices, the projected revenues from the 2021 U.S. harvests relative to revenues from the previous year’s would be 29 percent larger for corn and 50 percent larger for soybeans. Thus, expected corn and soybean revenues in 2021 should surpass their levels in 2020 (when they surprised observers because crop prices moved up even with large harvests by historical standards). Agricultural land values have been spurred higher by a surge in farm revenues and an influx of government payments. Moreover, historically low interest rates have had a positive effect on such values.
Credit conditions
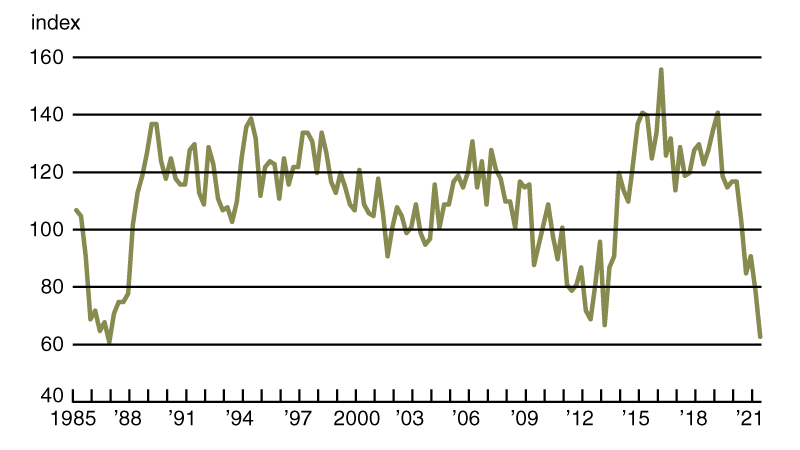
The recent improvement in agricultural credit conditions continued into the second quarter of 2021. Nominal interest rates on agricultural loans dipped to new lows for the survey: The District’s average nominal interest rates on new feeder cattle, operating, and farm real estate loans moved down to 4.55 percent, 4.40 percent, and 4.02 percent, respectively, as of July 1, 2021. After being adjusted for inflation with the Personal Consumption Expenditures Price Index, average agricultural interest rates were below the levels seen last in the third quarter of 1975. Even with lower interest rates in the second quarter of 2021, demand for non-real-estate farm loans was constrained. With 9 percent of survey respondents noting demand for non-real-estate farm loans above the level of a year ago and 46 percent noting demand below that of a year ago, the index of loan demand was 63 for the second quarter of 2021; this was the lowest reading since the fourth quarter of 1986 (as seen in chart 1). In line with these results, over the first half of 2021, District banks made fewer farm operating and real estate loans than normal, according to responding bankers. In contrast, over the first six months of 2021, the Farm Credit System, as well as merchants, dealers, and other input suppliers, reportedly lent more funds to the agricultural sector than the normal volume (and such lending by life insurance companies was at about the typical level). With 61 percent of survey respondents reporting their banks had more funds available to lend in the second quarter of 2021 than a year ago and just 1 percent reporting they had less, the index of funds availability was 160 for the second quarter of 2021 (slightly below the prior quarter’s reading). With demand for non-real-estate farm loans down sharply from a year ago and funds available to lend up robustly, the District’s average loan-to-deposit ratio for the second quarter of 2021 fell to 67.5 percent, its lowest level in seven years (and 13 percentage points below the average level desired by the responding bankers). On net, the amount of collateral required by banks across the District was about the same as a year ago.
1. Index of demand for Seventh District non-real-estate farm loans
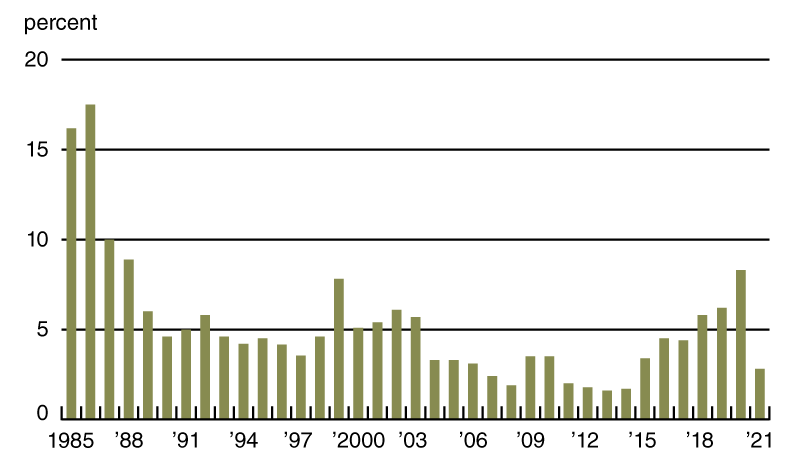
Higher crop prices and government disbursements combined again to help boost repayment rates for non-real-estate farm loans: The index of loan repayment rates was 146 for the second quarter of 2021 (48 percent of responding bankers noted higher rates of loan repayment than a year ago and only 2 percent noted lower rates). At 2.8 percent of the District loan portfolio, the share of farm loans with “major” or “severe” repayment problems (as measured in the second quarter of every year) was last lower in 2014—this result was a big turnaround from a year ago (see chart 2). Additionally, renewals and extensions of non-real-estate farm loans during the April through June period of 2021 were lower than during the same period of a year ago, as merely 3 percent of survey respondents reported more of them and 34 percent reported fewer of them.
2. Percentage of Seventh District farm loan portfolio with “major” or “severe” repayment problems
Credit conditions at Seventh District agricultural banks
| Interest rates on farm loans | |||||||
| Loan demand | Funds availability | Loan repayment rates | Average loan-to-deposit ratio | Operating loansa | Feeder cattlea | Real estatea | |
|---|---|---|---|---|---|---|---|
| (index)b | (index)b | (index)b | (percent) | (percent) | (percent) | (percent) | |
| 2020 | |||||||
| Jan–Mar | 117 | 107 | 59 | 78.9 | 4.83 | 5.01 | 4.51 |
| Apr–June | 103 | 119 | 64 | 77.6 | 4.77 | 4.94 | 4.40 |
| July–Sept | 85 | 131 | 93 | 75.0 | 4.65 | 4.79 | 4.24 |
| Oct–Dec | 91 | 148 | 133 | 73.6 | 4.49 | 4.66 | 4.10 |
| 2021 | |||||||
| Jan–Mar | 79 | 162 | 146 | 69.7 | 4.42 | 4.58 | 4.08 |
| Apr–June | 63 | 160 | 146 | 67.5 | 4.40 | 4.55 | 4.02 |
bBankers responded to each item by indicating whether conditions in the current quarter were higher or lower than (or the same as) in the year-earlier quarter. The index numbers are computed by subtracting the percentage of bankers who responded “lower” from the percentage who responded “higher” and adding 100.
Note: Historical data on Seventh District agricultural credit conditions are available online.
Looking forward
Given strong agricultural credit conditions, most survey respondents anticipated District farmland values will keep rising: 70 percent of responding bankers projected farmland values to increase in the third quarter of 2021, and 30 percent projected them to be stable (none projected them to decrease). Survey respondents anticipated volumes of most types of non-real-estate farm loans to decline in the third quarter of 2021 compared with year-earlier levels. In contrast, they anticipated the volume of farm real estate loans to increase. While District agricultural bankers seemed optimistic about the farm sector over the short term, some cautioned about its longer-term prospects, given the uncertainties surrounding the course of the pandemic and government responses, as well as trade flows and input costs. As one Illinois banker noted: “High commodity prices, solid yields, and PPP loans have sharply improved farmers’ finances. However, long-term risks are of serious concern.”
Selected agricultural economic indicators
| Percent change from | |||||
|---|---|---|---|---|---|
| Latest period | Value | Prior period | Year ago | Two years ago | |
| Prices received by farmers (index, 2011=100) | June | 107 | 0.9 | 22 | 15 |
| Crops (index, 2011=100) | June | 107 | 1.4 | 20 | 19 |
| Corn ($ per bu.) | June | 6.00 | 1.5 | 90 | 51 |
| Hay ($ per ton) | June | 179 | 1.7 | 10 | 2 |
| Soybeans ($ per bu.) | June | 14.50 | –2.0 | 74 | 74 |
| Wheat ($ per bu.) | June | 6.24 | –3.4 | 37 | 30 |
| Livestock and products (index, 2011=100) | June | 108 | 0.7 | 24 | 11 |
| Barrows & gilts ($ per cwt.) | June | 82.70 | 4.3 | 100 | 39 |
| Steers & heifers ($ per cwt.) | June | 123.00 | 1.7 | 12 | 7 |
| Milk ($ per cwt.) | June | 18.40 | –4.2 | 1 | 2 |
| Eggs ($ per doz.) | June | 0.79 | –3.5 | 10 | 11 |
| Consumer prices (index, 1982–84=100) | June | 271 | 0.9 | 5 | 6 |
| Food | June | 276 | 0.8 | 2 | 7 |
| Production or stocks | |||||
| Corn stocks (mil. bu.) | June 1 | 4,112 | N.A. | –18 | –21 |
| Soybean stocks (mil. bu.) | June 1 | 767 | N.A. | –44 | –57 |
| Wheat stocks (mil. bu.) | June 1 | 844 | N.A. | –18 | –22 |
| Beef production (bil. lb.) | June | 2.40 | 8.5 | 1 | 8 |
| Pork production (bil. lb.) | June | 2.25 | 8.9 | –6 | 6 |
| Milk production (bil. lb.) | June | 19.0 | –4.5 | 3 | 4 |
| Agricultural exports ($ mil.) | June | 12,991 | –11.4 | 27 | 16 |
| Corn (mil. bu.) | June | 261 | –21.7 | 32 | 116 |
| Soybeans (mil. bu.) | June | 34 | –27.0 | –49 | –71 |
| Wheat (mil. bu.) | June | 74 | –16.3 | –12 | –7 |
| Farm machinery (units) | |||||
| Tractors, 40 HP or more | June | 9,467 | 6 | 3 | 25 |
| 40 to 100 HP | June | 7,382 | 6 | –3 | 23 |
| 100 HP or more | June | 2,085 | 4 | 33 | 32 |
| Combines | June | 502 | 39 | 4 | 41 |
Sources: Author’s calculations based on data from the U.S. Department of Agriculture, U.S. Bureau of Labor Statistics, and the Association of Equipment Manufacturers.
SAVE THE DATE
On November 30, 2021, the Federal Reserve Bank of Chicago will hold a virtual event exploring the impact of biofuels on Midwest farming and related trends that could influence the future of agriculture. Registration is available online.


