

Summary
Farmland values for the Seventh Federal Reserve District rose 22 percent in the second quarter of 2022 from a year earlier, roughly matching the year-over-year gains of the previous two quarters. Values for “good” agricultural land were up 2 percent in the second quarter of 2022 from the first quarter, according to survey responses from 137 banks in the District. Twenty-five percent of the survey respondents forecasted higher District farmland values during the July through September period of 2022, and 4 percent forecasted lower values; given the greater share of optimistic next-quarter projections reported by the previous six surveys, the results from the most recent survey suggested shrinking expectations for farmland values to increase during the third quarter of 2022.
Agricultural credit conditions for the District were better in the second quarter of 2022 than a year ago. Moreover, relative to a year earlier, the economic effects of the Covid-19 pandemic seemed to have somewhat receded in rural parts of the District. Fifty-six percent of the survey respondents indicated that their respective banks’ lending areas had been at least modestly affected by the pandemic during the past year (12 months ago, that share had been 72 percent). On average, 74 percent of the responding bankers’ agricultural borrowers were not affected by the pandemic over the same period. In the second quarter of 2022, repayment rates for non-real-estate farm loans improved from a year ago, continuing the pattern of the previous six quarters. The portion of the District’s agricultural loan portfolio reported as having “major” or “severe” repayment problems (1.9 percent) was tied for the fourth-lowest level on record for a second quarter. In addition, renewals and extensions of non-real-estate farm loans in the District were reduced from a year ago. For the April through June period of 2022, the demand for non-real-estate farm loans was lower than a year earlier, while the level of funds available for lending by agricultural banks was higher than a year earlier—in line with the patterns of the previous seven quarters. Even so, for the second quarter of 2022, the District’s average loan-to-deposit ratio edged up to 67.0 percent, which was still the second-lowest reading since the third quarter of 2013. Average nominal interest rates on operating, feeder cattle, and farm real estate loans moved sharply higher during the second quarter of 2022, ending at their highest points since 2019.
Farmland values
At 22 percent, the year-over-year increase in the value of District farmland for the second quarter of 2022 was nearly as large as the year-over-year increase for the first quarter. Indiana and Iowa exhibited the largest year-over-year gains in agricultural land values (see map and table). “Good” farmland values in the District increased 2 percent in the second quarter of 2022 relative to the first quarter. This was the smallest quarterly gain in District farmland values since the third quarter of 2020. Yet, several respondents mentioned buyers from outside agriculture were helping to push farmland values higher, indicating demand had remained healthy. A Wisconsin banker said there were “too many buyers seeking too few acres,” with “outside interest from nonfarm buyers still strong.”
Percent change in dollar value of “good” farmland
| April 1, 2022 to July 1, 2022 |
July 1, 2021 to July 1, 2022 |
|
|---|---|---|
| Illinois | 0 | +18 |
| Indiana | +1 | +25 |
| Iowa | +4 | +26 |
| Michigan | * | * |
| Wisconsin | –1 | +13 |
| Seventh District | +2 | +22 |
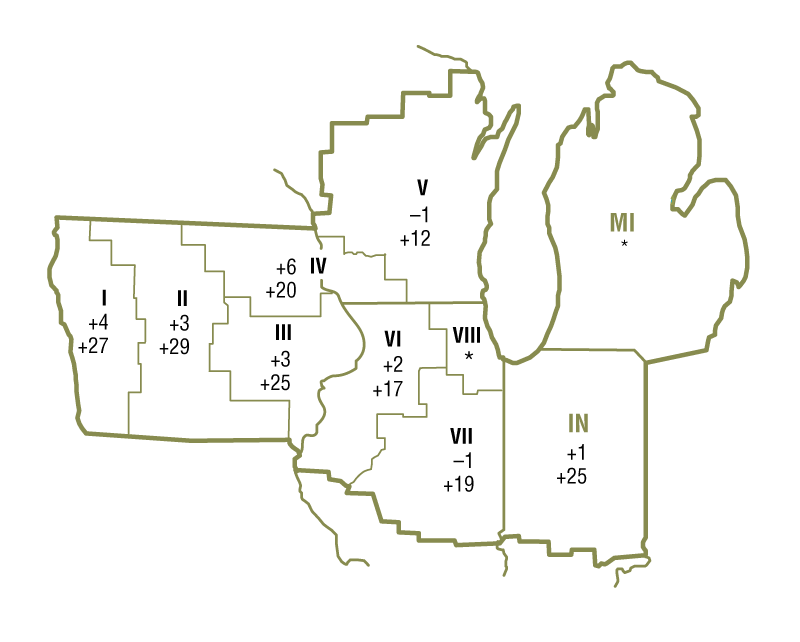
Top: April 1, 2022 to July 1, 2022
Bottom: July 1, 2021 to July 1, 2022
Agricultural prices rose in June 2022 from June 2021, staying on the upward trajectory for farm prices that had started in the summer of 2020. The U.S. Department of Agriculture’s (USDA) June index of prices received by farmers increased 26 percent from a year ago and 53 percent from two years ago (see final table). Of particular relevance to the District were the June corn, soybean, and milk prices, which were up 23 percent, 13 percent, and 48 percent from a year ago, respectively.
Corn and soybean prices have been supported by fairly tight stocks, uncertainties surrounding Ukrainian exports, and concerns about the impacts of delayed plantings and drought on yields. Using long-term trend yields, the USDA estimated in July that 2022’s harvest of corn for grain would be 14.5 billion bushels (down 4 percent from 2021) and that this year’s harvest of soybeans would be 4.5 billion bushels (a potential record). The USDA forecasted prices for the 2022–23 crop year of $6.65 per bushel for corn and $14.40 per bushel for soybeans. When calculated with these prices, the projected revenues from the 2022 U.S. harvests relative to revenues from the previous year’s would be 7.3 percent larger for corn and 10 percent larger for soybeans. Thus, expected corn and soybean revenues in 2022 should surpass their levels in 2021.
Prices paid by farmers increased substantially from a year ago as well (13 percent overall for commodities and services, interest, taxes, and wage rates, based on USDA data). Most notably, fertilizer and diesel prices were up dramatically from a year earlier. An Iowa banker commented: “Higher commodity prices, coupled with government farm payments, and actively managed input costs for 2022 will result in a modestly profitable year for area agricultural producers.” Although momentum from strong farm incomes contributed to higher farmland values, it was uncertain how long this effect would last, given the rising interest rate environment.
Credit conditions
Although agricultural credit conditions in the second quarter of 2022 improved from a year ago yet again, nominal interest rates on agricultural loans surged higher. The District’s average nominal interest rates on new feeder cattle, operating, and farm real estate loans stood at 5.53 percent, 5.42 percent, and 5.17 percent, respectively, as of July 1, 2022 (levels not seen since 2019). After being adjusted for inflation with the Personal Consumption Expenditures Price Index, average agricultural interest rates were above those of the previous two quarters but remained historically low.
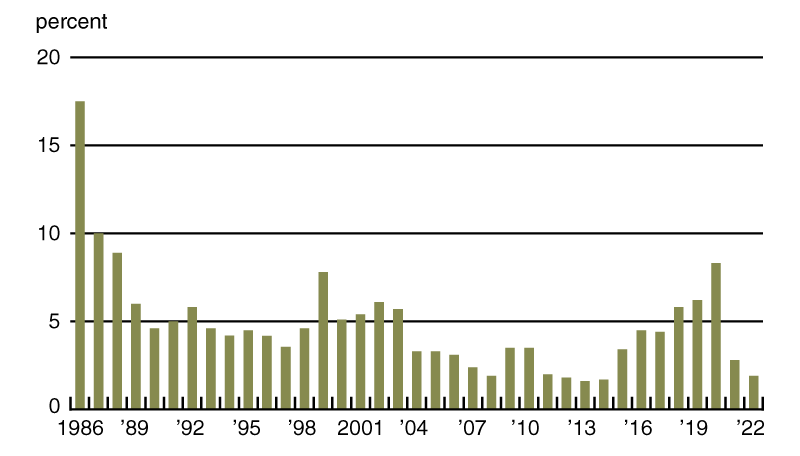
Elevated levels of liquidity seemed to improve repayment rates for non-real-estate farm loans: The index of loan repayment rates was 133 for the second quarter of 2022 (see chart 1), with 36 percent of responding bankers noting higher rates of loan repayment than a year ago and 3 percent noting lower rates. The current streak of seven quarters with year-over-year improvements in loan repayment rates tied for fourth longest in the index’s history. Last lower in 2014, the share of farm loans with “major” or “severe” repayment problems in the District loan portfolio (as measured in the second quarter of every year) was 1.9 percent—which represented the continuation of a remarkable turnaround from two years ago (see chart 2). Additionally, renewals and extensions of non-real-estate farm loans during the April through June period of 2022 were lower than during the same period of a year earlier, as just 2 percent of survey respondents reported more of them and 24 percent reported fewer.
1. Index of repayment rates for Seventh District non-real-estate farm loans

2. Percentage of Seventh District farm loan portfolio with “major” or “severe” repayment problems
Demand for non-real-estate farm loans was again down from a year ago in the second quarter of 2022, as some farmers reportedly had cash available to fund operations. With 20 percent of survey respondents observing demand for non-real-estate farm loans above the level of a year ago and 38 percent observing demand below that of a year ago, the index of loan demand was 82 for the second quarter of 2022. In line with these results, over the first half of 2022, District banks originated fewer farm operating and real estate loans than normal (likewise for life insurance companies), according to responding bankers. In contrast, over the first six months of 2022, the Farm Credit System, as well as merchants, dealers, and other input suppliers, reportedly lent more funds to the agricultural sector than normal. With 35 percent of survey respondents noting their banks had more funds available to lend than a year ago and 6 percent noting they had less, the index of funds availability was 129 for the second quarter of 2022 (the lowest reading since the second quarter of 2020). The District’s average loan-to-deposit ratio for the second quarter of 2022 edged up to 67.0 percent (14 percentage points below the average level desired by the responding bankers). Also, the amount of collateral required by banks across the District was slightly higher than a year ago.
The Covid-19 pandemic’s financial impacts on rural areas seemed to abate somewhat over the past year. Fifty-six percent of the survey respondents indicated that the pandemic had some negative impacts in the rural areas served by their respective banks in the past 12 months (5 percent indicated these areas were significantly negatively affected, and 51 percent indicated they were modestly so). According to bankers’ survey responses, on average, only 3 percent of their farm customers were significantly adversely affected by the pandemic, while 23 percent were modestly affected in a negative way, over the same time frame.
Credit conditions at Seventh District agricultural banks
| Interest rates on farm loans | |||||||
| Loan demand | Funds availability | Loan repayment rates | Average loan-to-deposit ratio | Operating loansa | Feeder cattlea | Real estatea | |
|---|---|---|---|---|---|---|---|
| (index)b | (index)b | (index)b | (percent) | (percent) | (percent) | (percent) | |
| 2021 | |||||||
| Jan–Mar | 79 | 162 | 146 | 69.7 | 4.42 | 4.58 | 4.08 |
| Apr–June | 63 | 160 | 146 | 67.5 | 4.40 | 4.55 | 4.02 |
| July–Sept | 78 | 161 | 143 | 68.8 | 4.34 | 4.51 | 4.01 |
| Oct–Dec | 76 | 152 | 153 | 67.2 | 4.34 | 4.53 | 4.03 |
| 2022 | |||||||
| Jan–Mar | 83 | 148 | 159 | 65.0 | 4.64 | 4.74 | 4.44 |
| Apr–June | 82 | 129 | 133 | 67.0 | 5.42 | 5.53 | 5.17 |
bBankers responded to each item by indicating whether conditions in the current quarter were higher or lower than (or the same as) in the year-earlier quarter. The index numbers are computed by subtracting the percentage of bankers who responded “lower” from the percentage who responded “higher” and adding 100.
Note: Historical data on Seventh District agricultural credit conditions are available online.
Looking forward
At least three-quarters of survey respondents in Illinois, Indiana, and Iowa were of the view that farmland was overvalued—in contrast with respondents in Michigan and Wisconsin, where at least half were of the view that farmland was appropriately valued. None of the respondents viewed agricultural ground as undervalued. Looking ahead to the third quarter of 2022, 25 percent of survey respondents anticipated farmland values to rise, 71 percent anticipated them to be stable, and 4 percent anticipated them to fall. Survey respondents expected lower volumes of non-real-estate farm loans in the third quarter of 2022 compared with year-earlier levels; they expected the volume of farm real estate loans to be about the same. So, District bankers seemed wary about Midwest agriculture’s prospects over the near term.
Selected agricultural economic indicators
| Percent change from | |||||
|---|---|---|---|---|---|
| Latest period | Value | Prior period | Year ago | Two years ago | |
| Prices received by farmers (index, 2011=100) | June | 135 | 0.2 | 26 | 53 |
| Crops (index, 2011=100) | June | 126 | 2.2 | 17 | 41 |
| Corn ($ per bu.) | June | 7.37 | 1.5 | 23 | 133 |
| Hay ($ per ton) | June | 212.00 | 1.0 | 18 | 36 |
| Soybeans ($ per bu.) | June | 16.40 | 1.9 | 13 | 97 |
| Wheat ($ per bu.) | June | 9.55 | –12.4 | 53 | 109 |
| Livestock and products (index, 2011=100) | June | 145 | –0.8 | 35 | 67 |
| Barrows & gilts ($ per cwt.) | June | 78.70 | 3.7 | –5 | 91 |
| Steers & heifers ($ per cwt.) | June | 142.00 | –1.4 | 15 | 29 |
| Milk ($ per cwt.) | June | 26.90 | –1.5 | 48 | 49 |
| Eggs ($ per doz.) | June | 2.03 | 1.0 | 150 | 183 |
| Consumer prices (index, 1982–84=100) | June | 295 | 1.3 | 9 | 15 |
| Food | June | 305 | 1.0 | 10 | 13 |
| Production or stocks | |||||
| Corn stocks (mil. bu.) | June 1 | 4,346 | N.A. | 6 | –13 |
| Soybean stocks (mil. bu.) | June 1 | 971 | N.A. | 26 | –30 |
| Wheat stocks (mil. bu.) | June 1 | 660 | N.A. | –22 | –36 |
| Beef production (bil. lb.) | June | 2.45 | 7.2 | 2 | 3 |
| Pork production (bil. lb.) | June | 2.26 | 3.3 | 0 | –6 |
| Milk production (bil. lb.) | June | 19.0 | –4.1 | 0 | 3 |
| Agricultural exports ($ mil.) | June | 16,166 | –5.4 | 24 | 59 |
| Corn (mil. bu.) | June | 216 | –23.6 | –17 | 9 |
| Soybeans (mil. bu.) | June | 83 | –6.0 | 145 | 26 |
| Wheat (mil. bu.) | June | 59 | 17.0 | –20 | –30 |
| Farm machinery (units) | |||||
| Tractors, 40 HP or more | June | 8,960 | 11 | –4 | –2 |
| 40 to 100 HP | June | 6,721 | 14 | –7 | –12 |
| 100 HP or more | June | 2,239 | 3 | 8 | 43 |
| Combines | June | 629 | 100 | 25 | 30 |
Sources: Author’s calculations based on data from the U.S. Department of Agriculture, U.S. Bureau of Labor Statistics, and the Association of Equipment Manufacturers.
SAVE THE DATE
On November 29, 2022, the Federal Reserve Bank of Chicago will hold a hybrid event to examine the barriers to entry into Midwest farming, as well as some of the issues facing farm family transitions between generations. Registration is available online.


