Read our AgLetter Insights Q&A with author David Oppedahl for further insights into Seventh District farmland values and agricultural credit conditions described in this issue of AgLetter.
Summary
Farmland values for the Seventh Federal Reserve District increased 2 percent in the second quarter of 2024 from a year earlier, marking the smallest year-over-year gain since the third quarter of 2020. Values for “good” agricultural land were flat in the second quarter of 2024 relative to the first quarter, according to survey respondents from 136 District agricultural banks. Five percent of survey respondents forecasted higher District farmland values during the third quarter of 2024, while 25 percent forecasted lower values; the remaining 70 percent forecasted farmland values to be stable during the July through September period of this year.
Agricultural credit conditions for the District were weaker in the second quarter of 2024 than a year ago. With repayment rates for non-real-estate farm loans lower than a year ago, the portion of the District’s agricultural loan portfolio reported as having “major” or “severe” repayment problems (2.2 percent) was higher than in the second quarter of 2023. In addition, renewals and extensions of non-real-estate farm loans in the District were above the level of a year earlier. For the April through June period of 2024, demand for non-real-estate farm loans was up from a year ago, whereas funds available for lending by agricultural banks were down. For the second quarter of 2024, the District’s average loan-to-deposit ratio rose to 76.9 percent—the highest reading since the second quarter of 2020. Average nominal interest rates on farm operating, feeder cattle, and farm real estate loans were little changed during the second quarter of 2024 from the first quarter, though they were higher than in the second quarter of 2023.
Farmland values
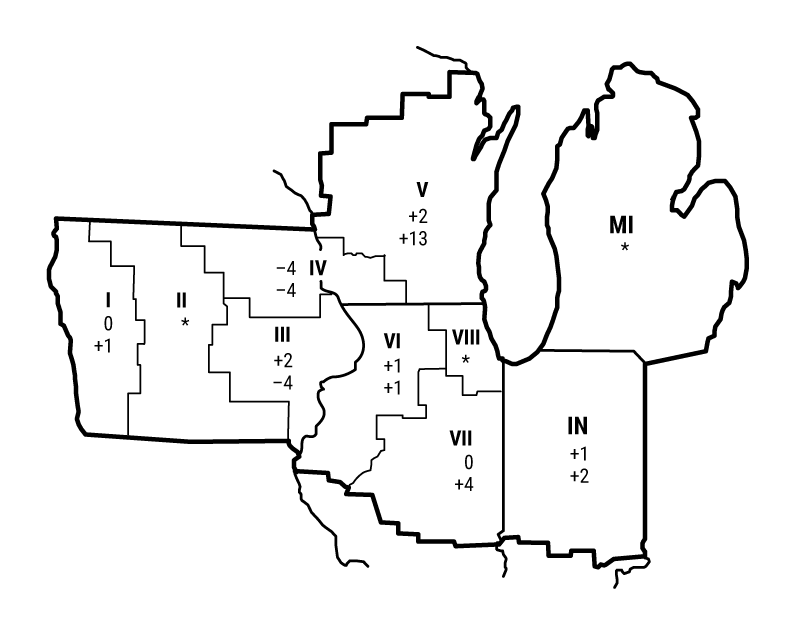
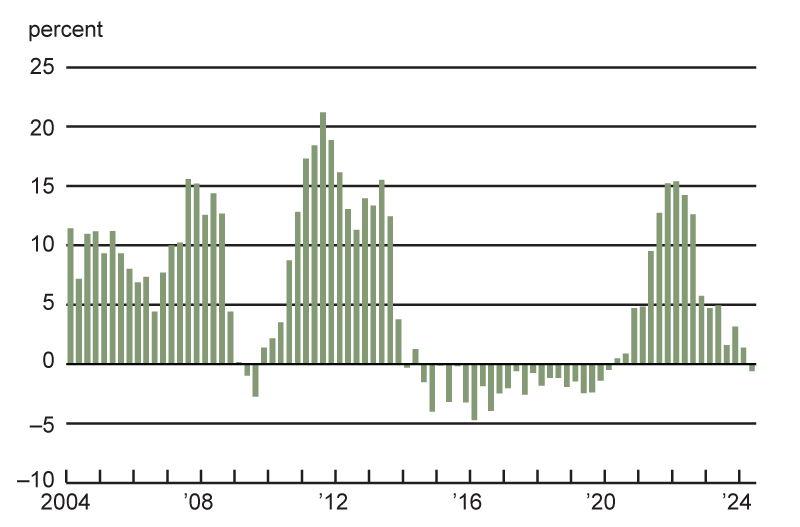
At 2 percent, the year-over-year increase in District farmland values for the second quarter of 2024 was the smallest gain during the 15 most recent quarters of data. Moreover, in real terms (after being adjusted for inflation with the Personal Consumption Expenditures Price Index, or PCEPI), there was actually a year-over-year decrease of 1 percent in District agricultural land values (see chart 1). This was the first negative year-over-year change in real farmland values for the District since the first quarter of 2020. Illinois, Indiana, and Wisconsin agricultural land values exhibited year-over-year gains of varying degrees; meanwhile, Iowa farmland values exhibited a year-over-year reduction (see map and table below). “Good” farmland values in the District as a whole showed no change in the second quarter of 2024 relative to the first quarter.
Percent change in dollar value of “good” farmland
|
April 1, 2024 to July 1, 2024 |
July 1, 2023 to July 1, 2024 |
|
|---|---|---|
| Illinois | 0 | +3 |
| Indiana | +1 | +2 |
| Iowa | –1 | –3 |
| Michigan | * | * |
| Wisconsin | +2 | +12 |
| Seventh District | 0 | +2 |

Top: April 1, 2024 to July 1, 2024
Bottom: July 1, 2023 to July 1, 2024
1. Year-over-year changes in real Seventh District farmland values, by quarter

Farmland value increases have slowed after their rapid rise over the prior three years. This deceleration has been accompanied by declines in key agricultural prices, which in turn have negatively affected farm revenues. The U.S. Department of Agriculture’s (USDA) June index of prices received by farmers for crops was down 11 percent from one year ago and was down 15 percent from two years ago (see final table). With steeper drops from two years ago, corn and soybean prices were 39 percent and 28 percent lower in June 2024 than in June 2022, respectively. In contrast, the USDA’s June index of prices received by farmers for livestock and products was up 10 percent from one year ago and was up 2 percent from two years ago. Even though down from two years ago, June hog and milk prices were up 3 percent and 28 percent from one year ago, respectively. Wisconsin’s farmland values seemed to reflect better returns from milk production, though crop returns lagged.
Corn and soybean prices moved down over the previous two years, given the more than sufficient stocks relative to usage for both crops. Supplies of corn and soybeans have been building after strong harvests, with expectations of large outputs in 2024 as well. Generally timely planting contributed to a good start to the growing season for District corn and soybean crops; in addition, above-average rains kept drought from being a factor during this crop season for the District. One Iowa respondent stated: “Our particular area has almost perfect growing conditions. Therefore, even though corn prices are down, everyone seems too optimistic that farmland values are holding steady.” The USDA estimated in July that 2024’s harvest of corn for grain would be 15.1 billion bushels (down 1.6 percent from 2023’s record) and that this year’s harvest of soybeans would be 4.4 billion bushels (up 6.5 percent from 2023’s level). The USDA forecasted prices for the 2024–25 crop year of $4.30 per bushel for corn and $11.10 per bushel for soybeans. When calculated with these prices, the projected revenues from the 2024 U.S. harvests relative to revenues from the previous year’s harvests would be down 9.0 percent for corn and 5.8 percent for soybeans. Hence, expected corn and soybean revenues in 2024 should not reach their levels of 2023, let alone their all-time peaks (set in 2021 and 2022, respectively).
Besides a bleaker revenue picture, prices paid by farmers were fairly flat following large increases in their costs through 2022. In June 2024, overall costs for commodities and services, interest, taxes, and wage rates were up 28 percent relative to June 2020, though they were essentially unchanged from June 2023, based on USDA data. Even so, the USDA’s Economic Research Service forecasted farm production expenses in 2024 to rise by 3.8 percent from 2023 for the nation. With potentially higher costs and lower revenues, net farm income was expected to fall in 2024. An Illinois banker reported that “net farm income will be low to negative.”
Credit conditions
Agricultural credit conditions in the second quarter of 2024 continued to show signs of softening in the District. As of July 1, 2024, the District’s average nominal interest rates on new operating loans (8.47 percent), feeder cattle loans (8.44 percent), and farm real estate loans (7.55 percent) were down slightly from their various high points in the past year. In real terms (after being adjusted for inflation with the PCEPI), the average interest rate on operating loans remained stable from the first quarter of 2024, but average interest rates on loans for feeder cattle and farm real estate in the second quarter of 2024 both decreased slightly from their recent peaks in the past year.
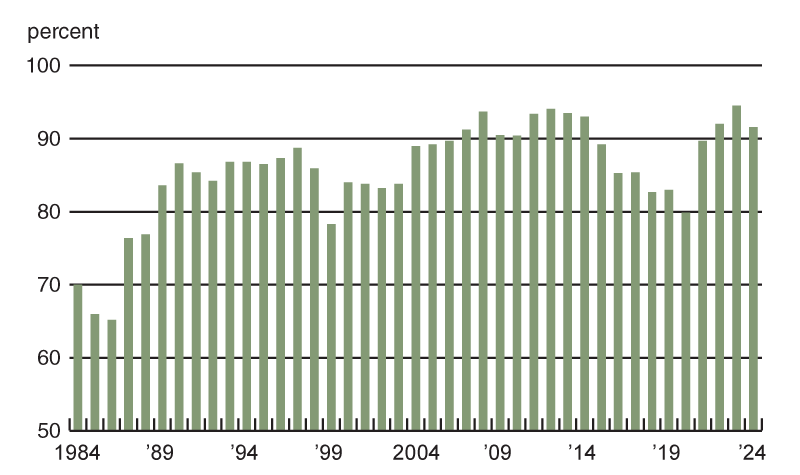
Repayment rates for non-real-estate farm loans relative to a year ago remained lower: The index of loan repayment rates was 85 for the second quarter of 2024, up slightly from 78 for the first quarter of 2024, but down from its value of 105 in the second quarter of 2023. Only 4 percent of responding bankers noted higher rates of loan repayment than a year ago and 19 percent noted lower rates. The share of farm loans with “major” or “severe” repayment problems in the District’s agricultural loan portfolio (as measured in the second quarter of every year) was 2.2 percent in 2024, up somewhat from last year’s 1.3 percent. The share of farm loans with “no” repayment problems declined to 91.6 percent from its all-time peak of 94.5 percent a year ago (see chart 2). Renewals and extensions of non-real-estate farm loans during the second quarter of 2024 were higher than during the same period of a year earlier, as 25 percent of survey respondents reported more of them and just 2 percent reported fewer.
2. Percentage of Seventh District farm loan portfolio with “no” repayment problems

In the second quarter of 2024, demand for non-real-estate farm loans relative to a year ago was up for the third consecutive quarter. With 29 percent of survey respondents observing demand for non-real-estate farm loans above the level of a year ago and 25 percent observing demand below that of a year ago, the index of loan demand was 104 for the second quarter of 2024. Over the first half of 2024, District banks originated more farm operating loans and fewer farm real estate loans than normal, according to responding bankers. Over the same time period, bankers reported that Farm Credit System lenders, as well as merchants, dealers, and other input suppliers, lent more funds to the agricultural sector than normal, while life insurance companies lent slightly less. Two percent of survey respondents noted that their banks had more funds available to lend than a year ago, while 28 percent noted they had less. The index of funds availability fell to 74, continuing to stay below its reading of 83 in the second quarter of 2023. More responding bankers reported lower deposits at their banks in the past year (39 percent) than those who reported higher deposits (36 percent). The District’s average loan-to-deposit ratio for the second quarter of 2024 was up to 76.9 percent, 4 percentage points below the average level desired by the responding bankers. The amount of collateral required by banks across the District was slightly higher than a year ago. Bankers viewed agricultural economic conditions as the largest influence on credit standards for approving farm loans during April through June of 2024, although conditions related to the macroeconomy, banking, and financial markets were also in the mix of influences.
Credit conditions at Seventh District agricultural banks
| Interest rates on farm loans | |||||||
| Loan demand | Funds availability | Loan repayment rates | Average loan-to-deposit ratio | Operating loansa | Feeder cattlea | Real estatea | |
|---|---|---|---|---|---|---|---|
| (index)b | (index)b | (index)b | (percent) | (percent) | (percent) | (percent) | |
| 2023 | |||||||
| Jan–Mar | 78 | 102 | 123 | 70.3 | 7.97 | 7.93 | 7.14 |
| Apr–June | 77 | 83 | 105 | 72.8 | 8.24 | 8.19 | 7.33 |
| July–Sept | 81 | 72 | 100 | 74.3 | 8.50 | 8.47 | 7.70 |
| Oct–Dec | 106 | 69 | 92 | 74.0 | 8.51 | 8.49 | 7.60 |
| 2024 | |||||||
| Jan–Mar | 136 | 78 | 78 | 76.1 | 8.44 | 8.45 | 7.57 |
| Apr–June | 104 | 74 | 85 | 76.9 | 8.47 | 8.44 | 7.55 |
Looking forward
Looking ahead to the third quarter of 2024, only 5 percent of the responding bankers anticipated farmland values to rise, 70 percent anticipated them to be stable, and 25 percent anticipated them to fall. A majority of survey respondents were of the view that District farmland was overvalued (not a single respondent was of the view that it was undervalued). Survey respondents expected higher volumes for non-real-estate agricultural loans (especially for operating loans) in the third quarter of 2024 compared with year-earlier levels. However, farm machinery, grain storage construction, and farm real estate loan volumes were expected to shrink below the levels seen in the third quarter of 2023. An Iowa respondent anticipated “working capital will decrease again this year.” According to another Iowa banker, “lower working capital is a strong predictor of challenges ahead for agriculture.”
Selected agricultural economic indicators
| Percent change from | |||||
|---|---|---|---|---|---|
| Latest period | Value | Prior period | Year ago | Two years ago | |
| Prices received by farmers (index, 2011=100) | June | 127 | 2.5 | 0 | –6 |
| Crops (index, 2011=100) | June | 108 | 4.0 | –11 | –15 |
| Corn ($ per bu.) | June | 4.48 | –0.7 | –31 | –39 |
| Hay ($ per ton) | June | 179.00 | –4.3 | –24 | –23 |
| Soybeans ($ per bu.) | June | 11.80 | –0.8 | –17 | –28 |
| Wheat ($ per bu.) | June | 5.86 | –5.3 | –24 | –39 |
| Livestock and products (index, 2011=100) | June | 147 | 3.1 | 10 | 2 |
| Barrows & gilts ($ per cwt.) | June | 68.90 | –0.1 | 3 | –14 |
| Steers & heifers ($ per cwt.) | June | 191.00 | 1.6 | 4 | 35 |
| Milk ($ per cwt.) | June | 22.80 | 3.6 | 28 | –15 |
| Eggs ($ per doz.) | June | 2.05 | 19.2 | 61 | 1 |
| Consumer prices (index, 1982–84=100) | June | 314 | 0.0 | 3 | 6 |
| Food | June | 330 | 0.2 | 2 | 8 |
| Production or stocks | |||||
| Corn stocks (mil. bu.) | June 1 | 4,993 | N.A. | 22 | 15 |
| Soybean stocks (mil. bu.) | June 1 | 970 | N.A. | 22 | 0 |
| Wheat stocks (mil. bu.) | June 1 | 702 | N.A. | 23 | 1 |
| Beef production (bil. lb.) | June | 2.14 | –8.2 | –9 | –13 |
| Pork production (bil. lb.) | June | 2.12 | –7.1 | –4 | –6 |
| Milk production (bil. lb.) | June | 18.8 | –4.5 | –1 | –1 |
| Agricultural exports ($ mil.) | June | 12,941 | –5.8 | 1 | –20 |
| Corn (mil. bu.) | June | 216 | –7.9 | 44 | 0 |
| Soybeans (mil. bu.) | June | 49 | –5.0 | 61 | –41 |
| Wheat (mil. bu.) | June | 54 | –7.7 | 28 | –8 |
| Farm machinery (units) | |||||
| Tractors, 40 HP or more | June | 8,077 | 10 | –11 | –8 |
| 40 to 100 HP | June | 5,650 | 12 | –10 | –14 |
| 100 HP or more | June | 2,427 | 4 | –13 | 9 |
| Combines | June | 463 | 15 | –31 | –24 |
Save the Date
On December 3, 2024, the Federal Reserve Bank of Chicago will hold a hybrid event to evaluate impacts from changes related to agricultural inputs for Midwest farming. Registration is available online.


