

Summary
Despite the lingering impacts of the Covid-19 pandemic, there was an annual increase of 6 percent in the Seventh Federal Reserve District’s agricultural land values in 2020—the largest such gain since 2012. Moreover, values for “good” farmland in the District were up 4 percent in the fourth quarter of 2020 from the third quarter, according to 137 agricultural bankers who responded to the survey. Fifty-eight percent of the survey respondents expected farmland values to rise during the January through March period of 2021, and 42 percent expected them to be stable; notably, none expected them to decline.
The District also experienced positive changes in its agricultural credit conditions during the fourth quarter of 2020. In the final quarter of 2020, repayment rates for non-real-estate farm loans were higher than a year ago, and loan renewals and extensions were lower than a year earlier. Neither of these farm credit indicators had recorded year-over-year improvements since the third quarter of 2013. Meanwhile, non-real-estate farm loan demand relative to a year ago was lower for the second quarter in a row. Funds available for lending by survey respondents’ banks were significantly higher than a year earlier. So, the average loan-to-deposit ratio for the District drifted down to 73.6 percent in the fourth quarter of 2020—its lowest reading since the second quarter of 2016. The District’s average interest rates on farm operating, feeder cattle, and farm real estate loans had decreased by the end of 2020 to all-time lows. A smaller share (just 1.4 percent) of current agricultural borrowers were not likely to qualify for operating credit at the survey respondents’ banks in 2021 than in 2020.
Farmland values
For 2020, the District saw a steep annual increase of 6 percent in its farmland values (see table and map below). In the fourth quarter of 2020, Indiana and Wisconsin experienced even larger year-over-year increases in their agricultural land values than the District did overall, whereas Iowa and Michigan experienced slightly smaller increases. (Illinois’s year-over-year gain in farmland values was on par with the District’s.) The District’s farmland values rose 4 percent in the fourth quarter of 2020 relative to the third quarter.
Percent change in dollar value of “good” farmland
| October 1, 2020 to January 1, 2021 |
January 1, 2020 to January 1, 2021 |
|
|---|---|---|
| Illinois | +4 | +6 |
| Indiana | +2 | +9 |
| Iowa | +6 | +5 |
| Michigan | +7 | +4 |
| Wisconsin | +2 | +7 |
| Seventh District | +4 | +6 |
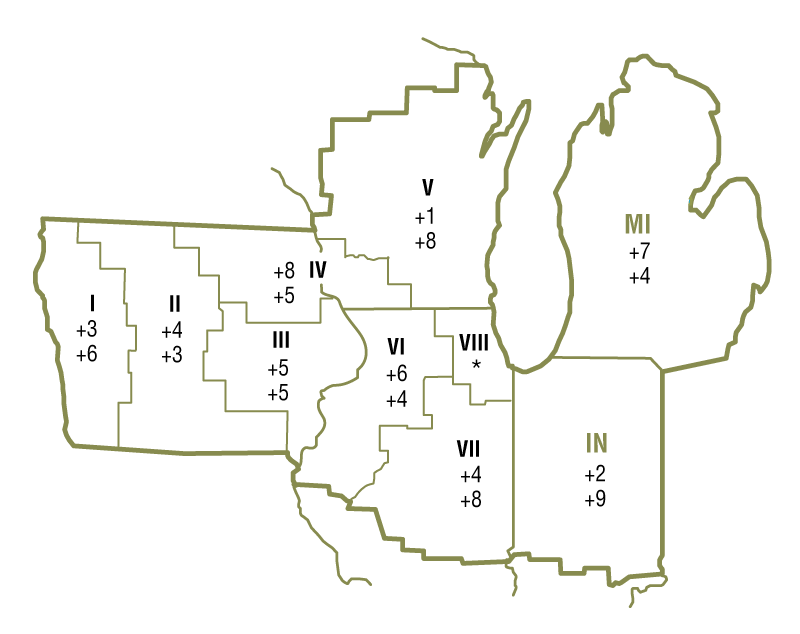
Top: October 1, 2020 to January 1, 2021
Bottom: January 1, 2020 to January 1, 2021
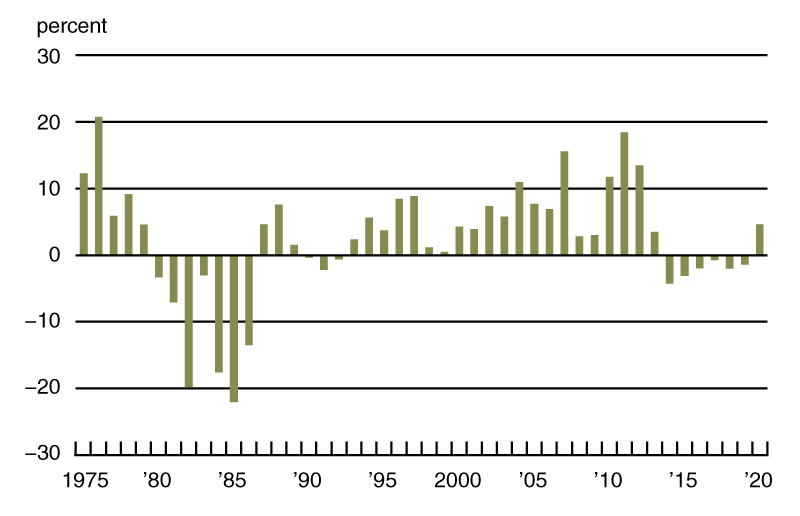
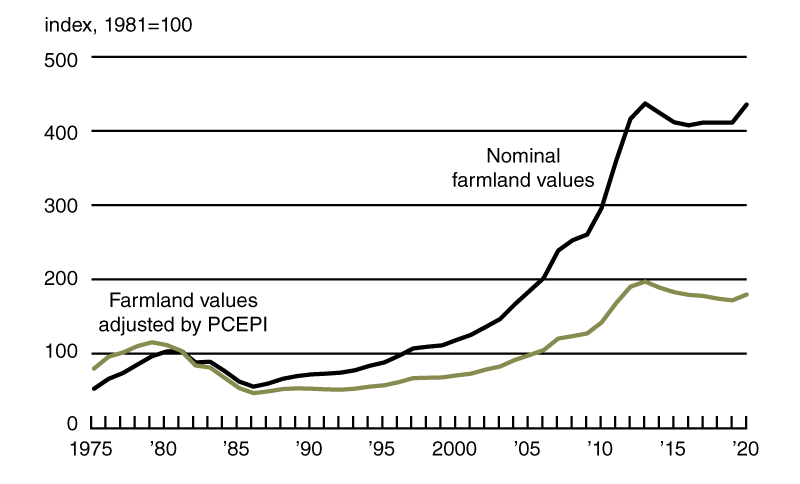
Even with inflation taken into account, District farmland values had an annual increase of almost 5 percent in 2020; this increase in real terms was the first one since 2013 (see chart 1). In both real and nominal terms, District farmland values peaked in 2013. At the end of 2020, District farmland values were still down 9 percent from their peak in real terms, yet they were nearly back to it in nominal terms (see chart 2).
1. Annual real change in Seventh District farmland values
2. Indexes of Seventh District farmland values
In addition to the impetus from lower interest rates, farmland values were boosted by 2020’s rebound in total revenues from corn and soybean production in the five District states. All but one of the states had higher levels of both corn and soybean output in 2020 than in 2019. While most of the District states were spared from extreme weather events in 2020, Iowa was not, so its levels of corn and soybean production were down from a year ago. Based on calculations using U.S. Department of Agriculture (USDA) data, the District states’ corn yield actually dipped to 182 bushels per acre in 2020; this yield was down 0.5 percent from 2019, chiefly because of Iowa’s lower corn output. In contrast, the District states’ soybean yield climbed to 55.5 bushels per acre in 2020—up 5.7 percent from 2019. Given that harvested acres for both crops were 6 percent higher than in 2019, corn and soybean production for the District states increased 5.2 percent and 12 percent, respectively, in 2020. Even so, U.S. crop stocks were drawn down to fulfill demand in 2020 as exports picked up. The USDA projected prices for the 2020–21 crop year of $4.20 per bushel for corn and $11.15 per bushel for soybeans (up 18 percent and 30 percent from the previous crop year, respectively). When calculated with these prices, the estimated revenues from the 2020 harvest for District states would be up 24 percent for corn and 46 percent for soybeans relative to 2019.
There was also a pickup in the trade of livestock products in 2020, which helped offset income losses associated with the pandemic. Livestock prices in general were down in December 2020 from a year earlier. The index of prices for livestock and associated products in December 2020 was 6 percent lower than a year ago (see final table). Yet, according to the USDA, by the end of January 2021, the federal Coronavirus Food Assistance Program (CFAP) had dispersed $5.65 billion to farm operations in the five District states (24 percent of the $23.8 billion sent out nationwide). Of the CFAP payments made to District states, nearly $2.3 billion of them were distributed for the production of livestock and associated products. Given even higher levels of government support and higher prices for some farm products, including corn and soybeans, the USDA forecasted an increase of $38 billion in net farm income for the country in 2020. One Indiana respondent reported: “Crop yields locally were very good. That combined with higher commodity prices now and for [the] 2021 crop will result in most of our customers having a couple of profitable years.”
Credit conditions
District agricultural credit conditions dramatically improved in the fourth quarter of 2020. The share of the District farm loan portfolio deemed to have “major” or “severe” repayment problems was 4.3 percent in the fourth quarter of 2020—lower than the share reported in any final quarter since that of 2014. With 38 percent of survey respondents reporting higher rates of loan repayment and 5 percent reporting lower rates, overall repayment rates for non-real-estate farm loans in the fourth quarter of 2020 were higher than in the same period of the previous year, which had not happened since the third quarter of 2013. At 133 for the final quarter of 2020, the index of non-real-estate farm loan repayment rates was last higher in the first quarter of 2013. Furthermore, non-real-estate farm loan renewals and extensions in the fourth quarter of 2020 were lower than in the fourth quarter of 2019, as only 7 percent of survey respondents reported more of them and 22 percent reported fewer.
As of January 1, 2021, the average interest rates for farm operating loans (4.49 percent), feeder cattle loans (4.66 percent), and agricultural real estate loans (4.10 percent) were at their lowest levels in the history of the survey. While interest rates moved down, the vast majority of banks did not change their credit standards for farm loans. Nineteen percent of the survey respondents reported their banks tightened credit standards for agricultural loans in the fourth quarter of 2020 from a year ago, while 2 percent reported their banks eased them. Similarly, 6 percent of responding bankers noted their banks required larger amounts of collateral for customers to qualify for non-real-estate farm loans during the final quarter of 2020 relative to a year ago, while 1 percent noted their banks required smaller amounts.
Demand for non-real-estate farm borrowing was lower during the October through December period of 2020 relative to the same period of 2019. With 17 percent of survey respondents reporting an increase in the demand for non-real-estate farm loans from a year ago and 26 percent reporting a decrease, the index of loan demand was 91 in the fourth quarter of 2020 (close to its value of 85 in the third quarter). Funds availability was above the level of a year ago for the sixth quarter in a row. In the final quarter of 2020, the index of funds availability moved up to 148 (its highest value since the first quarter of 2013), with funds availability higher than a year ago at 49 percent of the survey respondents’ banks and lower at 1 percent. Moreover, the District’s average loan-to-deposit ratio kept slipping from its peak in the second quarter of 2019; at 73.6 percent for the fourth quarter of 2020, this ratio was 9.3 percentage points below the average level desired by the responding bankers.
Credit conditions at Seventh District agricultural banks
| Interest rates on farm loans | |||||||
| Loan demand | Funds availability | Loan repayment rates | Average loan-to-deposit ratio | Operating loansa | Feeder cattlea | Real estatea | |
|---|---|---|---|---|---|---|---|
| (index)b | (index)b | (index)b | (percent) | (percent) | (percent) | (percent) | |
| 2019 | |||||||
| Jan–Mar | 141 | 86 | 52 | 78.6 | 6.04 | 6.11 | 5.53 |
| Apr–June | 119 | 93 | 74 | 80.2 | 5.98 | 6.14 | 5.39 |
| July–Sept | 115 | 103 | 70 | 78.8 | 5.71 | 5.77 | 5.08 |
| Oct–Dec | 117 | 107 | 79 | 78.9 | 5.49 | 5.61 | 4.97 |
| 2020 | |||||||
| Jan–Mar | 117 | 107 | 59 | 78.9 | 4.83 | 5.01 | 4.51 |
| Apr–June | 103 | 119 | 64 | 77.6 | 4.77 | 4.94 | 4.40 |
| July–Sept | 85 | 131 | 93 | 75.0 | 4.65 | 4.79 | 4.24 |
| Oct–Dec | 91 | 148 | 133 | 73.6 | 4.49 | 4.66 | 4.10 |
bBankers responded to each item by indicating whether conditions in the current quarter were higher or lower than (or the same as) in the year-earlier quarter. The index numbers are computed by subtracting the percentage of bankers who responded “lower” from the percentage who responded “higher” and adding 100.
Note: Historical data on Seventh District agricultural credit conditions are available online.
Looking forward
Survey respondents indicated that at the beginning of 2021, only 1.4 percent of their farm customers with operating credit in the year just past were not likely to qualify for new operating credit in the year ahead—this was an improvement from the percentage reported at the start of 2020. Farm real estate and non-real-estate loan volumes were projected to be larger in the first three months of 2021 compared with the same three months of a year ago. Yet the mix of agricultural loan types was expected to change: Farm machinery and grain storage construction loan volumes were anticipated to increase, while the volume for operating loans was anticipated to be flat. At the start of 2021, survey respondents who forecasted capital expenditures by farmers would be higher in the year ahead compared with the year just ended outnumbered survey respondents who forecasted lower capital expenditures, reversing a trend of the past few years. An Illinois banker stated, “With the surge in commodity prices, I expect increased farmer spending on equipment upgrades.” In addition, responding bankers anticipated higher expenditures by farmers for land purchases and improvements, as well as for buildings and facilities.
For the first time since the first quarter of 2011, a majority of responding bankers (58 percent) predicted farmland values to go up in the next quarter (in this case, the first quarter of 2021). Notably, none of the survey respondents predicted farmland values to go down. The rest of the respondents (42 percent) predicted them to be stable. According to the survey results, the agricultural outlook seemed to be the rosiest in years.
Selected agricultural economic indicators
| Percent change from | |||||
|---|---|---|---|---|---|
| Latest period | Value | Prior period | Year ago | Two years ago | |
| Prices received by farmers (index, 2011=100) | December | 91 | –1.8 | 0 | 1 |
| Crops (index, 2011=100) | December | 92 | –0.5 | 7 | 5 |
| Corn ($ per bu.) | December | 3.97 | 4.7 | 7 | 12 |
| Hay ($ per ton) | December | 155 | –0.6 | –2 | –7 |
| Soybeans ($ per bu.) | December | 10.50 | 1.9 | 21 | 23 |
| Wheat ($ per bu.) | December | 5.43 | 3.6 | 17 | 3 |
| Livestock and products (index, 2011=100) | December | 91 | –3.5 | –6 | –2 |
| Barrows & gilts ($ per cwt.) | December | 49.40 | –5.5 | 4 | 13 |
| Steers & heifers ($ per cwt.) | December | 111.00 | 1.8 | –8 | –7 |
| Milk ($ per cwt.) | December | 18.50 | –13.1 | –11 | 11 |
| Eggs ($ per doz.) | December | 0.73 | –24.7 | –22 | –37 |
| Consumer prices (index, 1982–84=100) | December | 262 | 0.4 | 1 | 4 |
| Food | December | 270 | 0.4 | 4 | 6 |
| Production or stocks | |||||
| Corn stocks (mil. bu.) | December 1 | 11,322 | N.A. | 0 | –5 |
| Soybean stocks (mil. bu.) | December 1 | 2,933 | N.A. | –10 | –22 |
| Wheat stocks (mil. bu.) | December 1 | 1,674 | N.A. | –9 | –17 |
| Beef production (bil. lb.) | December | 2.33 | 2.7 | 3 | 10 |
| Pork production (bil. lb.) | December | 2.51 | 4.3 | 3 | 12 |
| Milk production (bil. lb.) | December | 18.9 | 4.4 | 3 | 4 |
| Agricultural exports ($ mil.) | November | 15,483 | 2.3 | 23 | 28 |
| Corn (mil. bu.) | November | 151 | 3.8 | –25 | –25 |
| Soybeans (mil. bu.) | November | 408 | –3.0 | 128 | 119 |
| Wheat (mil. bu.) | November | 70 | 8.7 | 16 | 10 |
| Farm machinery (units) | |||||
| Tractors, 40 HP or more | December | 9,815 | 88 | 29 | 24 |
| 40 to 100 HP | December | 7,295 | 78 | 33 | 22 |
| 100 HP or more | December | 2,520 | 123 | 18 | 28 |
| Combines | December | 514 | 141 | –2 | –16 |
Sources: Author’s calculations based on data from the U.S. Department of Agriculture, U.S. Bureau of Labor Statistics, and the Association of Equipment Manufacturers.


