

Summary
There was an annual increase of 22 percent in the Seventh Federal Reserve District’s agricultural land values in 2021—the largest such rise over the past decade. In addition, values for “good” farmland in the District gained 7 percent in the fourth quarter of 2021 from the third quarter, according to 147 agricultural bankers who responded to the January survey. Fifty-six percent of the survey respondents expected farmland values to go up during the January through March period of 2022, 1 percent expected them to go down, and 43 percent expected them to remain the same.
District agricultural credit conditions during the fourth quarter of 2021 continued to show signs of improvement. Only 0.8 percent of agricultural borrowers were not likely to qualify for operating credit at the survey respondents’ banks in 2022 after qualifying in the previous year (matching the survey’s record low, reached in 2012). In the final quarter of 2021, repayment rates for non-real-estate farm loans were again higher than a year ago, plus loan renewals and extensions were lower than a year ago. Both of these indicators of farm credit conditions were better than a year earlier in each of the five most recent quarters. That said, non-real-estate farm loan demand relative to a year ago was lower for a sixth consecutive quarter. For ten quarters in a row, there have been more funds available for lending than in the same quarter the prior year at survey respondents’ banks. In line with these trends, the average loan-to-deposit ratio for the District retreated to 67.2 percent in the fourth quarter of 2021—its lowest reading since the first quarter of 2014. At the end of 2021, the District’s average nominal interest rates on farm operating, feeder cattle, and farm real estate loans were still very close to their respective all-time lows; yet real interest rates on them had dropped noticeably into negative territory.
Farmland values
On the whole, the District experienced a very steep annual increase of 22 percent in its farmland values in 2021 (see table and map below). In nominal terms, 2011’s annual increase was the last gain as large as 2021’s. In the fourth quarter of 2021, all District states saw double-digit year-over-year increases in their agricultural land values. The District’s farmland values were up 7 percent in the fourth quarter of 2021 from the third quarter.
Percent change in dollar value of “good” farmland
| October 1, 2021 to January 1, 2022 |
January 1, 2021 to January 1, 2022 |
|
|---|---|---|
| Illinois | +8 | +18 |
| Indiana | +6 | +22 |
| Iowa | +10 | +30 |
| Michigan | +5 | +19 |
| Wisconsin | +4 | +12 |
| Seventh District | +7 | +22 |
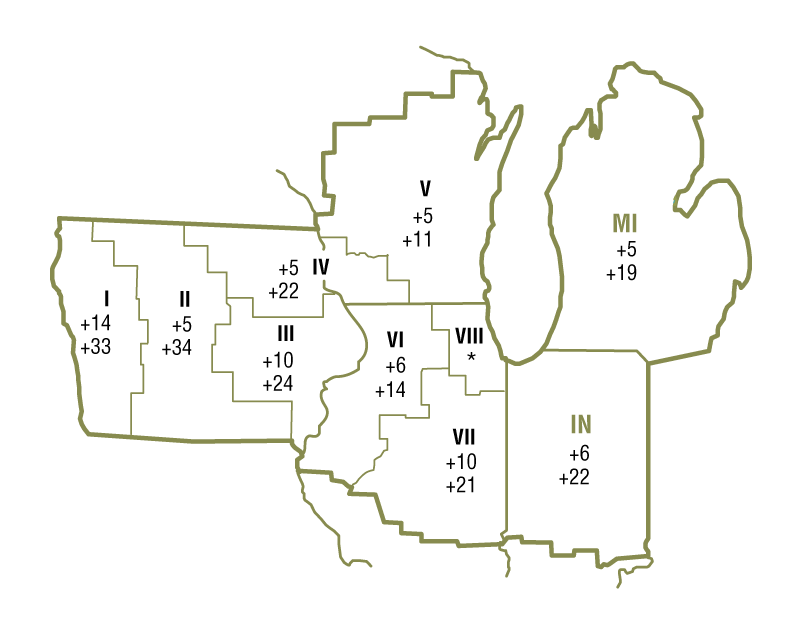
Top: October 1, 2021 to January 1, 2022
Bottom: January 1, 2021 to January 1, 2022
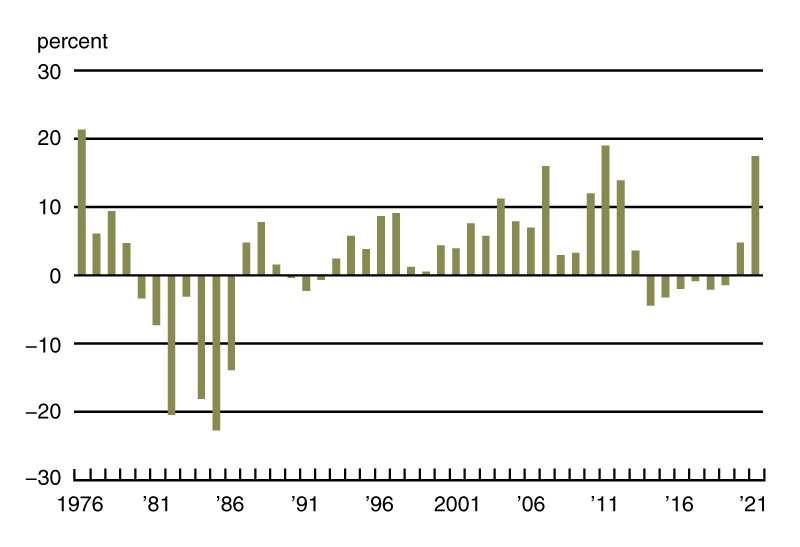
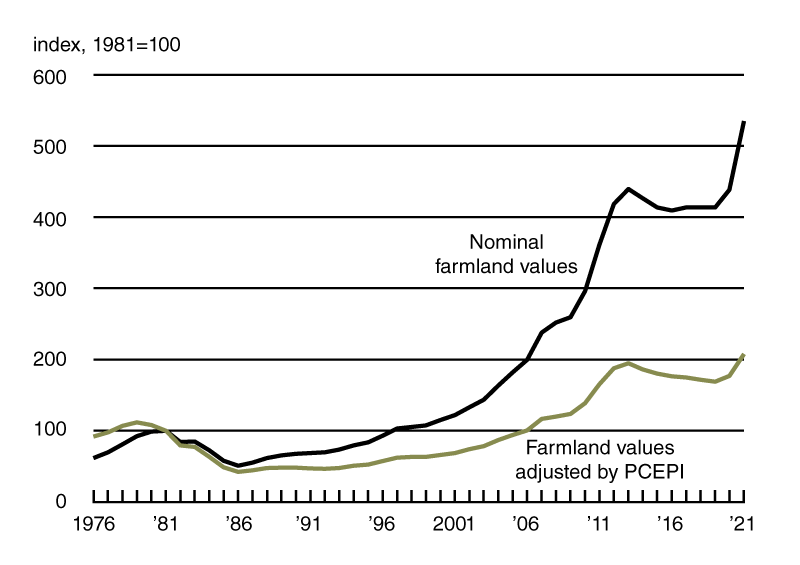
Adjusted for inflation by the Personal Consumption Expenditures Price Index, District farmland values still had an annual increase of 17 percent in 2021, the largest real increase since 2011 (see chart 1). More than making up for their real declines from 2014 through 2019, District farmland values reached a new peak in 2021. At the end of 2021, District farmland values were up nearly 7 percent from their prior peak (in 2013) in real terms; they were up even more (about 22 percent) in nominal terms after almost fully recovering to their previous peak (also in 2013) by the end of 2020 (see chart 2).
1. Annual real change in Seventh District farmland values
2. Indexes of Seventh District farmland values
Besides receiving assistance from lower real interest rates and additional government funds, District farmland values were helped by another jump in corn and soybean revenues. Revenues for these crops were up not only because of production growth in the five District states, but also because of higher crop prices. All District states had higher yields for both corn and soybeans in 2021 than in 2020, even with drought across a substantial portion of the District. Based on calculations using U.S. Department of Agriculture (USDA) data, the District states’ corn yield rose 9.4 percent from 2020 to a record 198 bushels per acre in 2021. Similarly, the District states’ soybean yield increased 8.0 percent from 2020 to a record 61 bushels per acre in 2021. Harvested corn acres were down 1.7 percent from 2020, but harvested soybean acres were up 2.9 percent. In 2021, corn and soybean production for the District states increased 7.6 percent and 11 percent, respectively. Although U.S. corn and soybean stocks were somewhat higher in December 2021 than a year ago (see final table), the USDA in January projected prices for the 2021–22 crop year of $5.45 per bushel for corn (up 20 percent from the previous crop year) and $12.60 per bushel for soybeans (up 17 percent). When calculated with these prices, the estimated revenues from the 2021 harvests for District states would be up 29 percent for corn and 30 percent for soybeans relative to 2020 levels.
Moreover, prices for key livestock products were uniformly up by the end of 2021. In December 2021, prices for hogs, cattle, milk, and eggs were up 14 percent, 27 percent, 19 percent, and 86 percent from a year earlier, respectively (see final table). Also, the index of prices for livestock and associated products in December 2021 was 33 percent above its level of a year ago. While livestock prices moved up, aid to the District from the federal Coronavirus Food Assistance Program (CFAP) was winding down during the final quarter of 2021, according to USDA data. By the end of January 2022, farm operations in the five District states had received around $1.5 billion from CFAP over the past year, with little coming in the fourth quarter of 2021. (Overall, District states got 23.3 percent of the $30.8 billion distributed nationwide by CFAP.) Propelled by higher receipts for both crop and livestock products, net farm income swelled by $24 billion for the nation in 2021, based on the USDA’s February forecast. This surge in agricultural income provided momentum for the rapid rise of District farmland values in 2021.
Credit conditions
Improving agricultural credit conditions for the District also played an important role in 2021’s striking gains in farmland values. In particular, negative real interest rates seemed to spur demand to purchase agricultural ground. Still, as of January 1, 2022, the average nominal interest rates for farm operating loans, feeder cattle loans, and agricultural real estate loans stood at 4.34 percent, 4.53 percent, and 4.03 percent, respectively—little changed from their historic lows (reached on October 1, 2021). Furthermore, better repayment prospects for agricultural loans contributed to a healthier lending environment. The share of the District farm loan portfolio assessed as having “major” or “severe” repayment problems was 2.1 percent in the fourth quarter of 2021—lower than the share reported in any final quarter since that of 2012. With 55 percent of survey respondents reporting higher rates of loan repayment than a year ago and only 2 percent reporting lower rates, the index of non-real-estate farm loan repayment rates was 153 in the fourth quarter of 2021—last higher in the first quarter of 2012. Moreover, non-real-estate farm loan renewals and extensions in the final quarter of 2021 were lower than in the final quarter of 2020, as just 3 percent of survey respondents reported more of them and 30 percent reported fewer.
Even though loan problems receded, 90 percent of survey respondents’ banks kept their credit standards for farm loans essentially the same in the fourth quarter of 2021 as a year ago—with roughly an even split of the rest between tightening and easing credit standards. Likewise, 99 percent of responding bankers noted their banks did not change the amounts of collateral required for customers to qualify for non-real-estate farm loans during the final quarter of 2021 relative to a year ago, though 1 percent noted their banks required smaller amounts.
During the October through December period of 2021, demand for non-real-estate farm borrowing was once again lower relative to the same period of a year ago: With 22 percent of survey respondents reporting an increase in the demand for non-real-estate farm loans from a year earlier and 46 percent reporting a decrease, the index of loan demand was 76 in the fourth quarter of 2021. At 152 in the final quarter of 2021, the index of funds availability indicated once more a higher level of funds available for lending than a year ago; funds availability was higher than a year earlier at 54 percent of the survey respondents’ banks and lower at 2 percent. The District’s average loan-to-deposit ratio dipped to 67.2 percent in the fourth quarter of 2021; this ratio was 14 percentage points below the average level desired by the responding bankers. An Indiana banker remarked: “Lack of operating loan demand is a bigger concern to our bank than credit quality at this point.”
Credit conditions at Seventh District agricultural banks
| Interest rates on farm loans | |||||||
| Loan demand | Funds availability | Loan repayment rates | Average loan-to-deposit ratio | Operating loansa | Feeder cattlea | Real estatea | |
|---|---|---|---|---|---|---|---|
| (index)b | (index)b | (index)b | (percent) | (percent) | (percent) | (percent) | |
| 2020 | |||||||
| Jan–Mar | 117 | 107 | 59 | 78.9 | 4.83 | 5.01 | 4.51 |
| Apr–June | 103 | 119 | 64 | 77.6 | 4.77 | 4.94 | 4.40 |
| July–Sept | 85 | 131 | 93 | 75.0 | 4.65 | 4.79 | 4.24 |
| Oct–Dec | 91 | 148 | 133 | 73.6 | 4.49 | 4.66 | 4.10 |
| 2021 | |||||||
| Jan–Mar | 79 | 162 | 146 | 69.7 | 4.42 | 4.58 | 4.08 |
| Apr–June | 63 | 160 | 146 | 67.5 | 4.40 | 4.55 | 4.02 |
| July–Sept | 78 | 161 | 143 | 68.8 | 4.34 | 4.51 | 4.01 |
| Oct–Dec | 76 | 152 | 153 | 67.2 | 4.34 | 4.53 | 4.03 |
b Bankers responded to each item by indicating whether conditions in the current quarter were higher or lower than (or the same as) in the year-earlier quarter. The index numbers are computed by subtracting the percentage of bankers who responded “lower” from the percentage who responded “higher” and adding 100.
Note: Historical data on Seventh District agricultural credit conditions are available online.
Looking forward
According to survey respondents at the beginning of 2022, only 0.8 percent of their farm customers with operating credit in the year just past were not likely to qualify for new operating credit in the year ahead. Farm real estate loan volumes were projected to be larger in the first three months of 2022 compared with the same three months of a year ago, while non-real-estate loan volumes were projected to be smaller (except for farm machinery loan volumes). At the start of 2022, survey respondents once again forecasted capital expenditures by farmers would be higher in the year ahead than in the year just ended (similar to their prediction in early 2021).
For the fifth quarter in a row, a majority of responding bankers (56 percent) predicted farmland values to go up in the next quarter (in this case, the first quarter of 2022). Just 1 percent of the survey respondents predicted farmland values to go down; 43 percent of the respondents predicted them to be stable. One Illinois banker cautioned: “Farmers were able to realize nice profits in 2021; 2022 could be much more difficult to do so with the rise in the costs of all inputs.”
Selected agricultural economic indicators
| Percent change from | |||||
|---|---|---|---|---|---|
| Latest period | Value | Prior period | Year ago | Two years ago | |
| Prices received by farmers (index, 2011=100) | December | 113 | 3.5 | 24 | 24 |
| Crops (index, 2011=100) | December | 106 | –1.3 | 16 | 23 |
| Corn ($ per bu.) | December | 5.47 | 3.8 | 41 | 47 |
| Hay ($ per ton) | December | 187.00 | 0.0 | 23 | 18 |
| Soybeans ($ per bu.) | December | 12.50 | 2.5 | 18 | 44 |
| Wheat ($ per bu.) | December | 8.58 | 0.8 | 57 | 85 |
| Livestock and products (index, 2011=100) | December | 121 | 9.0 | 33 | 24 |
| Barrows & gilts ($ per cwt.) | December | 56.20 | –3.4 | 14 | 18 |
| Steers & heifers ($ per cwt.) | December | 141.00 | 6.8 | 27 | 18 |
| Milk ($ per cwt.) | December | 21.80 | 4.8 | 19 | 5 |
| Eggs ($ per doz.) | December | 1.36 | 24.8 | 86 | 46 |
| Consumer prices (index, 1982–84=100) | December | 279 | 0.3 | 7 | 8 |
| Food | December | 287 | 0.5 | 6 | 10 |
| Production or stocks | |||||
| Corn stocks (mil. bu.) | December 1 | 11,647 | N.A. | 3 | 3 |
| Soybean stocks (mil. bu.) | December 1 | 3,149 | N.A. | 7 | –3 |
| Wheat stocks (mil. bu.) | December 1 | 1,390 | N.A. | –18 | –24 |
| Beef production (bil. lb.) | December | 2.36 | –0.7 | 2 | 4 |
| Pork production (bil. lb.) | December | 2.40 | –0.2 | –4 | –2 |
| Milk production (bil. lb.) | December | 18.8 | 4.4 | –1 | 2 |
| Agricultural exports ($ mil.) | November | 18,481 | 5.0 | 17 | 43 |
| Corn (mil. bu.) | November | 182 | 21.1 | 21 | –9 |
| Soybeans (mil. bu.) | November | 391 | 1.2 | –4 | 118 |
| Wheat (mil. bu.) | November | 52 | 17.1 | –25 | –13 |
| Farm machinery (units) | |||||
| Tractors, 40 HP or more | December | 10,318 | 76 | 6 | 35 |
| 40 to 100 HP | December | 7,061 | 57 | –3 | 29 |
| 100 HP or more | December | 3,257 | 139 | 30 | 52 |
| Combines | December | 633 | 120 | 25 | 21 |
Sources: Author’s calculations based on data from the U.S. Department of Agriculture, U.S. Bureau of Labor Statistics, and the Association of Equipment Manufacturers.


