

Summary
Agricultural land values for the Seventh Federal Reserve District edged up 1 percent in the first quarter of 2020 from a year ago, despite challenges to the farm sector related to Covid-19. Overall, there was no change in “good” farmland values from the fourth quarter of 2019 to the first quarter of 2020, according to the survey responses of 113 District agricultural bankers. The survey responses covered farm sector activity in the entire first quarter of 2020, most of which occurred before the proclamation that Covid-19 represented a national emergency in the U.S. Annual cash rental rates for District farmland were down for the seventh consecutive year in 2020. The amount of farmland for sale in the three- to six-month period ending with March 2020 was roughly equal to that in the same period ending with March 2019. Yet, the number of farms sold and the amount of acreage sold were somewhat lower during the winter and early spring of 2020 compared with a year earlier, as demand to purchase agricultural land seemed to ebb a bit. Just over half of the responding bankers expected District farmland values to be stable during the second quarter of 2020, while the rest expected agricultural land values to decrease.
With the prices of most farm products dropping as the quarter ended, it’s not much of a surprise that key measures of District agricultural credit conditions deteriorated during the first quarter of 2020. Once again, repayment rates for non-real-estate farm loans were lower than a year ago, plus renewals and extensions of these loans were higher. Demand for non-real-estate loans in the first quarter of 2020 grew from a year ago. Both the amount of collateral required and the availability of funds to lend were also higher than a year earlier. At 78.9 percent, the average loan-to-deposit ratio in the first quarter of 2020 was unchanged from the previous quarter. Average interest rates on farm loans fell over the first quarter of 2020 from their levels at the end of the fourth quarter of 2019.
Farmland values
District agricultural land values were 1 percent higher in the first quarter of 2020 than in the first quarter of 2019, though they were unchanged from the fourth quarter of 2019 (see table and map below). Illinois, Indiana, and Iowa saw year-over-year increases in farmland values, while Wisconsin saw a decrease. Moreover, Wisconsin experienced a quarterly decline in farmland values. After being adjusted for inflation with the Personal Consumption Expenditures Price Index (PCEPI), District agricultural land values moved down on a year-over-year basis for the 23rd consecutive quarter in the first quarter of 2020; however, this decrease was the smallest one since 2017.
Percent change in dollar value of “good” farmland
| January 1, 2020 to April 1, 2020 |
April 1, 2019 to Arpil 1, 2020 |
|
|---|---|---|
| Illinois | +1 | +1 |
| Indiana | +3 | +4 |
| Iowa | 0 | +2 |
| Michigan | * | * |
| Wisconsin | –4 | –3 |
| Seventh District | 0 | +1 |
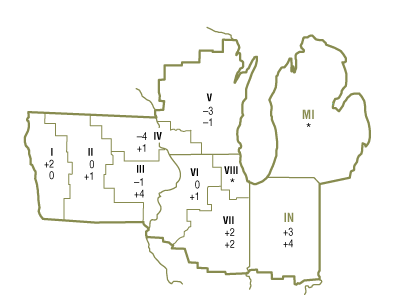
Top: January 1, 2020 to April 1, 2020
Bottom: April 1, 2019 to April 1, 2020
Considering the survey results showed softer demand for agricultural ground, District farmland values were fairly steady. For the three- to six-month period ending with March 2020 relative to the same period ending with March 2019, 5 percent of the survey respondents reported higher demand to purchase farmland and 34 percent reported lower demand. So, the majority supported the view that demand for farmland had not diminished. For instance, a banker from Wisconsin viewed “demand as still strong for farmland, despite all the external forces in play.” Also, an Illinois banker reported that “land values and demand remain strong, with little turnover.” There was about the same amount of agricultural land for sale during the most recent winter and early spring relative to a year ago, as 28 percent of the responding bankers reported more farmland was up for sale in their areas and 24 percent reported less. The number of farms and the amount of acreage sold were down some in the winter and early spring compared with a year earlier. The survey participants also indicated that the share of acres purchased by farmers shrank, while the share of acres purchased by investors expanded in the three- to six-month period ending with March 2020 relative to the corresponding period ending with March 2019.
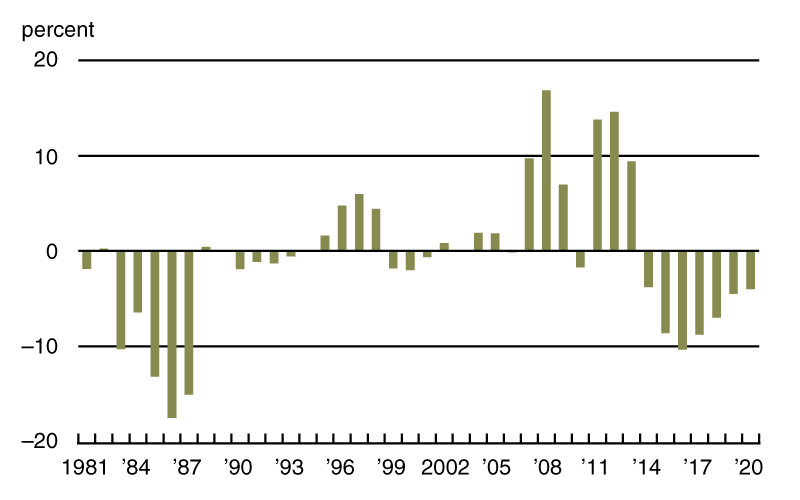
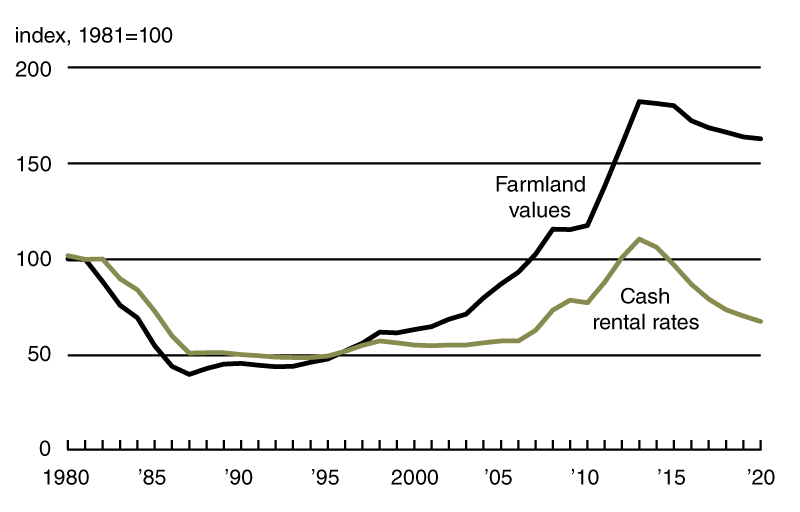
There was a 2 percent decrease in cash rental rates for District agricultural ground from 2019 to 2020. For 2020, average annual cash rents for farmland were down 3 percent in Illinois, 3 percent in Iowa, and 4 percent in Wisconsin; such rents were unchanged in Indiana (and not enough survey responses were received from bankers in Michigan to report a numerical change for that state). After being adjusted for inflation with the PCEPI, District cash rental rates dipped 4 percent from 2019 (see chart 1). This was the seventh straight year of declining cash rents (in both nominal and real terms)—extending the longest such downturn since 1981 (when the survey started to track cash rents). Even though the current streak of decreasing real cash rental rates is the longest one on record in the survey, the District’s index of inflation-adjusted cash rental rates fell by more in percentage terms during the 1980s (see chart 2). The index of real cash rents was reduced by almost 50 percent from 1982 to 1987. In nominal and real terms, both the index of farmland cash rental rates and the index of agricultural land values peaked in 2013. As of 2020, the index of real cash rents had fallen 39 percent below its level in 2013, reaching its lowest level since 2007; the index of real farmland values had fallen only 11 percent from its 2013 peak (and was last lower in 2012).
1. Annual percentage change in Seventh District farmland cash rental rates adjusted by PCEPI
2. Indexes of Seventh District farmland adjusted by PCEPI
Sources: Author’s calculations based on data from Federal Reserve Bank of Chicago surveys of farmland values; and U.S. Bureau of Economic Analysis, Personal Consumption Expenditures Price Index (PCEPI), from Haver Analytics.
Credit conditions
The overall decline in agricultural credit conditions for the District deepened in the first quarter of 2020 after showing some signs of improvement in the fourth quarter of 2019. As one Indiana banker noted, “The impact of Covid-19 has created significant price deterioration for all commodities, and at this point we do not know what the recovery time frame will be.” Under these circumstances, the index of repayment rates for non-real-estate farm loans dropped to 59 (the lowest reading since a year ago), with 1 percent of responding bankers observing higher rates of repayment and 42 percent observing lower rates for the first quarter of 2020 relative to the first quarter of 2019. In addition, 48 percent of the survey respondents reported higher levels of loan renewals and extensions over the January through March period of 2020 compared with the same period last year, while none reported lower levels of them. At the same time, bankers reported that just under 20 percent, on average, of their farm borrowers had more carryover debt (loans not paid off at the end of the growing season and subsequently carried over into the next one) in 2020 than in 2019. Furthermore, credit tightening continued in the first quarter of 2020; for instance, 17 percent of survey respondents noted that their banks required larger amounts of collateral for loans during the January through March period of 2020 relative to the same period of 2019, while none noted that their banks required smaller amounts. The share of loans guaranteed by the U.S. Department of Agriculture’s Farm Service Agency (FSA) in the portfolios of the reporting banks was 6 percent for the District as a whole—similar to the level of a year ago. (FSA guarantees help some less creditworthy farmers qualify for loans.) Among District states, Wisconsin had the highest share of such loans in its banks’ portfolios (11 percent)—which is indicative of the tough realities endured by dairies.
At 117, the index of demand for non-real-estate farm loans was unchanged in the first quarter of 2020 from the previous quarter; for the January through March period of 2020, 36 percent of the responding bankers noted higher loan demand compared with a year ago, and 19 percent noted lower demand. With a reading of 107, the index of funds availability indicated an improvement in funding levels from a year ago; 14 percent of the survey respondents reported their banks had more funds available to lend, and 7 percent reported their banks had less. At 78.9 percent in the first quarter of 2020, the average loan-to-deposit ratio for the District was 3.7 percentage points below the average level desired by the survey respondents. As of April 1, 2020, the average nominal interest rates on operating loans (4.83 percent), agricultural real estate loans (4.51 percent), and feeder cattle loans (5.01 percent) were all much lower than at the end of the fourth quarter of 2019. Moreover, the average nominal rate for farm real estate loans hit a record low for the survey. After being adjusted for inflation using the PCEPI, the three average agricultural interest rates were all at their lowest levels since the end of the first quarter of 2017.
Credit conditions at Seventh District agricultural banks
| Interest rates on farm loans | |||||||
| Loan demand | Funds availability | Loan repayment rates | Average loan-to-deposit ratio |
Operating loansa | Feeder cattlea | Real estatea | |
|---|---|---|---|---|---|---|---|
| (index)b | (index)b | (index)b | (percent) | (percent) | (percent) | (percent) | |
| 2019 | |||||||
| Jan–Mar | 141 | 86 | 52 | 78.6 | 6.04 | 6.11 | 5.53 |
| Apr–June | 119 | 93 | 74 | 80.2 | 5.98 | 6.14 | 5.39 |
| July–Sept | 115 | 103 | 70 | 78.8 | 5.71 | 5.77 | 5.08 |
| Oct–Dec | 117 | 107 | 79 | 78.9 | 5.49 | 5.61 | 4.97 |
| 2020 | |||||||
| Jan–Mar | 117 | 107 | 59 | 78.9 | 4.83 | 5.01 | 4.51 |
bBankers responded to each item by indicating whether conditions in the current quarter were higher or lower than (or the same as) in the year-earlier quarter. The index numbers are computed by subtracting the percentage of bankers who responded “lower” from the percentage who responded “higher” and adding 100.
Note: Historical data on Seventh District agricultural credit conditions are available online.
Looking forward
By the end of the first quarter of 2020, the District’s farm sector had already been dealing with the implications of the Covid-19 pandemic for a few weeks. A banker from Indiana was “very concerned with the disruption in livestock marketing and ethanol from the pandemic shutdown.” A Wisconsin banker voiced concerns “about the impact on land values due to Covid-19.” Nearly as many of the survey respondents anticipated agricultural land values to decrease in the second quarter of 2020 as to be unchanged: 48 percent of responding bankers expected farmland values to fall, and 52 percent expected them to be stable (none expected them to rise). Survey respondents projected that the overall volume of non-real-estate farm loans would increase in the District during the April through June period of 2020 relative to the same period of 2019, while the overall volume of farm real estate loans was forecasted to decrease. The generally low commodity prices and extreme weather events of 2019 were challenging enough for the farm sector, but 2020 has been shaping up to be even more difficult, given the severe impacts of the Covid-19 pandemic and its unknown duration.
Selected agricultural economic indicators
| Percent change from | |||||
|---|---|---|---|---|---|
| Latest period | Value | Prior period | Year ago | Two years ago | |
| Prices received by farmers (index, 2011=100) | March | 93 | 3.1 | 0 | –2 |
| Crops (index, 2011=100) | March | 89 | 3.1 | 1 | 1 |
| Corn ($ per bu.) | March | 3.68 | –2.6 | 2 | 5 |
| Hay ($ per ton) | March | 158 | 0.6 | –9 | 7 |
| Soybeans ($ per bu.) | March | 8.46 | –1.5 | –1 | –14 |
| Wheat ($ per bu.) | March | 4.86 | –0.4 | –6 | –5 |
| Livestock and products (index, 2011=100) | March | 97 | 2.9 | –1 | –2 |
| Barrows & gilts ($ per cwt.) | March | 48.30 | 4.3 | 4 | –3 |
| Steers & heifers ($ per cwt.) | March | 114.00 | –6.6 | –12 | –10 |
| Milk ($ per cwt.) | March | 18.00 | –4.8 | 2 | 15 |
| Eggs ($ per doz.) | March | 0.89 | 18.6 | 3 | –56 |
| Consumer prices (index, 1982–84=100) | March | 258 | –0.4 | 2 | 3 |
| Food | March | 263 | 0.3 | 2 | 4 |
| Production or stocks | |||||
| Corn stocks (mil. bu.) | March 1 | 7,953 | N.A. | –8 | –11 |
| Soybean stocks (mil. bu.) | March 1 | 2,253 | N.A. | –17 | 7 |
| Wheat stocks (mil. bu.) | March 1 | 1,412 | N.A. | –11 | –6 |
| Beef production (bil. lb.) | March | 2.41 | 13.1 | 14 | 9 |
| Pork production (bil. lb.) | March | 2.57 | 11.3 | 12 | 12 |
| Milk production (bil. lb.) | March | 19.3 | 7.8 | 3 | 2 |
| Agricultural exports ($ mil.) | March | 11,885 | 5.1 | –1 | –7 |
| Corn (mil. bu.) | March | 182 | 17.8 | –3 | –29 |
| Soybeans (mil. bu.) | March | 95 | –6.8 | –31 | –21 |
| Wheat (mil. bu.) | March | 67 | –16.4 | –7 | –14 |
| Farm machinery (units) | |||||
| Tractors, 40 HP or more | March | 5,514 | 33.4 | –16 | –17 |
| 40 to 100 HP | March | 4,024 | 35.0 | –15 | –18 |
| 100 HP or more | March | 1,490 | 32.7 | –18 | –14 |
| Combines | March | 362 | 50.8 | –12 | 51 |
Sources: Author’s calculations based on data from the U.S. Department of Agriculture, U.S. Bureau of Labor Statistics, and the Association of Equipment Manufacturers.


