

Summary
Agricultural land values for the Seventh Federal Reserve District shot up 23 percent in the first quarter of 2022 from a year ago, continuing the recent streak of sharp year-over-year gains. Furthermore, “good” farmland values in the District increased 4 percent from the fourth quarter of 2021 to the first quarter of 2022, according to the survey responses of 136 District agricultural bankers. Annual cash rental rates for District farmland rose 11 percent in 2022, surpassing last year’s gain of 4 percent. With demand to purchase agricultural land up yet again this year, there was a larger amount of farmland for sale in the three- to six-month period ending with March 2022 than in the same period ending with March 2021. In addition, the number of farms and the amount of acreage sold were up during the winter and early spring of 2022 compared with a year earlier. Given these upward trends, 48 percent of the responding bankers forecasted District farmland values to be higher during the second quarter of 2022, 51 percent forecasted them to be stable, and only 1 percent forecasted them to be lower.
Agricultural credit conditions improved in the District during the first quarter of 2022. Repayment rates for non-real-estate farm loans were higher in the January through March period of 2022 compared with a year ago, and the renewals and extensions of these loans were lower. The availability of funds for agricultural borrowing in the first quarter of 2022 expanded from a year earlier, whereas demand for non-real-estate loans contracted. At 65.0 percent, the average loan-to-deposit ratio in the first quarter of 2022 was at its lowest level since the second quarter of 2013. On net, the amount of collateral required by banks across the District changed very little from a year ago. Although average nominal interest rates on farm loans moved up to end the first quarter of 2022 at their highest levels since 2020, average farm interest rates moved down in real terms.
Farmland values
The District saw a year-over-year gain of 23 percent in its farmland values in the first quarter of 2022—which just exceeded the previous quarter’s large year-over-year gain. Farmland values rose 4 percent in the first quarter of 2022 from the fourth quarter of 2021 (see table and map below). Even after being adjusted for inflation with the Personal Consumption Expenditures Price Index (PCEPI), the year-over-year gain in District farmland values for the first quarter of 2022 was higher than that for any quarter since the first one of 2012 (the gain for the first quarter of 2022 also marked the eighth consecutive quarter of positive changes in real terms).
Percent change in dollar value of “good” farmland
|
January 1, 2022 to April 1, 2022 |
April 1, 2021 to April 1, 2022 |
|
|---|---|---|
| Illinois | +4 | +18 |
| Indiana | +8 | +23 |
| Iowa | +3 | +28 |
| Michigan | * | * |
| Wisconsin | +4 | +13 |
| Seventh District | +4 | +23 |
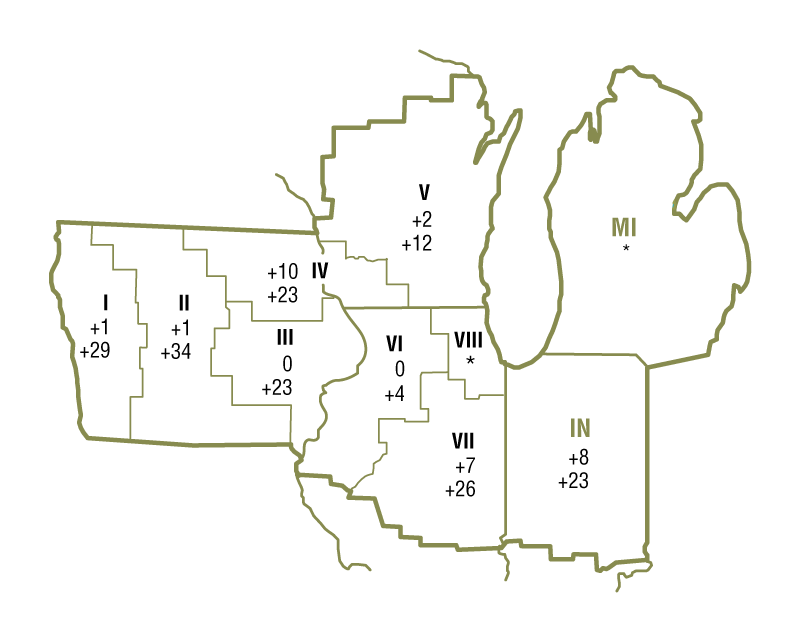
Top: January 1, 2022 to April 1, 2022
Bottom: April 1, 2021 to April 1, 2022
Continued robust increases in District agricultural land values partly reflected the vigorous demand for agricultural land. According to an Illinois banker, there was “high demand for quality farmland.” For the three- to six-month period ending with March 2022 relative to the same period ending with March 2021, 78 percent of the survey respondents reported higher demand to purchase farmland and just 1 percent reported lower demand. Sustained strong demand for agricultural ground and higher transaction prices seemed to induce selling; there was a larger amount of land for sale during the most recent winter and early spring relative to a year ago (48 percent of the responding bankers reported more farmland was up for sale in their areas and 16 percent reported less). Similarly, the number of farms and the amount of acreage sold were also up in the winter and early spring compared with a year earlier. Survey participants implied that the share of acres purchased by investors expanded in the three- to six-month period ending with March 2022 relative to the corresponding period ending with March 2021, given that the share of acres purchased by farmers contracted. In this vein, an Iowa banker reported “a notable increase in investor activity in our area.”
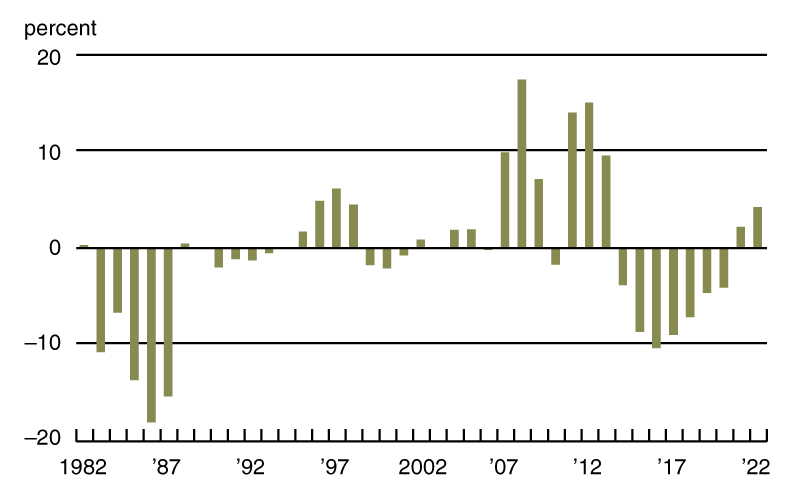
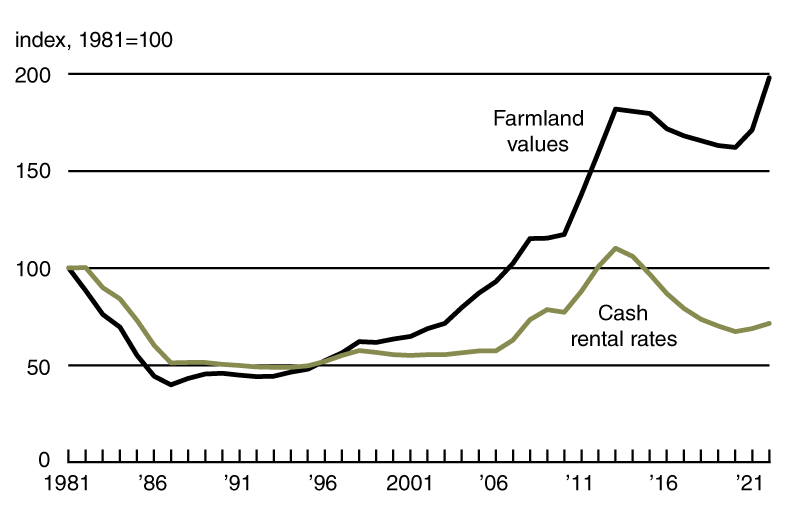
Cash rental rates for District farm acres increased 11 percent from 2021 to 2022. For 2022, average annual cash rents for farmland were up 10 percent in Illinois, 11 percent in Indiana, 12 percent in Iowa, and 8 percent in Wisconsin (not enough survey responses were received from bankers in Michigan to report a numerical change for that state). After being adjusted for inflation with the PCEPI, District cash rental rates moved up about 4 percent from 2021 (see chart 1). This was just the second increase in cash rents (both in nominal and real terms) since 2013. In real terms, the index of farmland cash rental rates peaked in 2013 (see chart 2). Even after rising again in 2022, the index of real cash rental rates was still 35 percent below its level in 2013. That said, in the first quarter of 2022, the index of real farmland values moved 9 percent above its 2013 peak (again, see chart 2). The widening gap between these two indexes over the past decade could be indicative that the demand to own farmland has outpaced the demand to rent ground. A contributing factor to this trend could be an increasing importance placed on farmland ownership’s benefits, such as relative control and wealth accumulation.
1. Annual percentage change in Seventh District farmland cash rental rates adjusted by PCEPI
2. Indexes of Seventh District farmland adjusted by PCEPI
Sources: Author’s calculations based on data from Federal Reserve Bank of Chicago surveys of farmland values; and U.S. Bureau of Economic Analysis, Personal Consumption Expenditures Price Index (PCEPI), from Haver Analytics.
Farmland values and cash rents have risen partly because of elevated farm earnings. Many agricultural prices were propelled higher by world events (for instance, droughts in South America and parts of the U.S., as well as the war in Ukraine). In March 2022, prices received by farmers were up 31 percent from a year ago, according to data from the U.S. Department of Agriculture (USDA) (see final table). Prices for livestock and associated products were up 39 percent in March 2022 from a year ago, and crop prices were up 22 percent. Despite rising input costs and the ebbing of federal pandemic relief, these large increases in agricultural prices helped raise the farm sector’s overall income, which in turn helped boost farmland values and cash rents.
Credit conditions
Agricultural credit conditions for the District improved once more in the first quarter of 2022. As of April 1, 2022, the average nominal interest rates on operating loans (4.64 percent), feeder cattle loans (4.74 percent), and agricultural real estate loans (4.44 percent) were higher than at any time since 2020. Yet, after being adjusted for inflation using the PCEPI, average agricultural interest rates decreased for the seventh quarter in a row. In real terms, average interest rates for farm real estate and feeder cattle loans were last lower at the end of the fourth quarter of 1974; the average real interest rate for farm operating loans—tracked by the survey since the third quarter of 1975—was at its lowest ever.
Moreover, the index of repayment rates for non-real-estate farm loans (159) reached the highest level in its history going back to 1970; 59 percent of responding bankers observed higher rates of repayment for the first quarter of 2022 relative to the first quarter of 2021, and none observed lower rates. Also, only 3 percent of the survey respondents reported higher levels of loan renewals and extensions over the January through March period of 2022 compared with the same period last year, while 32 percent reported lower levels of them. In addition, bankers reported that only 1 percent, on average, of their farm borrowers had more carryover debt (loans not paid off at the end of the growing season and subsequently carried over into the next one) in 2022 than in 2021. The share of loans guaranteed by the USDA’s Farm Service Agency (FSA) in the portfolios of the reporting banks was just above 6 percent for the District as a whole—about the same level as in the past couple of years.
At 83, the index of demand for non-real-estate farm loans moved up a bit in the first quarter of 2022 from the previous quarter; for the January through March period of 2022, 20 percent of the responding bankers noted higher loan demand compared with a year ago, and 37 percent noted lower demand. The index of funds availability decreased to 148—its lowest level since the fourth quarter of 2020; 51 percent of the survey respondents reported their banks had more funds available to lend, and 3 percent reported their banks had less. At its lowest level in nearly nine years, the average loan-to-deposit ratio for the District dropped to 65.0 percent in the first quarter of 2022—15 percentage points below the average level desired by the survey respondents.
Credit conditions at Seventh District agricultural banks
| Interest rates on farm loans | |||||||
| Loan demand | Funds availability | Loan repayment rates | Average loan-to-deposit ratio | Operating loansa | Feeder cattlea | Real estatea | |
|---|---|---|---|---|---|---|---|
| (index)b | (index)b | (index)b | (percent) | (percent) | (percent) | (percent) | |
| 2021 | |||||||
| Jan–Mar | 79 | 162 | 146 | 69.7 | 4.42 | 4.58 | 4.08 |
| Apr–June | 63 | 160 | 146 | 67.5 | 4.40 | 4.55 | 4.02 |
| July–Sept | 78 | 161 | 143 | 68.8 | 4.34 | 4.51 | 4.01 |
| Oct–Dec | 76 | 152 | 153 | 67.2 | 4.34 | 4.53 | 4.03 |
| 2022 | |||||||
| Jan–Mar | 83 | 148 | 159 | 65.0 | 4.64 | 4.74 | 4.44 |
b Bankers responded to each item by indicating whether conditions in the current quarter were higher or lower than (or the same as) in the year-earlier quarter. The index numbers are computed by subtracting the percentage of bankers who responded “lower” from the percentage who responded “higher” and adding 100.
Note: Historical data on Seventh District agricultural credit conditions are available online.
Looking forward
Survey respondents forecasted that the volume of farm real estate loans would rise in the District during the April through June period of 2022 relative to the same period of 2021, but they forecasted that the overall volume of non-real-estate farm loans would decline. The volumes of some non-real-estate agricultural loan types (farm machinery and grain storage construction loans) were expected to be largely unchanged from a year ago, but the volumes of others (operating, FSA-guaranteed, dairy, and feeder cattle loans) were expected to decrease.
Around three-quarters of survey respondents in Illinois, Indiana, and Iowa were of the view that agricultural ground was overvalued, yet the majority of respondents in Michigan and Wisconsin were not. None of the respondents viewed farmland as undervalued. Looking ahead to the second quarter of 2022, 48 percent of survey respondents anticipated farmland values to rise, 51 percent anticipated them to be stable, and 1 percent anticipated them to fall. Another Illinois banker stated: “If commodity prices soften and interest rates continue to increase, a decline in real estate values would be anticipated.”
Selected agricultural economic indicators
| Percent change from | |||||
|---|---|---|---|---|---|
| Latest period | Value | Prior period | Year ago | Two years ago | |
| Prices received by farmers (index, 2011=100) | March | 127 | 6.3 | 31 | 38 |
| Crops (index, 2011=100) | March | 121 | 5.6 | 22 | 38 |
| Corn ($ per bu.) | March | 6.56 | 7.5 | 34 | 78 |
| Hay ($ per ton) | March | 192.00 | 2.7 | 18 | 23 |
| Soybeans ($ per bu.) | March | 15.40 | 4.1 | 17 | 82 |
| Wheat ($ per bu.) | March | 9.94 | 8.4 | 70 | 105 |
| Livestock and products (index, 2011=100) | March | 135 | 6.7 | 39 | 38 |
| Barrows & gilts ($ per cwt.) | March | 75.10 | 9.5 | 12 | 57 |
| Steers & heifers ($ per cwt.) | March | 142.00 | 0.7 | 22 | 25 |
| Milk ($ per cwt.) | March | 25.90 | 4.9 | 50 | 46 |
| Eggs ($ per doz.) | March | 1.60 | 11.9 | 39 | –7 |
| Consumer prices (index, 1982–84=100) | March | 288 | 1.2 | 9 | 11 |
| Food | March | 296 | 1.0 | 9 | 13 |
| Production or stocks | |||||
| Corn stocks (mil. bu.) | March 1 | 7,850 | N.A. | 2 | –1 |
| Soybean stocks (mil. bu.) | March 1 | 1,931 | N.A. | 24 | –14 |
| Wheat stocks (mil. bu.) | March 1 | 1,025 | N.A. | –22 | –28 |
| Beef production (bil. lb.) | March | 2.51 | 11.3 | 1 | 4 |
| Pork production (bil. lb.) | March | 2.46 | 13.3 | –4 | –4 |
| Milk production (bil. lb.) | March | 19.7 | 12.3 | –1 | 1 |
| Agricultural exports ($ mil.) | March | 17,691 | 13.3 | 15 | 44 |
| Corn (mil. bu.) | March | 293 | 12.5 | –21 | 61 |
| Soybeans (mil. bu.) | March | 117 | –16.0 | 39 | 24 |
| Wheat (mil. bu.) | March | 63 | –7.7 | –20 | –6 |
| Farm machinery (units) | |||||
| Tractors, 40 HP or more | March | 7,719 | 33.4 | –8 | 40 |
| 40 to 100 HP | March | 5,535 | 33.9 | –14 | 38 |
| 100 HP or more | March | 2,184 | 32.1 | 6 | 37 |
| Combines | March | 343 | 71.5 | –10 | –4 |
Sources: Author’s calculations based on data from the U.S. Department of Agriculture, U.S. Bureau of Labor Statistics, and the Association of Equipment Manufacturers.
SAVE THE DATE
The Federal Reserve Bank of Chicago will hold a conference on Midwest agriculture on November 29, 2022. Additional information about this event will become available online in the coming months.


