

Summary
In the first quarter of 2023, the Seventh Federal Reserve District’s farmland values saw a 10 percent increase from a year ago, marking the eighth consecutive quarter of double-digit year-over-year growth. In addition, “good” farmland values in the District rose 2 percent from the fourth quarter of 2022 to the first quarter of 2023, according to the survey responses of 148 District agricultural bankers. Despite demand to purchase farmland still being up, there was a smaller amount of farmland for sale in the three- to six-month period ending with March 2023 than in the same period ending with March 2022. Moreover, the number of farms and the amount of acreage sold were down somewhat during the winter and early spring of 2023 compared with a year earlier. Annual cash rental rates for District farmland saw an increase of 8 percent in 2023—down from their gain of 11 percent in 2022. The vast majority of responding bankers (78 percent) forecasted District farmland values to be stable during the second quarter of 2023, while 15 percent forecasted them to be higher and 7 percent forecasted them to be lower.
Agricultural credit conditions held fairly steady in the District during the first quarter of 2023. The availability of funds for agricultural lending in the first quarter of 2023 was nearly unchanged from a year earlier, but demand for non-real-estate loans was down for the 11th straight quarter. At 70.3 percent, the average loan-to-deposit ratio in the first quarter of 2023 was slightly down from the previous quarter. Repayment rates for non-real-estate farm loans were higher in the January through March period of 2023 compared with a year ago, and the renewals and extensions of these loans were lower. The amount of collateral required by banks across the District was on net a tad higher than a year earlier. By the end of the first quarter of 2023, the District’s average nominal interest rates on farm operating, feeder cattle, and farm real estate loans had reached their highest levels since the third quarter of 2007. However, average real interest rates for all three were last higher in the first quarter of 2021.
Farmland values
Despite experiencing its smallest year-over-year gain (10 percent) in agricultural land values since the second quarter of 2021, the District still extended its streak of double-digit farmland value increases to eight quarters in the first quarter of 2023. Farmland values rose 2 percent in the first quarter of this year from the fourth quarter of last year (see table and map below). After being adjusted for inflation with the Personal Consumption Expenditures Price Index (PCEPI), the year-over-year gain in District farmland values for the first quarter of 2023 was 5 percent (the tenth consecutive quarter of real increases that were at least as large).
Percent change in dollar value of “good” farmland
|
January 1, 2023 to April 1, 2023 |
April 1, 2022 to April 1, 2023 |
|
|---|---|---|
| Illinois | +2 | +11 |
| Indiana | +8 | +22 |
| Iowa | +1 | +7 |
| Michigan | * | * |
| Wisconsin | +2 | +15 |
| Seventh District | +2 | +10 |
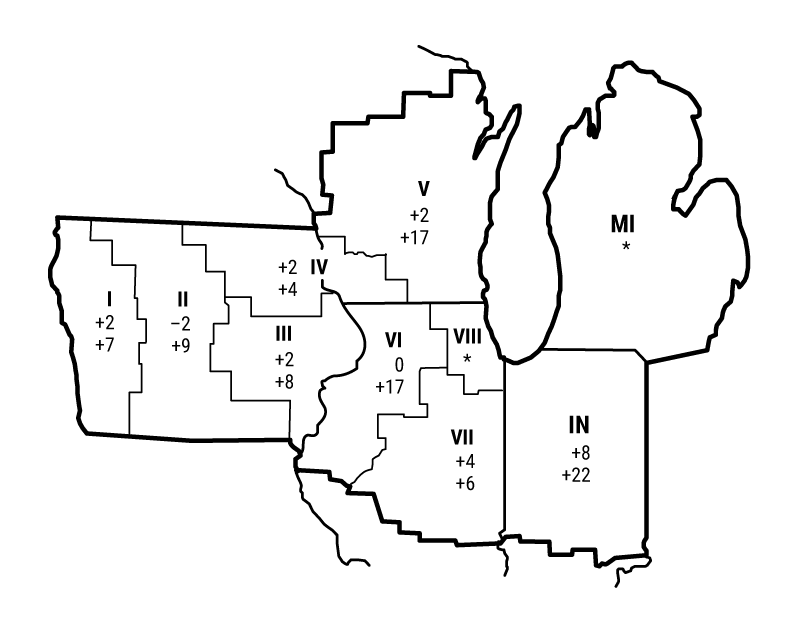
Top: January 1, 2023 to April 1, 2023
Bottom: April 1, 2022 to April 1, 2023
One Wisconsin banker noted that “with high demand, strong commodity prices, and fewer farms available for sale,” farmland values continued to rise. For the three- to six-month period ending with March 2023 relative to the same period ending with March 2022, 35 percent of the survey respondents reported higher demand to purchase farmland and 16 percent reported lower demand. Despite this firm demand for agricultural ground, there was a smaller amount of land for sale during the most recent winter and early spring compared with a year ago (22 percent of the responding bankers reported more farmland was up for sale in their areas and 33 percent reported less). Similarly, the number of farms and the amount of acreage actually sold were also down in the winter and early spring relative to a year earlier. According to survey participants, the share of acres purchased by farmers in the three- to six-month period ending with March 2023 was similar to that in the corresponding period ending with March 2022, implying that the share of acres purchased by investors was similar in both periods as well.
Cash rental rates for District farm acres increased by 8 percent from 2022 to 2023, after rising somewhat faster (by 11 percent) from 2021 to 2022. For 2023, average annual cash rents for farmland were up 10 percent in Illinois, 2 percent in Indiana, 10 percent in Iowa, and 4 percent in Wisconsin (not enough survey responses were received from bankers in Michigan to report a numerical change for that state). After being adjusted for inflation with the PCEPI, District cash rental rates were up about 3 percent from 2022 (see chart 1). This was the third consecutive annual increase in cash rents (both in nominal and real terms), following a seven-year stretch of annual decreases. In real terms, the index of farmland cash rental rates peaked in 2013 (see chart 2). Even after rising once again in 2023, the index of real cash rental rates was still 33 percent below its level in 2013. By contrast, in the first quarter of 2023, the index of real farmland values moved up—to 14 percent above its 2013 peak (again, see chart 2). The relatively weaker gains in cash rents could reflect the greater uncertainties faced by landlords compared with farm tenants, who have a better set of information available to them. Farmers should have relatively accurate estimates of the costs of operating the acres they manage; in contrast, landowners may not have enough information to optimize cash rent offers. Possibly to lessen the impact of this asymmetry, “there is an increasing percentage of flex rent/bonus rent arrangements in our area,” said a survey respondent from Illinois. These rental arrangements start with a smaller fixed cash rental rate but boost the amount received by the landlord based on a formula that could incorporate crop prices and yields. Higher crop prices or larger yields (or both) under these arrangements could provide an opportunity for owners to share in additional farm income; however, with lower crop prices or smaller yields (or both), farmers could potentially pay less than under a traditional fixed cash rental rate.
1. Annual percentage change in Seventh District farmland cash rental rates adjusted by PCEPI

2. Indexes of Seventh District farmland adjusted by PCEPI
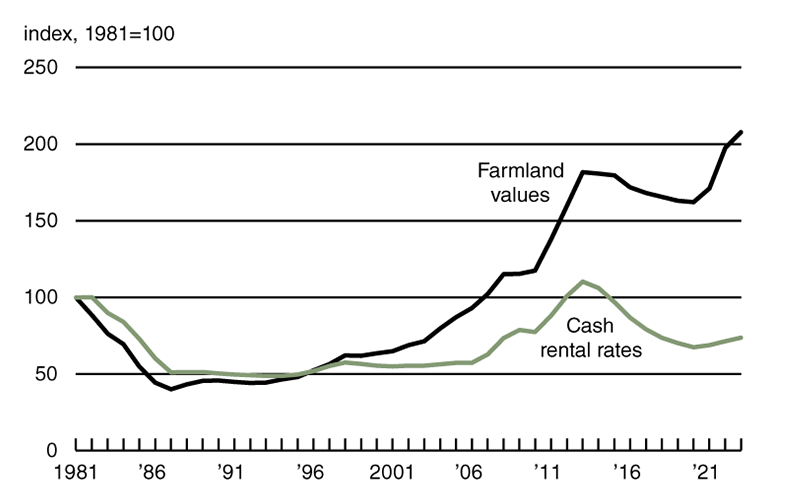
Sources: Author’s calculations based on data from Federal Reserve Bank of Chicago surveys of farmland values; and U.S. Bureau of Economic Analysis, Personal Consumption Expenditures Price Index (PCEPI), from Haver Analytics.
Slower increases in farmland values and cash rents reflected a stall in rising crop and livestock prices, which led to concerns about a decline in farm earnings from 2022’s strong levels. In March 2023, prices received by farmers were up just 1 percent from a year ago (but up 32 percent from two years ago), according to data from the U.S. Department of Agriculture (USDA); prices for livestock and associated products were up 3 percent in March 2023 from a year ago, and crop prices were down 1 percent (see final table). Furthermore, several bankers noted that higher farm interest rates slowed farmland value gains.
Credit conditions
In the first quarter of 2023, agricultural credit conditions for the District were once again in good shape, despite the jump in farm interest rates over the past year. As of April 1, 2023, the average nominal interest rates on operating loans (7.97 percent), feeder cattle loans (7.93 percent), and agricultural real estate loans (7.14 percent) were higher than at any time since the third quarter of 2007. Yet, after being adjusted for inflation using the PCEPI, average agricultural interest rates had only reached levels last seen in the first quarter of 2021.
The index of repayment rates for non-real-estate farm loans (123) indicated improvement for the tenth quarter in a row; 26 percent of responding bankers observed higher rates of repayment for the first quarter of 2023 relative to the first quarter of 2022, and 3 percent observed lower rates. Also, only 1 percent of the survey respondents reported higher levels of loan renewals and extensions over the January through March period of 2023 compared with the same period last year, while 15 percent reported lower levels of them. Yet, bankers reported a doubling to 2 percent, on average, of their farm borrowers having more carryover debt (loans not paid off at the end of the growing season and subsequently carried over into the next one) in 2023 than in 2022. The share of loans guaranteed by the USDA’s Farm Service Agency (FSA) in the portfolios of the reporting banks across the District was just under 6 percent—nearly the same level as in the past several years.
At 78, the index of demand for non-real-estate farm loans remained weak in the first quarter of 2023; for the January through March period of 2023, 15 percent of the responding bankers noted higher loan demand compared with a year ago, and 37 percent noted lower demand. The index of funds availability stayed at 102; 18 percent of the survey respondents reported their banks had more funds available to lend than a year earlier, while 16 percent reported their banks had less. Though up from a year ago, the District’s average loan-to-deposit ratio of 70.3 percent in the first quarter of 2023 was slightly down from the fourth quarter of 2022; this latest level was 9 percentage points below the average level desired by survey respondents.
Credit conditions at Seventh District agricultural banks
| Interest rates on farm loans | |||||||
| Loan demand | Funds availability | Loan repayment rates | Average loan-to-deposit ratio | Operating loansa | Feeder cattlea | Real estatea | |
|---|---|---|---|---|---|---|---|
| (index)b | (index)b | (index)b | (percent) | (percent) | (percent) | (percent) | |
| 2022 | |||||||
| Jan–Mar | 83 | 148 | 159 | 65.0 | 4.64 | 4.74 | 4.44 |
| Apr–June | 82 | 129 | 133 | 67.0 | 5.42 | 5.53 | 5.17 |
| July–Sept | 91 | 96 | 121 | 68.2 | 6.52 | 6.58 | 6.13 |
| Oct–Dec | 82 | 102 | 131 | 70.6 | 7.50 | 7.54 | 6.80 |
| 2023 | |||||||
| Jan–Mar | 78 | 102 | 123 | 70.3 | 7.97 | 7.93 | 7.14 |
b Bankers responded to each item by indicating whether conditions in the current quarter were higher or lower than (or the same as) in the year-earlier quarter. The index numbers are computed by subtracting the percentage of bankers who responded “lower” from the percentage who responded “higher” and adding 100.
Note: Historical data on Seventh District agricultural credit conditions are available online.
Looking forward
According to another Illinois banker, their typical farmer has “very little need to borrow” and “plenty of cash on hand.” This seemed to be the situation across much of the District, since survey respondents forecasted that the volume of both farm real estate and non-real-estate loans would fall in the District during the April through June period of 2023 relative to the same period of 2022.
In 2023, most survey respondents from Illinois, Indiana, and Iowa viewed agricultural ground as overvalued, albeit with slimmer majorities than in 2022 among those from Illinois and Iowa (Indiana’s data were essentially the same this year as last year). In both 2022 and 2023, overwhelming majorities of respondents from Michigan and Wisconsin did not view farmland as overvalued. Looking ahead to the second quarter of 2023, 15 percent of survey respondents anticipated farmland values to increase, 78 percent anticipated them to be stable, and 7 percent anticipated them to decrease. Hence, survey responses suggested slower growth for District agricultural land values in the next quarter.
Selected agricultural economic indicators
| Percent change from | |||||
|---|---|---|---|---|---|
| Latest period | Value | Prior period | Year ago | Two years ago | |
| Prices received by farmers (index, 2011=100) | March | 128 | 1.3 | 1 | 32 |
| Crops (index, 2011=100) | March | 119 | –1.5 | –1 | 21 |
| Corn ($ per bu.) | March | 6.67 | –1.9 | 2 | 36 |
| Hay ($ per ton) | March | 231.00 | 0.0 | 17 | 42 |
| Soybeans ($ per bu.) | March | 14.90 | –1.3 | –3 | 13 |
| Wheat ($ per bu.) | March | 8.34 | –2.2 | –16 | 42 |
| Livestock and products (index, 2011=100) | March | 138 | 3.8 | 3 | 43 |
| Barrows & gilts ($ per cwt.) | March | 61.60 | 3.2 | –17 | –8 |
| Steers & heifers ($ per cwt.) | March | 167.00 | 3.1 | 18 | 44 |
| Milk ($ per cwt.) | March | 21.10 | –2.3 | –18 | 22 |
| Eggs ($ per doz.) | March | 2.80 | 7.3 | 76 | 143 |
| Consumer prices (index, 1982–84=100) | March | 302 | 0.3 | 5 | 14 |
| Food | March | 321 | 0.1 | 9 | 18 |
| Production or stocks | |||||
| Corn stocks (mil. bu.) | March 1 | 7,401 | N.A. | –5 | –4 |
| Soybean stocks (mil. bu.) | March 1 | 1,685 | N.A. | –13 | 8 |
| Wheat stocks (mil. bu.) | March 1 | 946 | N.A. | –8 | –28 |
| Beef production (bil. lb.) | March | 2.40 | 14.9 | –4 | –3 |
| Pork production (bil. lb.) | March | 2.49 | 15.4 | 1 | –2 |
| Milk production (bil. lb.) | March | 19.8 | 11.7 | 0 | 0 |
| Agricultural exports ($ mil.) | March | 15,856 | 3.9 | –10 | 3 |
| Corn (mil. bu.) | March | 194 | 50.3 | –34 | –48 |
| Soybeans (mil. bu.) | March | 115 | –41.7 | –2 | 37 |
| Wheat (mil. bu.) | March | 50 | –27.3 | –20 | –37 |
| Farm machinery (units) | |||||
| Tractors, 40 HP or more | March | 7,026 | 31.4 | –7 | –17 |
| 40 to 100 HP | March | 4,755 | 33.3 | –12 | –26 |
| 100 HP or more | March | 2,271 | 27.4 | 4 | 10 |
| Combines | March | 509 | –4.0 | 47 | 33 |
Sources: Author’s calculations based on data from the U.S. Department of Agriculture, U.S. Bureau of Labor Statistics, and the Association of Equipment Manufacturers.
SAVE THE DATE
The Federal Reserve Bank of Chicago will hold a conference on Midwest farmland ownership on November 28, 2023. Details about this event will become available online in the coming months.


