


As the first decade of the new century ends, we continue to devote our attention to the very important mission of fostering a strong economy and promoting financial stability. The economic events of 2010, outlined on the next two pages, presented significant challenges and demonstrated a continued need for a high rate of policy accommodation.
Many significant events also impacted the work of Federal Reserve in 2010, including the passage of the Dodd–Frank Wall Street Reform and Consumer Protection Act, which gives us a variety of new responsibilities. After the bill was passed in July, we embraced these new responsibilities enthusiastically and moving forward will continue our efforts to review our operations and develop the infrastructure needed to carry them out.
Success in this type of environment depends on the full commitment of a diverse group of people with a wide range of expertise. Fortunately, the Federal Reserve Bank of Chicago has exactly that. I’d like to thank our directors in both Chicago and Detroit for their counsel throughout the year. Their assistance and guidance is deeply appreciated. A special note of gratitude goes to Detroit board member Michael M. Magee, Jr., who completed his service in 2010. I would also like to thank our staff members for their hard work and continued dedication to serving the public interest (See related article).
Finally, the essay is particularly appropriate given the current monetary policy environment, which features a federal funds rate at a level between zero and 0.25%. In the essay I discuss some different approaches to policy to consider when economic conditions warrant this type of exceptionally low rate.
I hope you find it informative and thought-provoking.

Charles L. Evans
President and Chief Executive Officer
March 22, 2011
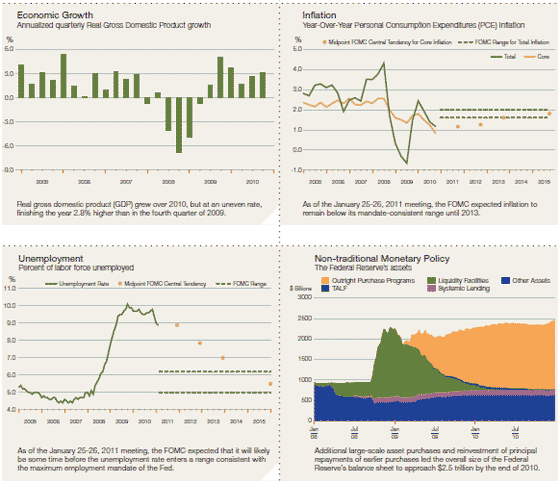
The U.S. economy continued to rebound in 2010 from the recession. Real gross domestic product (GDP) grew 2.8% last year, albeit at an uneven pace: Higher growth rates were seen in the beginning and end of the year, while growth slowed somewhat during the spring and summer months. As we begin 2011, the recovery continues to strengthen. This is encouraging, but to close the existing large resource gaps within a reasonable period will require a marked and sustained pick-up in growth.
Over the course of 2010 and early 2011, the unemployment rate fell by a percentage point to 8.9% in February. While this decline is welcome, unemployment remains well above the 5% to 6% range that encompasses most economists’ estimates of its natural rate. Furthermore, with most forecasts for growth only moderately above the economy’s potential, it is likely to take some time for unemployment to decline to a level consistent with the employment side of our mandate.
Looking at the price stability side of our mandate, inflation in 2010 remained well below our unofficial target of 2%. The Personal Consumption Expenditures (PCE) price index ended the year only 1.1% higher than in the fourth quarter of 2009. Core PCE inflation, which excludes volatile food and energy prices, was up 0.8% compared with the fourth quarter of 2009, an historical low. While commodity prices have increased, long-run inflation expectations remain anchored and resource slack should continue to exert offsetting downward pressure on prices for some time.
The Economy
After finishing 2009 with an impressive 5.0% annual rate of growth, real GDP increased at an annual rate of 3.7% in the first quarter of 2010. As we moved through the year, businesses completed their inventory adjustments, the fiscal stimulus began to wane, and concerns about spillovers from events in Europe appeared to induce more cautious behavior by households and businesses. Growth slowed to an average pace of about 2% in the second and third quarters, but picked up later in the year, as a robust increase in consumer spending and a surge in net exports led to an annualized growth rate of 3.1% in the fourth quarter.
A large portion of the increase in consumer spending late last year came from purchases of durable goods — in particular vehicle sales. Sales for nondurables also picked up toward the end of the year, led by strong holiday retail sales, while service outlays rose at a modest pace. In contrast, the housing market remained weak. Residential investment was volatile over the year, but with annual growth that was once again negative. Most measures of house prices moved sideways or were down a bit further over the year, and housing starts and permits remained near their historically low levels.
Business investment improved in 2010. Purchases of new equipment and software increased 16.9% from the fourth quarter of 2009 as firms replaced aging equipment and the demand for their products and services expanded. However, businesses were reluctant to construct new facilities: Investment in nonresidential structures fell sharply in 2010, though the decline was not as great as during 2009. There have since been some tentative signs of improvement in commercial real estate conditions with some tick-down in vacancy rates and improved availability of financing.
Amid these signs of recovery, the labor market remains a source of concern. Progress has certainly been made: Initial claims for unemployment insurance have returned to June 2008 levels. However, while layoffs have subsided, hiring has not been robust. The economy added 940,000 jobs in 2010, an average of around 78,000 per month and not nearly enough to make up for the 8.75 million jobs lost during the recession and immediately after.
Looking ahead, the forecasts released following the January 25–26, 2011 meeting of the Federal Open Market Committee (FOMC) showed that most FOMC participants believed real GDP would rise in the 3.5% to 4% range in 2011, the unemployment rate would end the year a bit under 9%, and core PCE inflation would be in the range of 1% to 1.25%. Most FOMC participants also thought that by the fourth quarter of 2013, the unemployment rate would still be above its long-run level and that inflation would still be below the 2% pace that most view as being consistent with our mandate.
Monetary Policy
With a considerable amount of slack left in the economy, the FOMC left its traditional policy instrument, the federal funds rate, unchanged at a level between zero and 0.25% in 2010. Early in the year, when growth was strong and inflation was no longer declining, the FOMC devoted considerable effort to developing the necessary tools to begin to exit from its stance of large policy accommodation when it became appropriate to do so. These included facilities for reverse repurchase agreements and term deposits, paying interest on reserves, and potential sales of securities.
As growth slowed and inflation once again began to decline in the summer of 2010, the FOMC began to focus again on more accommodative monetary policies. The Committee continually reaffirmed its judgment that economic conditions were expected to warrant exceptionally low levels of the federal funds rate for an extended period. Furthermore, in August, the FOMC began reinvesting principal repayments from earlier long-term security purchases. The aim of this initiative was to avoid the mechanical tightening of policy that would have resulted from a shrinking of the size of security holdings on the Fed’s balance sheet. Following this action, in November, plans were announced to add further accommodation through the purchase of an additional $600 billion in long-term Treasuries by June 2011. So far, we have purchased around $450 billion of this amount.
Such long-term security purchases appear to have put downward pressure on long-term real interest rates, in part by lowering the odds that market participants were placing on inflation falling substantially further. With regard to financial conditions in the private sector, credit conditions for large firms stayed on the path to recovery as bond spreads narrowed. Equity markets have seen a drastic reduction in volatility, and prices in these markets rose considerably over 2010. There have also recently been signs that bank lending is beginning to thaw. Still, credit conditions remain tight for some classes of borrowers.
Source for all charts: Haver Analytics. The Inflation and Unemployment charts also include information from the minutes of the January 25–26, 2011 FOMC meeting.
*This essay reflects information available as of March 25 , 2011.
CONDUCTING RESEARCH
- 20 policy papers were accepted in toptiered journals.
- Staff members researched many critical issues related to the emerging recovery and key economic and financial market developments.
- Labor market dynamics and the functioning of monetary policy when the Federal Funds rate is near zero garnered special research attention.
- Other efforts included development of a dynamic stochastic general equilibrium model of the macroeconomy and an arbitrage-free model of the term structure of interest rates. This helped shape President Charles Evans’ thinking on monetary policy, including his discussion of the possible value of price-level targeting.
KEEPING BANKS SAFE
- Chicago Fed supervisors helped develop and implement enhanced national supervision standards for the largest, most complex financial institutions.
- Bank supervisors confronted a challenging environment characterized by a large number of troubled institutions and a continued downturn in the commercial real estate sector.
- Staff members tailored bank exams to the risk of the individual institution, and key control points were identified to ensure consistently among exams.
- Supervisors exceeded all targets for conducting exams and delivered accurate and timely supervisory reports.
PROMOTING FINANCIAL STABILITY
- Staff contributed significantly to the development, testing and implementation of the Term Deposit Facility, one of the special monetary policy tools created in response to the financial crisis.
- The Chicago Fed helped coordinate the successful closure of 28 distressed depository institutions in the Seventh Federal Reserve District.
- Financial market researchers analyzed a variety of risk management and stability issues associated with payments, clearing and settlement systems.
KEEPING PAYMENTS SECURE
- Headquartered in the Seventh District, the Customer Relations and Support Office (CRSO) continued its leadership role as the connection to the customer within the Federal Reserve. The CRSO manages the national electronic payments delivery network (FedLine), provides access to customer set-up and support to more than 100,000 users, and leads national strategies related to sales and marketing.
- Cash-processing staff members maintained a strong control environment amid new controls and procedures and upgraded high-speed processing equipment. The number of cash bundles per hour improved significantly.
- Seventh District electronic checkprocessing activities were successfully shifted in July to the Federal Reserve Bank of Atlanta.
- The check-processing office just south of Chicago’s Midway Airport closed in August.
FOSTERING PARTNERSHIPS
- The Chicago Fed helped lead a national Federal Reserve System effort to help policymakers, community organizations, financial institutions and government agencies respond to the foreclosure crisis by conducting research initiatives, convening experts on a variety of foreclosure issues, and communicating information about a range of related topics.
- In an effort to improve the flow of credit to small businesses, the Chicago Fed contributed to a Federal Reserve System initiative to inform policymakers on issues that restrict the flow of credit and opportunities to small businesses.
- Money Smart Weeks in all Seventh District states continued to bring together consumers with organizations and individuals who provide financial education. More than 2,000 partner organizations throughout the Midwest offered financial education to thousands of consumers, including 60,000 Chicago Public School students.
- A wide variety of research and policy conferences were held on topics related to the welfare of the overall economy.
After suffering the worst recession since the Great Depression, by early 2010 the U.S. economy appeared to be well into recovery mode. The focus of U.S. monetary policymakers began to turn to strategies to ensure an effective exit from the exceptional degree of monetary policy accommodation we had put in place to help the economy recover. This accommodation was unprecedented: The federal funds rate had been lowered to its zero lower-bound and we had on our balance sheet about $1.75 trillion of long-term assets that we had purchased to further stimulate the economy.
This focus changed as we moved through the year. The expansion did not achieve the kind of self-sustaining momentum that we were looking for. Instead, growth softened as the impulses from fiscal stimulus and post-recession inventory rebuilding ran their course and the European debt crisis created a renewed sense of caution among households and businesses. Unemployment remained stubbornly high, and inflation moved down to a level well below that consistent with our price stability mandate.
Like the outlook, my thinking about the economic situation evolved through the year. By last summer, I had come to the conclusion that the economy was most likely mired in a liquidity trap, in which the zero lower-bound constraint on our policy rate was preventing real interest rates from falling low enough to allow desired saving and investment to reach equilibrium. As a result, resource gaps remained very large and were not likely to fall quickly.
This led me to give serious consideration to the results of the research literature on optimal monetary policy at the zero lower-bound. I found that papers such as Krugman (1998) and Eggertson and Woodford (2003) made a strong case that when the zero bound became binding, policymakers should adopt alternative policies.1 As discussed in the essay, these policies achieve lower real interest rates, and thus greater monetary policy accommodation, through a commitment to keep short-term policy rates low so as to achieve a somewhat higher future rate of inflation. As Eggertson and Woodford show, these theoretically optimal policies take the form of a commitment to eventually achieving a rising target for the price level and, thus, guarantee higher future inflation.
By the fall, I had begun to advocate the conditional pricelevel targeting policies that were suggested by the research literature. I recognized that such policies presented formidable communication challenges and ran counter to the conservative culture of central banking. However, I argued that they follow quite logically from analysis of the kind of models that underlie most of modern central banking practice.
The Federal Open Market Committee (FOMC) did not adopt price-level targeting. But we did begin a second round of largescale asset purchases, another non-standard policy aimed at providing additional monetary accommodation when policy rates are at the zero bound. I supported this program because, in addition to its potential direct influence on longer-term interest rates, it added credibility to our commitment to maintain the federal funds rate at extraordinarily low levels for an extended period of time. This commitment, which has been in the FOMC’s policy statement since March 2009, is certainly in the spirit of the recommendations of the modern literature on monetary policy in a liquidity trap environment.
For many years, economists thought liquidity traps were theoretical curiosities without much relevance to modern economies. The experience of Japan in the 1990s began to change that thinking, and we now see that even the modern U.S. economy can find itself in a liquidity trap with unemployment much too high and inflation much too low. As such, non-traditional tools for monetary policy to use when constrained by the zero lower bound are worthy of further consideration and analysis. This essay provides an overview of such tools. It is written from the perspective of the economic and policy environment as of early 2011. Analysis of these tools is ongoing, and new insights or changes in economic conditions undoubtedly will influence the implementation of such policies going forward.2
- Charles L. Evans,
President and Chief Executive Officer
Despite a year and a half of economic growth, the level of real GDP in the fourth quarter of 2010 had only just recovered to its pre-recession peak, and it was still in the neighborhood of 6–7 percent below the level that would have prevailed had the recession not occurred and had the economy grown at trend. As of February 2011, nonfarm payrolls were nearly 5-1/2 percent below their earlier peak; and the unemployment rate, at 8.9 percent, was well above the 4-3/4 to 5 percent rate that had prevailed before the recession. Even allowing for structural factors that may be impinging on output and labor markets, we clearly are falling short of the maximum sustainable employment leg of the Federal Reserve’s policy mandate. The associated large and persistent resource gaps have been a principal factor in the decline in the underlying trend in inflation from about 2-1/2 percent in mid-2008 to just above 3/4 percent in early 2011.3 This is well below the 2 percent rate that I and the majority of Federal Open Market Committee (FOMC) participants consider to be consistent with the price stability component of our dual mandate.
In large part, these facts reflect the severity of the financial crisis and the resulting recession. There was substantial damage to repair — to the flow of credit through financial markets; to the loss of wealth to households; and to the balance sheets of financial and nonfinancial businesses. Such repair takes time. But the failure of the economy to obtain a more solid footing this long after the shock of the financial crisis has been compounded by another problem: We have found ourselves in a liquidity trap.
LIQUIDITY TRAP

In a normally functioning market economy, interest rates move to adjust the supply of saving to the demand for investment. If desired saving is high relative to desired investment, interest rates tend to fall. The fall in rates reduces the returns to saving while at the same time lowering the cost of borrowing to finance spending. The movement in rates thus encourages consumers and businesses to increase investment and other spending and to reduce saving. The process continues until saving and investment are in balance.
A liquidity trap arises when the supply of saving outstrips the demand for investment, but interest rates cannot fall further to rebalance them. This is the predicament that we found ourselves in beginning in 2009 and that still prevailed in early 2011.
Short-term nominal interest rates — importantly, the federal funds rate, the Federal Reserve’s principal policy tool — were essentially at zero. The fed funds rate is the interest rate on overnight loans between banks. The funds rate cannot fall below zero — there is no incentive for a bank to lend a dollar today on the fed funds market if it is going to receive back less than a dollar tomorrow; holding cash would provide a higher return.4
At the same time, there was an ample supply of saving and a scarcity of demand for borrowing. Even after more than a year of recovery, business executives were being very cautious in their outlook and in their spending plans. They appeared content to post strong profits generated by large-scale cost-cutting, rather than growing their top-line revenues by expanding capital investment and hiring. Financial markets had improved and were receptive to strong bond issuance by businesses. But very conservative attitudes reigned, and many firms held on to a good deal of the cash generated by profits. Very few were planning to grow their work force over the near term. They pointed to weak demand conditions to explain their reluctance to expand their operations.
Households were similarly cautious in their spending. Given the millions of jobs lost during the recession, the job insecurity faced by those employed, and trillions of dollars in lost wealth, consumers displayed significant risk aversion. In order to repair balance sheets, households substantially increased the share of their income that they save, even though that saving earned very little return.
These high rates of saving and low levels of spending had repercussions for other markets. Importantly, they contributed to the large gaps in output and employment from their longer-run trends and the associated decline in inflation to a rate well below our price stability mandate.
Economic conditions improved in late 2010 and early 2011. Growth has picked up and suggests a more self-sustaining, though still moderate, economic expansion. Indeed, the outlook for growth is not strong enough to close resource gaps for some time, even if, as assumed by markets, short-term interest rates remain near zero well into 2012. So the discussion of liquidity traps and policies aimed at combating them is still relevant today.
POLICIES AT THE ZERO BOUND
Decisions on borrowing and lending are importantly influenced by real interest rates. The real interest rate equals the nominal rate less the expectation for inflation over the life of the asset. It therefore reflects the purchasing power of the interest payments that change hands between borrower and lender.5 Lower real rates stimulate spending; higher ones increase saving.
In normal times, the Federal Reserve would react to major shortfalls in employment and inflation from our policy mandates by lowering the federal funds rate with the aim of lowering short-term real rates. With the funds rate at zero, we cannot do so today. However, this does not mean we have no tools to increase monetary accommodation. According to current thinking about liquidity traps, the best policy response when further reductions in short-term nominal rates are not feasible is to implement policies aimed at lowering real interest rates through other channels. To do so, the central bank must employ unconventional policy tools. These tools fall into two general categories: policies that focus on lowering nominal interest rates at medium and longer maturities; and policies aimed at lowering real interest rates by increasing inflation expectations.
POLICIES THAT LOWER MEDIUM- AND LONGER TERM NOMINAL INTEREST RATES
Most household and business borrowing generates debt with maturities measured in years, not months. The medium- and long-term interest rates on this debt are related to short-term rates through what is called the term structure. This means that interest rates on longer-maturity assets reflect the average of the sequence of yields on shorter-term assets that markets expect will prevail over the life of the longterm asset. They also reflect an additional risk premium to compensate the holders of longer-term debt for the possibility that interest rates will deviate from current expectations sometime over the life of the asset. Today, even though longer-term rates are quite low, they are not near zero. This is because markets expect shortterm rates to rise eventually and because bond holders need to be compensated for uncertainty over the path of future rates.
One way to keep medium- and long-term rates low is to convince markets that short-term rates will be low for an extended period. The FOMC’s policy statement has been saying this since March 2009. Markets have now built a long period of low rates into their expectations — for example, as of March 2011, futures markets do not expect the federal funds rate to begin rising until sometime in the spring of 2012 and then anticipate it will then increase only about 100 basis points over the following year.
Additionally, policy can operate directly in markets for longer-duration securities. The Federal Reserve has done so through largescale asset purchases (LSAPs). In the first wave in 2008 and 2009, we purchased nearly $1.5 trillion of GSE (government-sponsored enterprise) debt and mortgage-backed securities and $300 billion of long-term Treasury debt. Now, we are in the process of making a second wave of Treasury purchases, currently planned to total $600 billion. Most purchases in both waves were of securities with maturities in the range of two to ten years.
LSAPs can reduce long-term interest rates in several ways. First, the Fed’s purchases reduce the overall amount of long-term debt left on the market. Long-term assets contain a price discount (an interest rate term premium) to compensate bond holders for bearing the risk of future interest rate fluctuations (duration risk). The Fed’s purchases lower the aggregate amount of duration risk by removing some of the long-term debt in the market. This lowers the premium necessary to get the marginal investor to hold additional duration risk. That is, it lowers long-term interest rates by reducing the term premium.
In addition, some economic agents want to hold assets with particular maturities and risk characteristics and are willing to pay a premium for them. When the Fed purchases such securities, it can drive up the price — or lower the interest rates — on these assets. As investors then seek to rebalance their portfolios with assets similar to those purchased by the Fed, the rates on those loans and securities fall as well, stimulating new issuance and increased borrowing in those markets.
Finally, LSAPs are an important tool signaling our ongoing commitment to keeping short-term rates low for an extended period. Because long-term interest rates reflect the expected path of future short-term rates, our purchases signal that we believe these rates will be lower, on average, than might have been expected before we entered the market. And because our traditional policy tool, the federal funds rate, anchors very short-term interest rates, we are also relaying a signal about our anticipated policy stance.
POLICIES THAT BUOY INFLATION EXPECTATIONS
Another way to lower real interest rates is by raising expected inflation while maintaining low nominal rates. All else being equal, when inflation increases, the cash (or any other asset with a payout not linked to inflation) that you hold on to today will be able to purchase fewer goods and services tomorrow. This increases the incentive to spend today.
The first strategy for buoying inf lation expectations is for the Federal Reserve to announce an explicit goal for inflation that is higher than today’s inflation rate. The Federal Reserve currently does not have an explicit inflation target (See related article.) That said, most participants in the FOMC have indicated that their long-term objective is for inflation to be around 2 percent. Last year, inflation fell below this implicit target. Early in 2010, core PCE inflation was 1-3/4 percent; by the turn of the year it had fallen to about 3/4 percent. Over the same period, total PCE inflation dropped from about 2-1/2 percent to just over 1 percent. Financial market measures of medium- and long-term inflation expectations also fell noticeably over the spring and early summer; indeed, markets appeared to price in palpable odds of very low inflation or even outright deflation. These lower actual and expected inflation rates made real interest rates higher, and spending lower, than they otherwise would have been.
An explicit target could more firmly anchor inflation expectations, that is, make people think actual inflation will return more quickly to the stated target. If current inflation were too low, this would lower real interest rates and increase spending. Although the Fed has not adopted an explicit target, since September 2010 our policy statements and other communications have indicated that the Committee thought inflation was running below rates that are consistent with price stability. As of late March 2011, increases in food and energy prices have boosted the most recent readings of total consumer inflation, and core measures have ticked up a bit as well. Market-based measures of expectations for total inflation have risen back to the range they were in early 2010. However, many medium-term forecasts still have inflation below the 2 percent mark. So, all else being equal, returning expectations more quickly to 2 percent could translate into a decline in real short-term rates that would be of further help to the economy in exiting the liquidity trap.
The second tool for raising inflation expectations is price-level targeting. (See related article). Under this approach, the central bank strives to hit a particular price-level path within a reasonable period. For example, if the rate of change in prices along the path is 2 percent and inflation has been running below 2 percent for some time, the actual price level will be well below the target path. Monetary policy would then strive to “catch-up” and bring the price level back to the target. This means that inflation would be higher than the inflation target for a time until the path is regained. If inflation expectations matched the projected rates needed to regain the price-level path, real interest rates would fall accordingly. Once the path is achieved, monetary policy would return to its usual focus on a 2 percent inflation target over the medium term.
I consider price-level targeting a policy option that is only appropriate for the unusual situation of a liquidity trap. In more usual times, the Fed would address lower-than-desirable levels of employment and inflation by adjusting the federal funds rate. However, as discussed earlier, we are currently constrained from doing so by the zero bound.
Note that both policies aimed at buoying inflation expectations run counter to the old engrained thinking that higher inflation is bad. But, in an environment with below-target inflation, creating expectations of appropriately higher inflation in the short term is consistent with our price stability objective. Core inflation has been running below our informal objective for two years. By bringing it back to 2 percent, we are recognizing that policy can fail in either direction: by letting inflation remain below our implicit target, as well as by letting it rise above the target
COMMUNICATIONS

No matter what policy we are undertaking, it is essential that we at the Fed communicate our intentions clearly, provide a measurable goal by which to evaluate our progress, and sustain our commitment to achieving that goal.
Ambiguity in our message can undermine our ability to achieve our goals. We can make our existing tools more effective by explicitly stating our objectives and the likely course of future policy that would achieve them. Importantly, both the inflation rate and price-level targeting policies facilitate communication. In the current situation, these policies elaborate on what it means for the FOMC to say rates will be low for an “extended period” — they will be low until inflation is more clearly headed back to rates consistent with our policy mandate.
More generally, it is vitally important for our policy actions to be judged relative to the mission that Congress has laid out for us in the Federal Reserve Act. Accountability is a critical obligation for any central bank that requires substantial independence to be effective. Accordingly, it is of the utmost importance that we continually evaluate our policy record against our objectives and communicate our actions and the results. I believe our communication would be enhanced in terms of both clarity and effectiveness if we established an explicit numerical inflation objective. Knowing our target, the public and markets could make reliable inferences about the future path of monetary policy. Moreover, a credible inflation target would give the Fed more flexibility in its near-term policies and help us achieve our goals sooner and with less risk of unintended consequences.
Selected Central Banks’ Inflation Guidelines
Central banks in nearly all major economies in the world have an explicit numerical target for inflation that policy aims to achieve. Some smaller countries have an explicit policy target stated in terms of stabilizing their exchange rate. Generally speaking, meeting this inflation target is the only stated mandate for monetary policy; however, most of these countries also are required to consider macroeconomic stability when setting the path to obtain their inflation goal.
Today, the United States and Japan are the only major countries in the world without an explicit numerical target for inflation. That said, the Federal Reserve publishes ranges and central tendencies for what each FOMC participant believes inflation will converge to in the long run under appropriate policy and in the absence of further shocks to the economy. And the Bank of Japan polls its board members on their “understanding” of the rate of inflation that is consistent with price stability and has published information about the resulting ranges.
Many countries adopted numerical targets as a way to help reduce inflationary expectations and facilitate the transition from high or moderately high inflation rates to low and stable ones. Today, the United States and Japan find themselves in the opposite situation — with inflation rates that are stubbornly running too low. The question we face is whether adoption of explicit targets could help buoy inflation expectations and bring inflation back up to rates policymakers feel are consistent with price stability.
Below are some examples of the numerical inflation targets for several major central banks. This list starts with New Zealand, which led the way in adopting a numerical target in 1990.
1990
RESERVE BANK OF NEW ZEALAND
Policy designed to keep future All Groups Consumer Price Index inflation outcomes between 1 and 3 percent on average over the “medium term.” When conducting policy, the Bank is directed to “seek to avoid unnecessary instability in output, interest rates, and the exchange rate.”
1991
BANK OF CANADA
An “inflation-control target range” for the 12-month change in total CPI inflation of 1 to 3 percent, with policy aimed at the 2 percent midpoint. Also, policy is directed to move inflation to the 2 percent midpoint over the next 6 to 8 quarters, “although specific occasions may arise in which a somewhat shorter or longer time horizon might be appropriate.” Core inflation is used as a shorter-term operational guide for policy.
1992
BANK OF ENGLAND
A target of 2 percent measured by the 12-month change in the total CPI, with policy designed to bring inflation to target “in a reasonable period of time without creating undue instability in the economy.”
1998
EUROPEAN CENTRAL BANK
Target defined in terms of the year-on-year increase in the Harmonized Index of Consumer Prices, with policy designed “to maintain inflation below, but close to, 2 percent over the medium term.” Furthermore, “...without prejudice to the objective of price stability, the ECB shall support the general economic policies in the Community with a view to contributing to the achievement of ... a high level of employment and sustainable non-inflationary growth.”
Simple example of a price-level target: A P* Path
At times, there may be justification for targeting a higher price-level path in an effective, disciplined, and limited fashion. There are four components to a price-level targeting policy:
1. THE ANNOUNCEMENT OF A STATE-CONTINGENT ENTRY INTO THE P* POLICY.
To justify undertaking this policy, the central bank must be missing on both components of its dual mandate by large margins. These situations would be rare: Liquidity traps with double-digit unemployment and inflation rates below 1 percent occur perhaps twice a century or ever less often.
2. THE SELECTION OF THE PARAMETERS FOR THE PRICE-LEVEL PATH— THE INITIAL DATE WHEN THE INDEX TARGET PATH BEGINS AND THE RATE AT WHICH THAT PATH RISES.
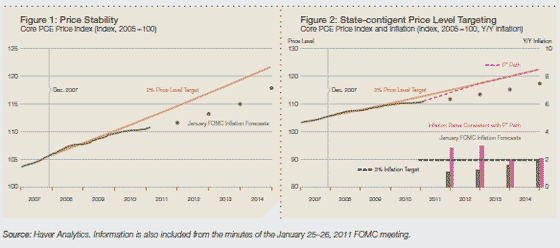
Given the delay in recognizing and understanding the implications of the liquidity trap, the index target path likely would begin at some date in the past. In the current situation, I would prefer to start with December 2007, in part because this date represents the peak of the business cycle identified by the National Bureau of Economic Research (NBER). With regard to how the P* path rises, I suggest 2 percent for the average inflation rate; this rate corresponds to most FOMC participants’ long-run forecast endpoints for PCE inflation. With this definition, the difference between the actual price level and the P* path is the “inflation deficit” to date. (See Figure 1 below.)
3. REGULAR PUBLIC COMMUNICATION THAT THE INTENTION OF THE FOMC’S POLICY ACTIONS IS TO ACHIEVE THIS PATH WITHIN A REASONABLE PERIOD.
At a minimal level, this could simply be a disciplined guarantee regarding how long policy rates will be held at zero. Other accommodative policies could be used to further build the public’s confidence that the Fed is pursuing this price-level path. This communication would include many operational details. For example, even before reaching the P* path, a substantial closing of the gap would set the stage for adjustments in operational policy, such as altering the size of the Fed’s balance sheet, taking reserve-draining actions along the way, and increasing the rate of interest on excess reserves (IOER), among others.
4. TERMS FOR THE FINAL, STATE-CONTINGENT EXIT FROM THE P* POLICY.
Determining with a high degree of confidence that the price-level path has been achieved would be critical. Presumably, this would require spending a few months at the price-level path. Once there is confidence that the price-level path has been achieved, the forward-looking monetary policy strategy would return to focusing on 2 percent inflation over the medium term. Future policy misses on either side of 2 percent would be used to inform current analyses of inflation pressures and improve future projections and policy responses.
WHAT MIGHT THE PRICE-LEVEL TARGET APPROACH LOOK LIKE?
Figure 2 shows the implied inflation rates for a 2 percent P* path, where the current price gap is closed by the end of 2012 and we return to 2 percent inflation in 2013. (Of course, ensuring commitment to the policy exit is presumably crucial for achieving 2 percent in 2013.) The inflation rates in this example are relatively modest: 2.8 percent core inflation in 2011 and 2.9 percent in 2012. For a policymaker with a symmetric loss function around 2 percent, 2.9 percent is about the same loss as 1 percent — in other words, it is about a 1 percentage point policy miss regardless of whether the result is above or below the target. If short-term interest rates remain near zero during this adjustment, real interest rates would be between –2 and –3 percent. In this scenario at the end of 2012, if resource slack remains substantial and inflationary pressures are returning toward 2 percent over the medium term on account of credible policy commitment, then a standard Taylor-rule prescription may still call for a relatively low federal funds rate. And the size and composition of the Fed’s balance sheet might also be consistent with accommodation. How much? The ultimate decisions for monetary policy would continue to focus on our dual mandate responsibilities, but inflation would be nearer our goal of price stability and aggregate demand would be stronger.
Senior Vice President and Senior Research Advisor Spencer Krane contributed to the development of this essay
1Eggertsson, Gauti B., and Michael Woodford, 2003, “The Zero Bound on Interest Rates and Optimal Monetary Policy,” Brookings Papers on Economic Activity, Vol. 34, No. 1, pp. 139–211.
Krugman, Paul R., 1998, “It’s Baaack: Japan’s Slump and the Return of the Liquidity Trap,” Brookings Papers on Economic Activity, Vol. 29, No. 2, pp. 137–187.
2The essay draws heavily on speeches I gave last fall and winter at the Federal Reserve Bank of Boston’s 55th Economic Conference, The Bank of France’s conference on the Future of Monetary Policy, and the American Economic Association’s Annual Meetings.
3The underlying trend in inflation is measured here by our preferred benchmark, the 12-month change in the price index for personal consumption expenditures excluding food and energy. For our long-run policy goal, the Federal Reserve concentrates on the price index for all total personal consumption expenditures. However, food and energy prices are very volatile—both up and down. Being free of this volatility makes the core measure a better indicator of underlying broad inflation trends and therefore a better guide to where inflation is heading.
4 In some special cases, interest rates can fall below zero. Examples have been seen with certain Treasury issues because some market participants needed the securities to fulfill particular contract obligations. The costs of failing to meet those obligations would have been greater than the funds lost through a negative interest rate.
5Consider a loan of $100 today that pays back $110 a year from now. The $110 tomorrow will be able to purchase fewer goods and services than $110 would today if the prices of those items goes up. So in terms of goods and services, the return to the lender is 10 percent ($10/$100) less the increase in the prices of those items.


