Michigan Exports Lagging
The Michigan economy has surged since the end of the Great Recession (in 2009). Until recently, rising exports had been part of this story. However, Michigan’s exports abroad have fallen off significantly of late even as its economy continues to grow.
According to the Federal Reserve Bank of Chicago’s Michigan and Relative Michigan Economic Indexes, Michigan’s economy grew at a rate faster than its long-run trend and at a higher rate relative to that of the U.S. since 2010.1 Moreover, during the past five years, Michigan has added 334,700 nonfarm payroll jobs and its unemployment rate has fallen from 13.8% to 5.6% as of March, 2015.2
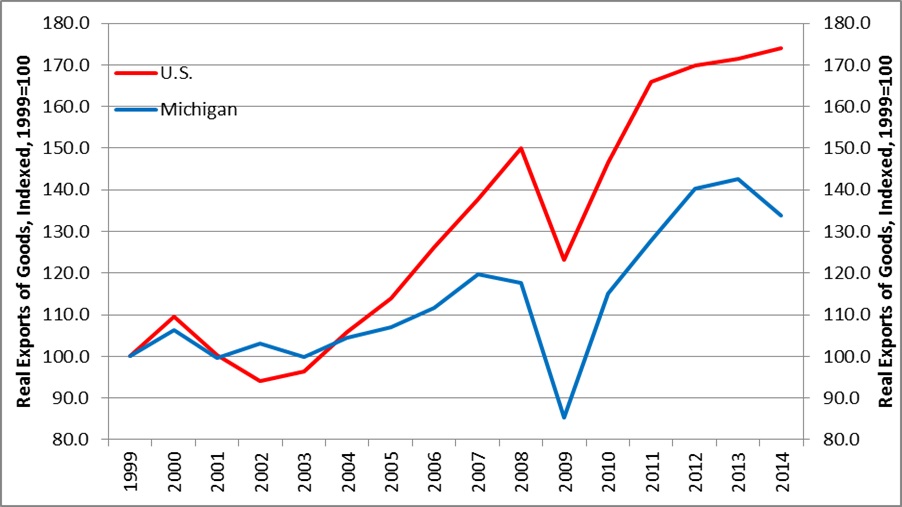
Much of this improvement can be attributed to rising Michigan exports since the end of the recession. Using data provided by the U.S. Department of Commerce’s TradeStats Express,3 then deflating it with the Personal Consumption Expenditures Price Index from the U.S. Bureau of Economic Analysi,4 I generated the two charts below. They both show that Michigan’s real exports of goods fell sharply in 2009 because of the Great Recession before rebounding strongly in 2010. Like Michigan’s exports, U.S. real exports of goods rebounded sharply in 2010 and grew each year afterward, albeit at slower rates relative to those of the state. But this pattern persisted only through 2013: Michigan’s real exports of goods fell 6.2% in 2014, while U.S. real exports of goods grew 1.4% that year.
Chart 1. Michigan Real Exports of Goods, 1999–2014
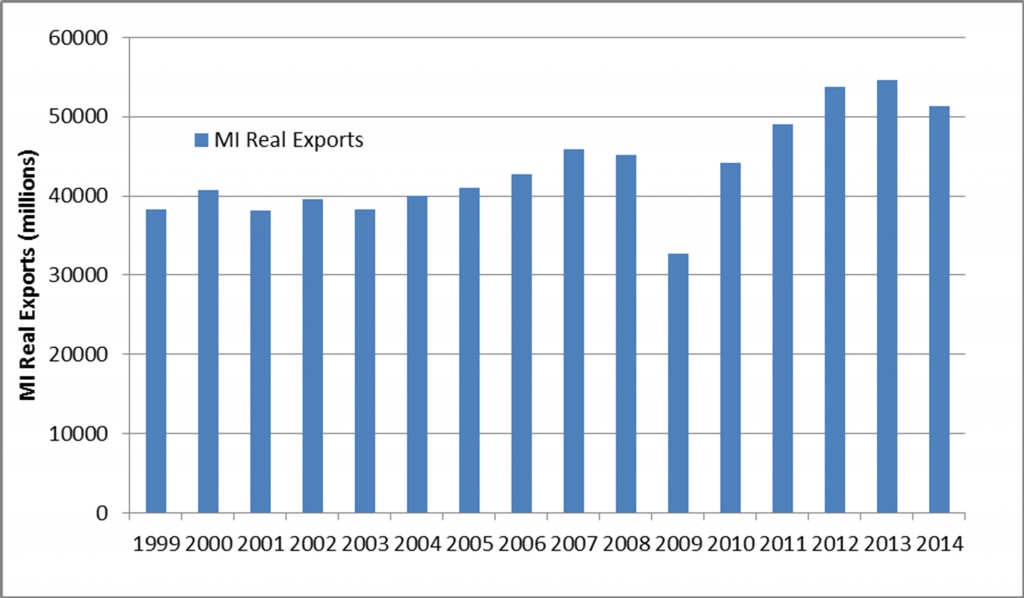
Chart 2. Real Exports of Goods, U.S. & Michigan, 1999=100
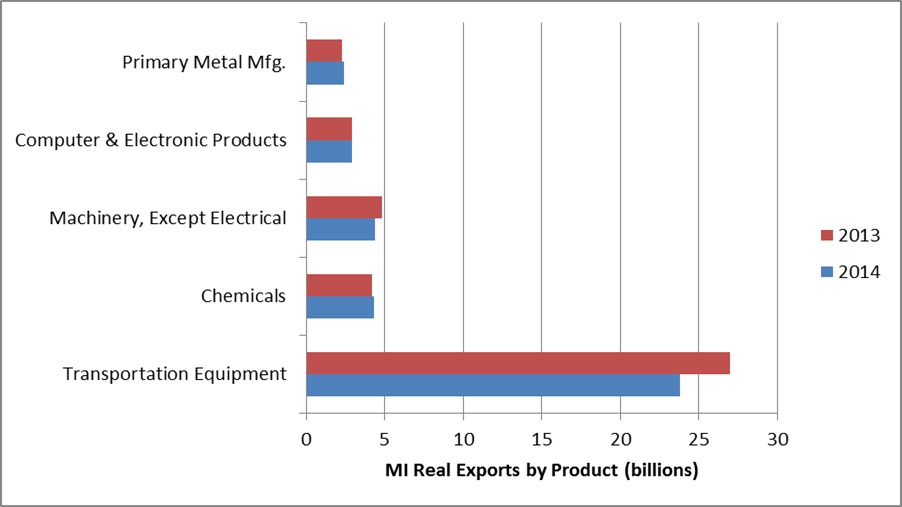
While pullbacks in Michigan’s real exports occurred in multiple sectors in 2014, the largest one was seen for transportation equipment. The chart below shows the change in real exports in 2014 relative to 2013 for the top five categories of goods by share of Michigan real exports. From that chart, one can calculate that transportation equipment accounted for just under half of Michigan’s real exports in both years. Michigan’s transportation equipment exports decreased $3.2 billion from 2013 to 2014; this drop made up the bulk of Michigan’s $3.4 billion decline in total real exports. Meanwhile, automotive exports from the rest of the U.S. did not experience such a decline over the same period.
Chart 3. Michigan Real Exports of Goods, Selected Sectors, 2014 vs. 2013
Outlook for 2015
Michigan’s exports may rebound in 2015 given the somewhat more buoyant outlook for the global economy. According to the International Monetary Fund’s (IMF) latest global forecast, the world economy is expected to grow 3.5% this year, with more growth expected among advanced economies. Of Michigan’s five largest trading partners, all expect to see positive economic growth in 2015, with three anticipating accelerations in economic activity. However, the strengthening U.S. dollar may slow export growth, especially since the U.S. dollar has significantly appreciated against the Japanese yen and the euro. But if Michigan’s transportation exports continue to decrease, another question would have to be considered: What is the story behind transportation equipment exports from Michigan relative to those from the rest of the U.S.?
Footnotes
1 See the Michigan Economy Index (MEI). A zero value for the index indicates that the Michigan economy is expanding at its historical trend rate of growth; negative values indicate below-average growth; and positive values indicate above-average growth. A zero value for the Relative MEI indicates that the Michigan economy is growing at a rate historically consistent with the growth of the national economy; positive values indicate above-average relative growth; and negative values indicate below-average relative growth.
2 Author’s calculations using data from the U.S. Bureau of Labor Statistics, available online.
3 Trade data are provided by the U.S. Department of Commerce, Census Bureau, Foreign Trade Division. All state export statistics are drawn from the Origin of Movement (OM) series compiled by the Foreign Trade Division of the U.S. Census Bureau. The series credits export merchandise to the state where the goods began their final journey to the port (or other point) of exit from the United States, as specified on official U.S. export declarations filed by shippers. The OM can be either the location of the factory where the export item was produced or, in many cases, the location of a distributor, warehouse, or cargo processing facility. Further details are available here and here.
4 More information is available online.


