Results from a Special Chicago Fed Survey of Business Conditions on the Impact of Covid-19
Summary
In late April, the Federal Reserve Bank of Chicago collaborated with the executive associations of the chambers of commerce in its five District states (Illinois, Indiana, Iowa, Michigan, and Wisconsin) to conduct a survey on the impact of the Covid-19 pandemic on chamber members’ businesses. This survey was based on the methodology of the broader Chicago Fed Survey of Business Conditions (CFSBC). The new survey asked questions about the impact of the outbreak so far and expectations for the coming months. The survey was voluntary, and we primarily heard from small businesses in industries heavily affected by Covid-19.
The main results are as follows:
- Many small businesses in the Midwest are experiencing the negative effects of the massive global economic shock caused by the Covid-19 pandemic.
- The new social distancing requirements necessary to slow the virus’s spread have put significant capacity constraints on many businesses’ operations.
- Many of the small businesses we heard from—especially those in the entertainment, tourism, recreation, restaurant, and retail sectors—are in danger of financial distress.
- There is substantial uncertainty about what will happen over the next few months and years.
These results show that many businesses are facing very difficult challenges that are unlikely to go away quickly.
Who responded
We received 670 responses from chamber of commerce members in Seventh District states. Respondents overwhelmingly represented small businesses. About 60% of the respondents were from firms with fewer than ten employees and another 25% were from firms with ten to 49 workers. Only 16 respondents (2%) were from firms with more than 500 employees.
Respondents came from a variety of industries. Table 1 shows that the highest shares were in the professional services, nonprofit, and retail sectors. The distribution of respondent industry shares does not closely match the distribution of industry shares in the District economy (nonprofits are overrepresented, for example), and we received only a few responses from certain industries. The limitations of our respondent base means that aggregate results from the survey are not likely to be representative of the Midwest economy as a whole. For this reason, we present results almost exclusively by industry.
Table 1. Distribution of respondents’ industries
| Industry | Responses | Percent |
|---|---|---|
| Professional services | 146 | 22 |
| Nonprofit | 127 | 19 |
| Retail | 78 | 12 |
| Entertainment, tourism, and recreation | 69 | 10 |
| Manufacturing | 55 | 8 |
| Restaurant | 50 | 7 |
| Real estate | 33 | 5 |
| Finance | 30 | 4 |
| Transportation and wholesale | 26 | 4 |
| Agriculture | 22 | 3 |
| Construction | 19 | 3 |
| Technology | 15 | 2 |
| Total | 670 | 100 |
We heard from businesses in all five Seventh District states, and table 2 shows a breakdown of responses by state. While each state is well represented as measured by the total number of responses, lack of industry coverage limits our ability to make state-by-state comparisons. So again, we primarily make industry comparisons, after pooling responses across states. We show in this post’s appendix that responses are generally quite similar across states.
Our survey’s respondents represent a crucial group of participants in the economy: small businesses—with many in sectors that have been strongly affected by the Covid-19 outbreak.
Table 2. Distribution of respondents’ states
| State | Responses | Percent |
|---|---|---|
| Illinois | 318 | 47 |
| Indiana | 133 | 20 |
| Iowa | 61 | 9 |
| Michigan | 59 | 9 |
| Wisconsin | 95 | 14 |
| Did not answer | 4 | 1 |
| Total | 670 | 100 |
What happened in March and April?
Economic activity in the United States declined substantially in March and April as a result of the Covid-19 pandemic. U.S. payroll employment, for example, fell by 14%. In line with the aggregate data, survey respondents generally reported major drops in business. We asked respondents to rate how a variety of performance indicators changed during March and April on a seven-point scale that ranged from large decrease to large increase. Table 3 shows that in every industry, at least 50% of respondents reported a medium or large decrease in revenues. Table 3 also makes clear that some industries were hit harder than others. At least 40% of those in the restaurant, entertainment, and retail sectors indicated they had shut down temporarily; nearly all reported large or medium declines in revenues; and at least 60% reported large or medium drops in employment and hours per worker. Doing business in these industries typically involves a lot of face-to-face interaction, sometimes in large groups. And many businesses in these sectors were deemed nonessential by governments and were required to close temporarily. In contrast, the impacts of the Covid-19 pandemic were smaller for industries such as finance and technology, which are more amenable to telecommuting, and for industries such as transportation and wholesale, which were largely deemed essential.
Table 3. Change in selected performance indicators since March 2020
| Large or medium decrease (%) | |||||
|---|---|---|---|---|---|
| Industry | Revenues | Workers | Hours | Temp. shutdown (%) | >50% of workers at home (%) |
| Restaurant | 96 | 83 | 90 | 43 | 14 |
| Entertainment, tourism, and rec. | 94 | 63 | 71 | 69 | 26 |
| Retail | 86 | 62 | 71 | 56 | 6 |
| Real estate | 83 | 20 | 38 | 19 | 67 |
| Manufacturing | 80 | 33 | 51 | 20 | 6 |
| Nonprofit | 76 | 29 | 39 | 25 | 67 |
| Construction | 74 | 50 | 67 | 33 | 29 |
| Professional services | 72 | 28 | 42 | 29 | 43 |
| Technology | 67 | 15 | 17 | 7 | 71 |
| Transportation and wholesale | 65 | 18 | 32 | 4 | 26 |
| Finance | 61 | 19 | 19 | 0 | 37 |
| Agriculture | 50 | 5 | 21 | 12 | 16 |
What will reopening look like for temporarily closed businesses?
As table 3 shows, many businesses reported that they were temporarily closed (only two of the 670 respondents said they had closed permanently). To understand how businesses that were closed expected to adjust their operations upon reopening, we asked about their plans for keeping employees and customers safe. Respondents from across all the sectors commonly indicated they had plans to do the following:
- Provide hand sanitizer stations
- Disinfect surfaces after customer use
- Require appointments before customers come in
- Do regular deep cleaning
- Provide personal protective equipment
- Require masks
- Check temperatures
- Enforce social distancing
- Train workers on new safety protocols
- Have employees telework as much as possible, and alternate days when they come into the office
Some plans were more industry-specific. For example, temporarily closed manufacturers planned to stagger stop and start times of shifts. Retailers and restaurants planned to install plexiglass at points of sale, use contactless payment methods, offer curbside pickup, and limit customer traffic levels. Recreation centers planned to put extra space between equipment and limit class sizes. Campgrounds planned to cancel public events and leave some sites empty. And beauty salons indicated that chairs between designated customer stations would be left empty.
How do social distancing requirements affect the businesses’ operating capacities?
The operational changes that businesses have to make to achieve social distancing are costly and may reduce capacity. For example, if beauty salons must leave chairs empty, they cannot serve as many customers per hour as they used to, so there are fewer customers to spread fixed operating costs across.
To understand the burden social distancing requirements put on businesses, we asked about how different degrees of social distancing affect businesses’ capacity (table 4) and financial health (table 5). We received fewer complete responses to these questions, so we only show results for a limited set of industries from which we received a large number of responses.
In our survey, we defined four social distancing regimes. Starting with the most restrictive, they are as follows: 1) a stay-at-home order for nonessential workers; 2) “strict” social distancing, along with a customer and employee gathering size limit of ten; 3) “moderate” social distancing, along with gathering size limit of 50; and 4) “limited” social distancing, along with no gathering size limit. Table 4 summarizes respondents’ answers by showing the share of companies that report that they could operate at 75% capacity or higher under the four social distancing regimes. The results are consistent with it being harder for industries that require more face-to-face contact to operate at full capacity: Retail, entertainment, tourism, and recreation companies are the least likely to be able to operate at 75% capacity or greater under any of the four regimes. Over 40% of respondents in the entertainment, tourism, and recreation sectors indicated they could not operate at such a capacity even under the least restrictive social distancing regime. Many nonprofits, which often depend on large group events for revenues, also said they would struggle to operate at full capacity under moderate or limited social distancing regimes. That said, a large share of manufacturers and professional service firms expected to be able to operate at near full capacity under a moderate social distancing regime.
Table 4. Share of companies that can operate at 75% capacity or higher under different social distancing constraints
| Industry | Essential workers only | "Strict" social distancing, gathering size limit of ten | "Moderate" social distancing, gathering size limit of 50 | "Limited" social distancing, no gathering size limit |
|---|---|---|---|---|
| Retail | 4 | 36 | 44 | 72 |
| Entertainment, tourism, and rec. | 13 | 25 | 28 | 59 |
| Manufacturing | 16 | 42 | 74 | 90 |
| Professional services | 38 | 62 | 70 | 80 |
| Nonprofit | 38 | 41 | 52 | 76 |
The capacity constraints that social distancing requirements put on businesses are likely to raise costs and hurt profitability. We asked about how long respondents expected their businesses to be able to operate under different social distancing regimes before becoming financially distressed (which we defined as low on cash or insolvent). Table 5 shows that according to the survey respondents, the businesses in industries least able to operate near full capacity were also the ones most likely to be in financial distress in three months. And for many businesses, the difficulties do not go away as the social distancing requirements start to ease. Under moderate social distancing requirements with gathering size limits of 50, the vast majority of restaurants and entertainment, tourism, and recreation companies are expected to be in serious financial trouble after three months. In addition, the majority of respondents in those industries expect trouble even under limited social distancing requirements. Respondents reported that it is very difficult to make a profit when operating at less than full capacity, as many will have to do when any degree of social distancing is required. A number of respondents in the entertainment, tourism, and recreation industries who said that their business peaks during the summer worried that a “lost season” could put them out of business. The situation is better for manufacturers—over 60% of the respondents from the manufacturing sector indicated they should be able to avoid financial distress for at least three months while operating under moderate social distancing requirements.
Table 5. Share of companies that would be in financial distress after three months under different social distancing constraints
| Industry | Essential workers only | "Strict" social distancing, gathering size Limit of ten | "Moderate" social distancing, gathering size limit of 50 | "Limited" social distancing, no gathering size limit |
|---|---|---|---|---|
| Restaurant | 100 | 96 | 88 | 64 |
| Entertainment, tourism, and rec. | 97 | 87 | 79 | 50 |
| Retail | 87 | 71 | 65 | 52 |
| Nonprofit | 78 | 69 | 57 | 40 |
| Manufacturing | 78 | 69 | 38 | 28 |
| Professional services | 77 | 62 | 51 | 35 |
What is the outlook for respondents’ businesses?
We do not know how quickly we will move through different reopening phases; and in recognition of the high level of uncertainty, we asked what respondents expect to happen to their businesses over a short period—from the end of April to the end of July 2020. Table 6 shows that survey respondents generally expect major changes over these three months. A majority in every industry except finance and agriculture expect large or medium declines in revenues. Expectations of how employment will change are relatively better. A majority in most sectors do not expect to make additional sizable reductions in their labor forces; the exceptions are those in the entertainment, tourism, recreation, restaurant, and retail industries.
Table 6. Expected change in selected performance indicators from the end of April to the end of July 2020
| Large or medium decrease (%) | |||
|---|---|---|---|
| Industry | Revenues | Workers | Hours |
| Entertainment, tourism, and rec. | 92 | 63 | 70 |
| Restaurant | 85 | 61 | 67 |
| Retail | 83 | 50 | 57 |
| Real estate | 81 | 15 | 14 |
| Transportation and wholesale | 81 | 29 | 35 |
| Technology | 78 | 25 | 14 |
| Manufacturing | 77 | 30 | 49 |
| Nonprofit | 73 | 28 | 28 |
| Professional services | 70 | 18 | 31 |
| Construction | 55 | 9 | 36 |
| Finance | 45 | 14 | 15 |
| Agriculture | 42 | 0 | 0 |
Given the substantially lower revenues that many companies expect in the coming months, we asked respondents to rate their level of concern about a range of financial health indicators for businesses. Table 7 shows that as expected, entertainment, tourism, recreation, restaurant, and retail respondents were most likely to be very concerned about the financial health of their companies, in terms of having an adequate cash balance, not accumulating too much debt, and maintaining solvency. Across all industries, fewer companies were concerned about their access to credit from lenders or suppliers. Generally, more firms across all sectors were concerned about collecting payables.
Table 7. Share of respondents "very concerned" about different financial health indicators over the next three months
| Industry | Adequate cash balance | Too much debt | Maintain solvency | Collect payables | Get credit from suppliers | Get credit from lenders |
|---|---|---|---|---|---|---|
| Entertainment, tourism, and rec. | 80 | 71 | 64 | 30 | 34 | 35 |
| Restaurant | 77 | 68 | 73 | 27 | 37 | 39 |
| Retail | 71 | 61 | 60 | 42 | 31 | 39 |
| Manufacturing | 58 | 45 | 34 | 56 | 28 | 27 |
| Construction | 57 | 50 | 43 | 64 | 21 | 29 |
| Nonprofit | 53 | 30 | 36 | 57 | 15 | 22 |
| Professional services | 52 | 41 | 33 | 37 | 11 | 17 |
| Transportation and wholesale | 50 | 42 | 32 | 45 | 23 | 14 |
| Real estate | 43 | 35 | 27 | 48 | 15 | 29 |
| Agriculture | 38 | 38 | 27 | 31 | 13 | 19 |
| Technology | 33 | 50 | 33 | 55 | 18 | 18 |
| Finance | 17 | 14 | 9 | 41 | 6 | 0 |
Overall, numerous respondents anticipate substantial challenges for their businesses in the coming months. Many expect a further drop in sales on top of already large declines, and many anticipate having to face serious financial trouble.
When will things return to normal?
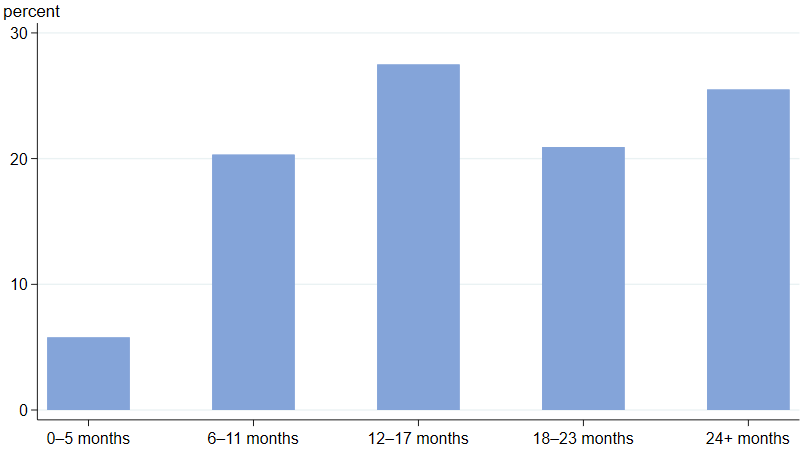
For the economy to return to normal, we will need an effective treatment or vaccine for Covid-19. No one knows when we will have either or how long it will take for the economy to fully recover once either is in place. We asked our respondents to provide their views on the return to normal, and we received a wide range of perspectives. Figure 1 shows that about 25% of respondents expect the U.S. economy to recover in under a year, about 50% expect it to recover in between one and two years, and 25% expect it to take two or more years to recover. While there is a lot of disagreement, few project the economy to bounce back completely within the three-month time frame that we based our financial distress question on—another indicator that many respondents anticipate their businesses will be in serious financial trouble over the coming months.
Figure 1. Expected number of months until the U.S. economy returns to its pre-Covid-19 level
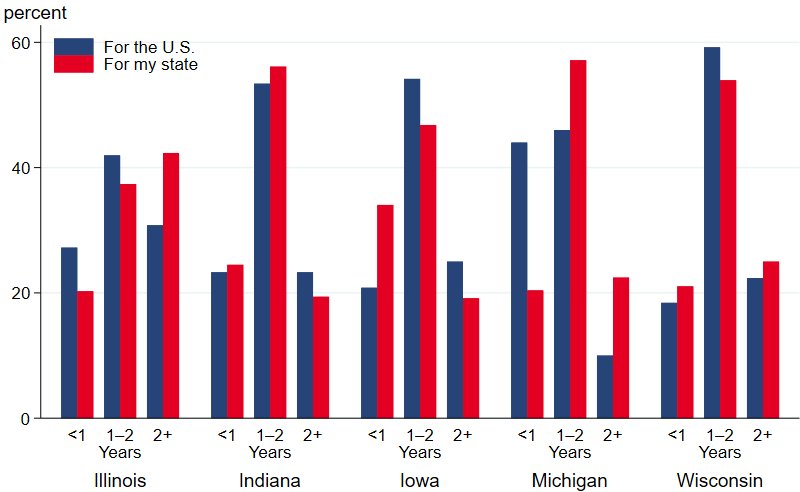
Finally, we asked respondents to provide their views on how long they think it will take their home state to recover. Figure 2 consolidates the categories in figure 1 and breaks out responses by the five Seventh District states. There are a few important things to highlight in the figure. First, respondents in Michigan are generally more optimistic about how quickly the U.S. economy will recover than those from the other states. Second, respondents in Illinois and Michigan anticipate their states will take longer to recover than the U.S. as a whole. And third, respondents in Iowa expect their state will recover faster than the country as a whole. It is possible that these results reflect differences in the relative size of the Covid-19 outbreak in each state.
Figure 2. Expected number of years until the U.S. and state economies return to their pre-Covid-19 levels
Conclusion
The results of this special Chicago Fed Survey of Business Conditions show that many small businesses in the Midwest have been adversely affected by the massive global economic shock caused by the Covid-19 pandemic. The new social distancing requirements necessary to slow the virus’s spread have put significant capacity constraints on businesses’ operations. As a result, many of the small businesses we heard from—especially those in the entertainment, tourism, recreation, restaurant, and retail sectors—are very concerned about cash, debt, and solvency. There is substantial uncertainty about what will happen over the next few months and years, but what is clear is that many businesses are concerned about severe challenges they will face on the road ahead.
Appendix
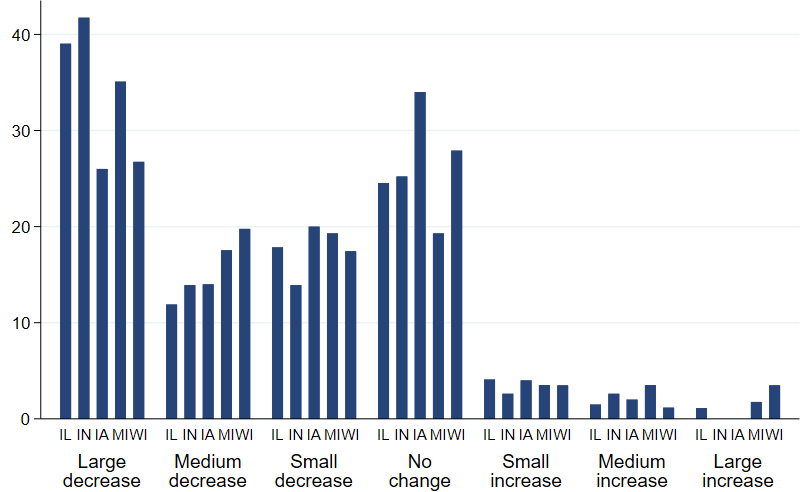
The following figures are examples that show that there is little variation across Seventh District states in how respondents answered survey questions.
Figure A1. Distribution of change in revenues since March 1, 2020, across states

Figure A2. Distribution of change in employment since March 1, 2020, across states
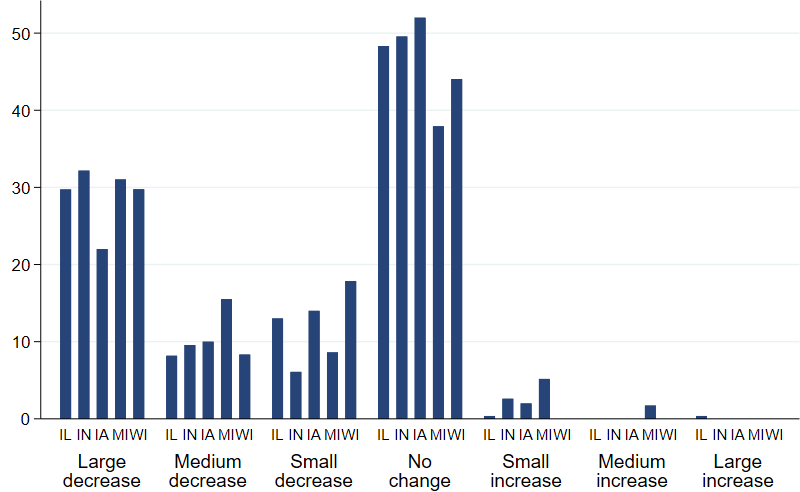
Figure A3. Distribution of change in hours per worker since March 1, 2020, across states