Job Recovery in the Seventh District
The resumption of growth in the U.S. economy, beginning in mid-2009, has been welcome news. However, the pace of recovery has been disappointing, relative to the severity of the recession. Following a period in which U.S. output shrank 4.1 percent from the fourth quarter of 2007 to the second quarter of 2009, the economy did not regain its former size until the fourth quarter of 2010. The deep recession and relatively slow recovery have left behind startling numbers of unemployed working age adults. According to the Household Survey of employed and unemployed, 13.7 million people reported they were unemployed during the first quarter of 2011, double the number reported during the fourth quarter of 2006.
Growth in employment has resumed, especially in recent months. Outside of the government sector, payroll jobs have grown an average of 138,000 per month over the past year, and 188,000 per month over January, February, and March of this year. We can characterize this performance as a mildly encouraging start toward repairing a very large deficit in employment.
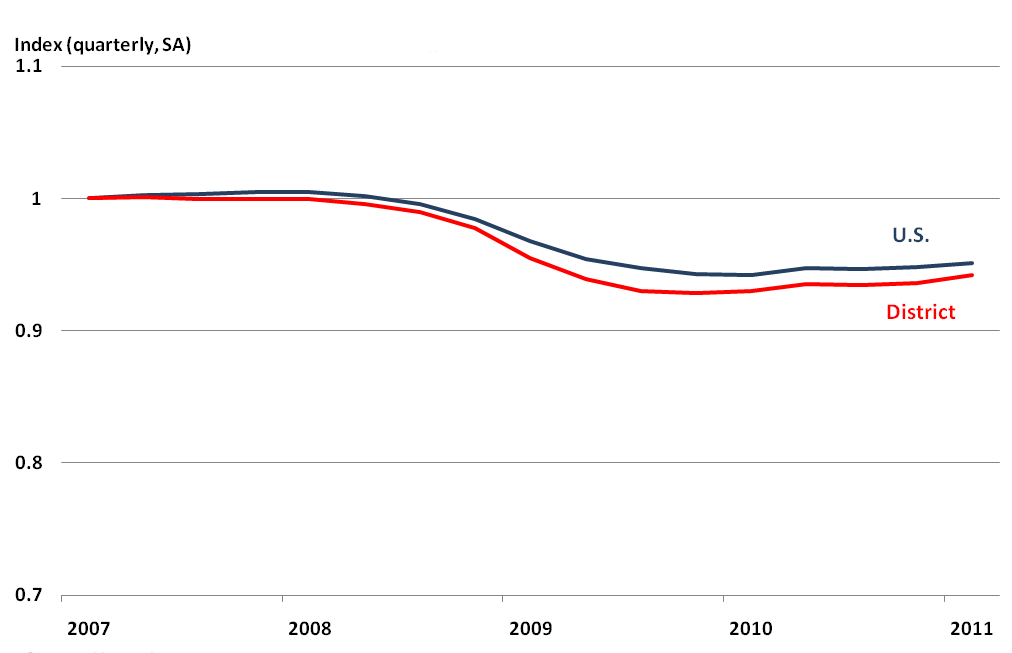
To see the extent of recovery so far, the chart below indexes payroll employment back to the first quarter of 2007, near the peak of employment in the Seventh District states. From that time, payroll jobs declined 7.2 percent in the Seventh District and 6.2 percent in the U.S. From its low point, the U.S. has regained 0.9 percent in payroll employment. The Seventh District states have recovered more strongly, regaining 1.4 percent from the trough.
As of the first quarter of this year, Michigan, which had the largest decline in employment in the District since the start of the recession, now ranks first in the District and fifth in the nation in household employment growth on a year-over-year basis. Illinois, Wisconsin, Indiana, and Iowa rank 15th, 28th, 31st, and 33rd, in the nation, respectively.
Chart 1. Total payroll jobs
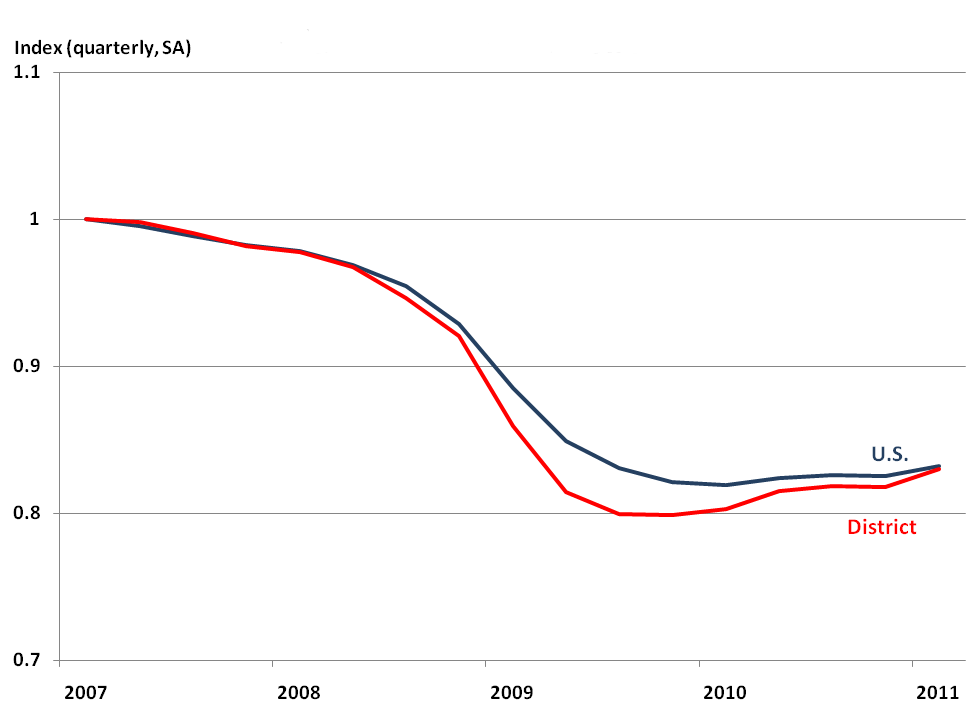
The District’s relatively strong recovery is partly explained by its relatively steep descent. Our region’s economy is tilted toward durable goods manufacturing— including autos and machinery, which fall precipitously during U.S. economic downturns. However, on the upside, manufacturing tends to bounce back more rapidly. It has done so again over the recent recovery as retailers and wholesale establishments began rebuilding their inventories in response to revived expectations of sales. Exports of manufactured goods abroad also contributed, as the world economy pulled out ahead of the U.S. recovery. This influence of durable goods can be seen in the chart below; U.S. manufacturing payroll jobs declined steeply during the recession, but have been rising at a healthy clip during the recovery.
Chart 2. Manufacturing payroll jobs
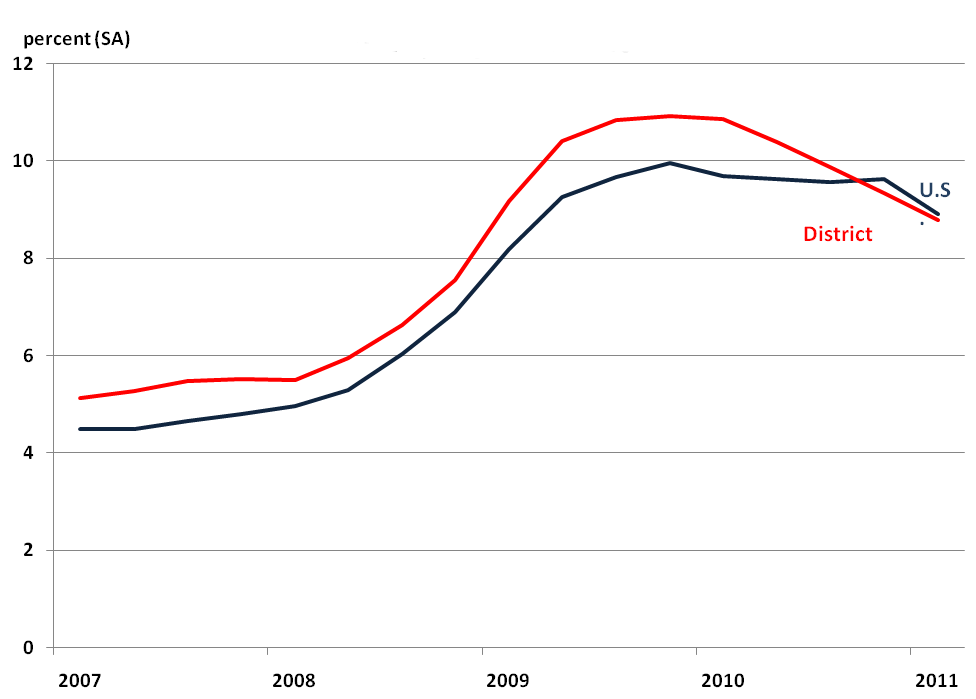
Job growth has made a down payment toward lowering unemployment in the Seventh District. Per the chart below, both U.S. and Seventh District unemployment rates have been falling throughout 2010 and into the early part of 2011. Seventh District unemployment has fallen more steeply; it has now converged on the U.S. level, following several years of above-average rates.
Chart 3. Unemployment rate
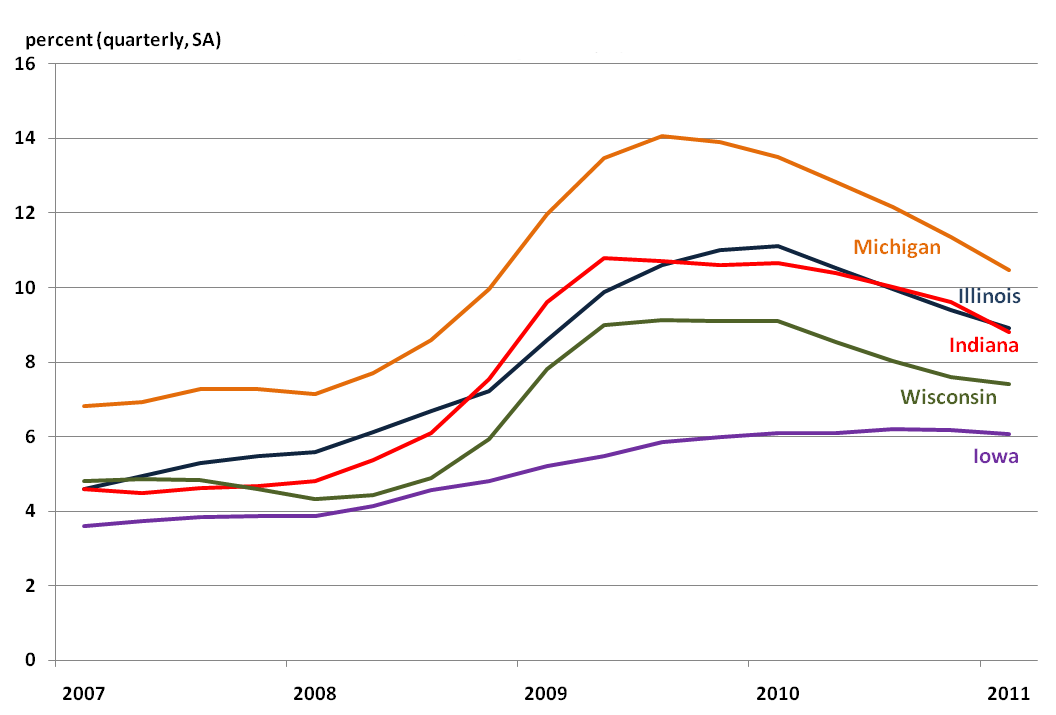
Unemployment rates have fallen in all five District states (below), with broad variation among them. Although the automotive sector’s recovery has exerted significant downward pressure on Michigan’s unemployment rate, it remains the highest in the District (10.3 percent). With 6.1 percent unemployment, Iowa’s rate is the lowest in the District, owing to its concentrations in production agriculture, food processing, and export-oriented agricultural machinery.
Chart 4. Unemployment rate
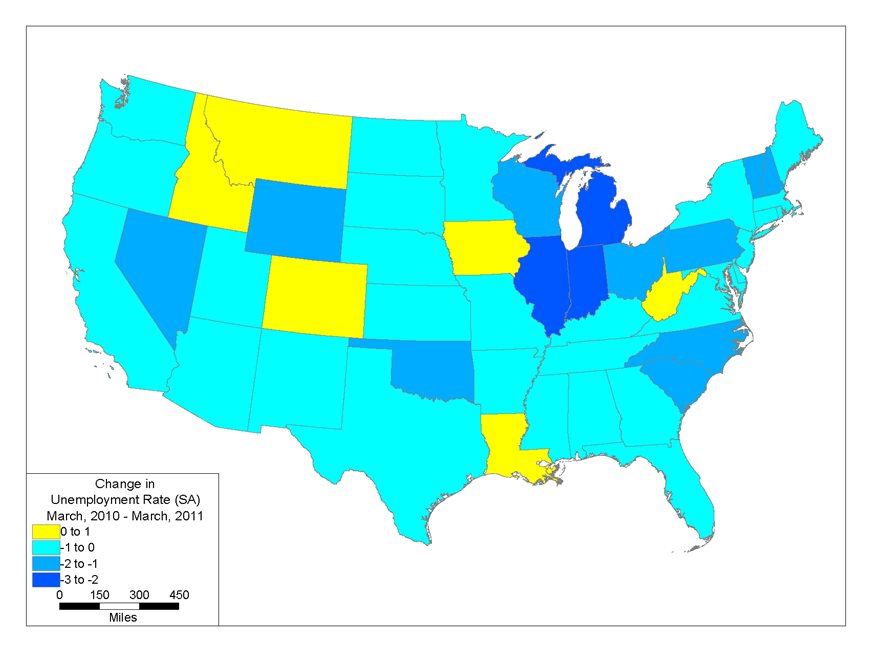
As a group, the District states of Wisconsin, Illinois, Michigan, and Indiana have experienced steeply declining unemployment rates over the past year (map below). Gains in manufacturing activity, along with related services and transportation, have led employment gains here and eastward throughout the Midwest industrial belt.
Map 1
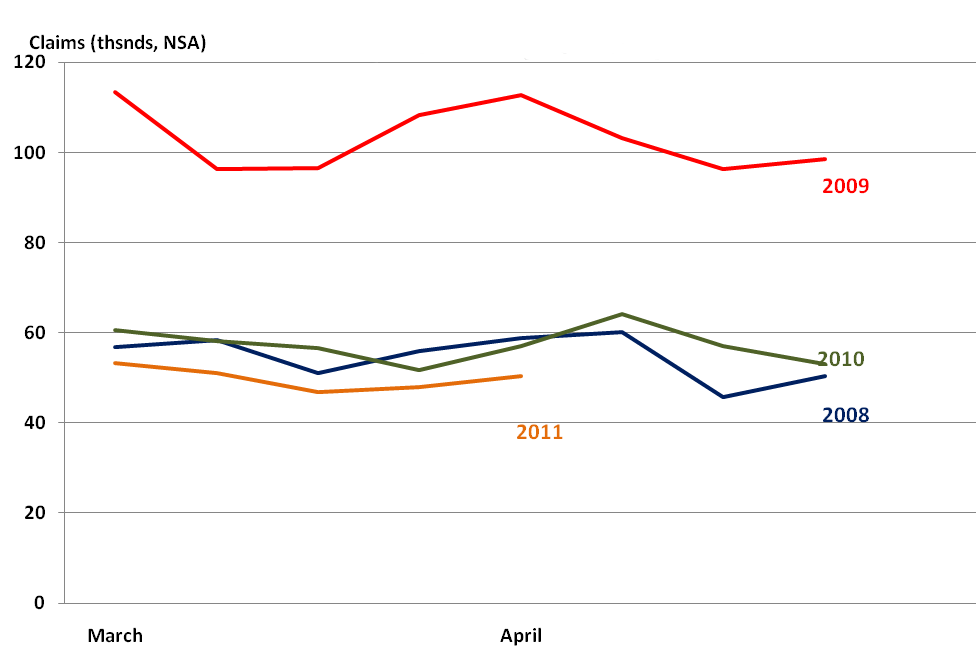
Declining unemployment rates are a positive development. However, while “job destruction” levels appear to have abated, “job creation” levels have yet to rebound significantly. Chicago Fed Economist Lisa Barrow finds that the largest factor in recent national unemployment rate declines has been a reduction in the number of workers transitioning from employment to unemployment, rather than job growth. The Chicago Fed Letter reports that, from November 2010 to March 2011, the pace at which employed workers became unemployed slowed markedly. In the Seventh District, this trend is similarly evident from data reporting workers who file initial claims for unemployment insurance—another measure of “job destruction.” As illustrated below, in recent months initial claims for unemployment insurance have been running below year-ago levels and far below the worst months of the recession in 2009.
Chart 5. Initial claims (5 states)
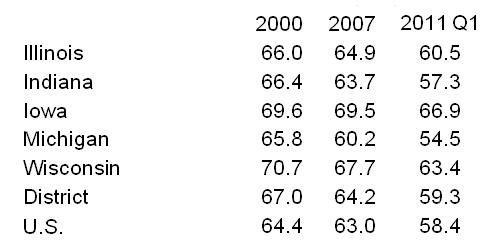
Despite the labor market progress to date, there is ample room for growth in employment among persons of working age. We can see this if we compare the proportion of the working age population (16 years of age and older) who are currently employed with the 2000 level (see the table below). The employed status of the population lies well below normal. In the first quarter of 2011, fewer than 6 in 10 of those of working age counted themselves as employed.
Table 1. Employment/population ratio (16+ years, percent)
Labor market indicators suggest that, as economic recovery continues to unfold, employers will increasingly shift toward net hiring. Many employers are reaching the limit of the sales and production gains they can achieve using their existing work forces. In particular, measures of the average hourly workweek continue to tighten in both the District and in the nation so that, barring rapid growth in productivity, employers will need to hire in order to meet heightened demand for goods and services.1 Data that more closely reflect actual hiring decisions also portend a potential hiring upswing. The national survey of job openings and labor market turnover (JOLTS) reports a strong growth in job openings—nearly 3 million since the trough of the recession.2
Footnotes
1 These data are reported by the Bureau of Labor Statistics (BLS) covering nonproduction nonsupervisory workers in the private nonfarm sector. Available online.


