

The following publication has been lightly reedited for spelling, grammar, and style to provide better searchability and an improved reading experience. No substantive changes impacting the data, analysis, or conclusions have been made. A PDF of the originally published version is available here.
Our population continues to move away from rural areas and into metropolitan areas. As it does so, the shape and governance of metropolitan areas are changing in several significant ways. The density of our living and working space is falling as jobs and people continue to spread outward from the central city. In the process, the central city typically loses population, especially middle class residents, to suburban communities. And as population leaves the central city, a growing share of residents is being represented by small suburban governments plus a multitude of overlapping “special district” governments.
For much of the population, the outward spread of urban housing and jobs reflects a rising standard of living brought about by this century’s technological advances, including quick and comfortable auto travel and enhanced telecommunications. However, many observers believe that this outward spread is produced not only by technological change but also by public policies, regulations, and tax codes. For example, policies that enable or encourage local government fragmentation in metropolitan areas can contribute to overexpansion and lead to land use decisions that are not in the best interests of the overall metropolitan area. This Chicago Fed Letter describes such changes that are taking place in the nation’s large metropolitan areas; it also outlines the attendant policy issues.
Growth or sprawl?
U.S. metropolitan area population has relentlessly spread out throughout this century. Today, this fact is apparent in the many abandoned businesses and houses within our central cities even as the outer boundaries of the developed metropolitan area move inexorably farther from the center. These observations reflect more than population growth and abandonment of central cities. In fact, the growth of urbanized land area within metropolitan boundaries has generally outpaced population growth; that is, people and jobs are moving to areas with progressively lower densities (see figure 1).
1. Population density of urbanized areas
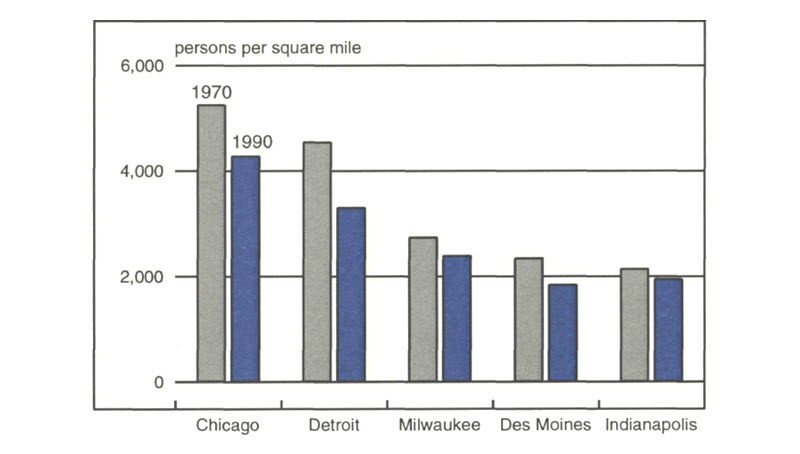
By itself, lower density is little cause for concern. There are several reasons to expect that consumption of housing (and its associated land) should grow rapidly in metropolitan areas. Even a stagnant population would normally experience increased demand for housing—both land and structures—with rising incomes. In addition, the changing demographics of U.S. population have favored the growth in housing. Average household size decreased from 3.3 to 2.6 persons from 1960 to 1991, for example, as baby-boomers reached adulthood, and as the number of adults living alone increased because of higher divorce rates, delayed age of first marriage, and an increasing incidence of older adults who maintain their own household.1
Jobs have followed residences to the suburbs, since jobs follow workers and a growing residential population demands ready access to retail and personal services. Industrial and distribution jobs have also been pulled outward by changing technology and infrastructure of inland freight transportation. Rail and water transportation has increasingly given way to truck transportation, which can more easily accommodate remote manufacturing sites.
Despite these unobjectionable reasons behind urban deconcentration, many observers believe that public policies have pushed cities toward undesirable “sprawl.” As examples, they point to environmental regulations that are harshest on long-developed urbanized areas, a federal tax code that favors housing consumption, and a public finance system that allows motorists to evade the full costs of their driving.
Federal, state, and local governments have all subsidized auto travel in several ways. While motorists bear the costs of vehicle maintenance, time waiting in traffic, and gasoline, they do not bear the full costs of road-related services such as emergency vehicles, police and traffic control, or the auto-related court system, nor all the environmental problems that motor vehicles cause. Motor vehicle and road use taxes such as gasoline taxes, highway tolls, and vehicle license taxes are fashioned on the principle that motorists should pay their own way when they decide to drive. But by some estimates, fuel and vehicle taxes cover only 60% of the cost of building and maintaining roads.2 The end result is excessive vehicle use, along with the associated tendency toward sprawling land use.
Some part of urban sprawl has also been attributed to misguided environmental regulation. The 1980 Comprehensive Environmental Response, Compensation, and Liability Act (“Superfund”) attempted to accelerate environmental improvement by requiring cleanup of all contaminated sites and funding cleanup of the worst ones. However, older urban areas—where many contaminated sites are located—report disappointing results, and cleanup of the worst areas has fallen well short of expectations. At the same time, the pace of cleanup and redevelopment of less severely contaminated sites has perhaps been slowed rather than accelerated. By adding an uncertain assignment of liability and more stringent cleanup standards to contaminated sites, Superfund legislation has encouraged development—and perhaps contamination—in urban fringe and “greenfield” sites.
Incentives to purchase ever-distant suburban housing have also contributed to the movement outward. Several features of the federal tax code encourage the overconsumption of owner-occupied housing (and land) as a household’s income grows. The deductibility of home mortgage interest, coupled with deductibility of local property taxes on residential property, have been estimated to increase average housing consumption significantly through implicit subsidy of imputed rental costs.3 Similarly, home buyers moving up to more expensive homes tend to look outward toward distant suburban locations rather than purchasing closer in.4 Federal tax code allows capital gains on a home resale to be deferred as long as the owner purchases a next home of equal or greater value. Higher-priced homes tend to be located in suburban locations rather than closer in where land costs are often higher, and where the stock of homes may be older, smaller, and more depreciated.
In the process of accelerated disposal of both homes and commercial buildings near the center of metropolitan areas, the public capital stock—roads, bridges, water, and sewers—is also prematurely abandoned or underused. As development pushes outward toward the periphery of urban areas, public services are often duplicated, thereby adding to the overall cost of living in metropolitan areas.
More governments
State policies that have allowed suburban governments to flourish have also been implicated as contributing to urban sprawl.5 The nation’s central cities must provide services to the poor such as public aid, health care, education, and housing. These services are public goods in a broader sense than just being delivered by government. Provision of services to the poor is desired by and benefits the public at large; that is, residents throughout the metropolitan area place a value on having their neighbors provided for and given a chance to succeed economically. However, even though everyone benefits from the provision of services to the poor, those who can afford to often choose to migrate out to suburbs where the service costs they bear are their own, and not those of the less well-off. As people migrate for these financial reasons, population and jobs spread farther out while public services to the poor may be underprovided.
In earlier times, many central cities grew by annexing adjacent land; indeed, some cities such as Phoenix or Columbus, Ohio, are still expanding in this way. However, either by neglect or by state legislative intent, many central cities have become “landlocked,” or surrounded by suburban incorporation so that annexation is no longer possible. Because the boundaries of most central city governments cannot expand, the outward movement of people and jobs has meant that a larger fraction of metropolitan population resides under municipal governments or special service districts, which are generally less populous than central cities (see figures 2 and 3).
2. Number of governments
| Municipal | Special districts | |||
|---|---|---|---|---|
| Metropolitan area | 1957 | 1992 | 1957 | 1992 |
| Chicago | 248 | 315 | 333 | 605 |
| Des Moines | 42 | 41 | 21 | 38 |
| Detroit | 106 | 120 | 23 | 46 |
| Indianapolis | 70 | 62 | 28 | 136 |
| Milwaukee | 59 | 65 | 15 | 39 |
Source: U.S. Department of Commerce, Bureau of the Census, Census of Governments (various years).
3. Central city population as a share of metropolitan population
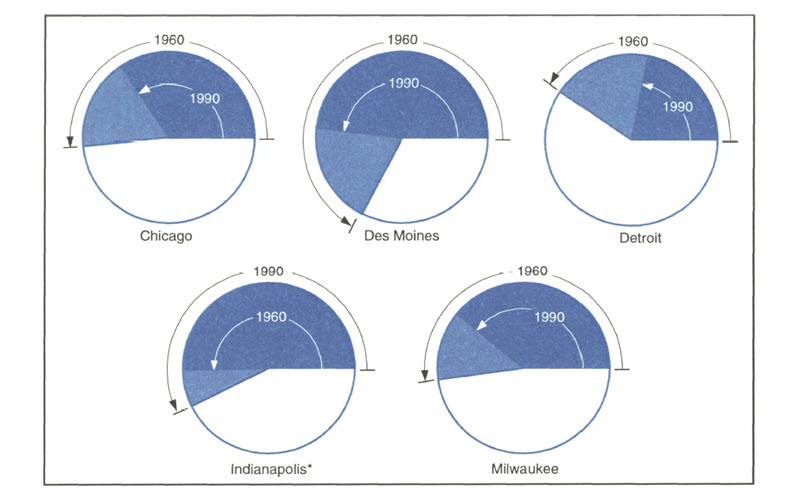
Source: U.S. Department of Commerce, Bureau of the Census, Census of Population (1960-90).
In some respects, the rising role of smaller metropolitan area governments may improve the quality of life in those areas. A government with fewer constituents may be more responsive to their needs, and if constituents tend toward homogeneity in their preferences, local government can customize services to fit local wants and conditions. However, smaller metropolitan governments can have a negative impact on local land use decisions. These decisions are frequently controlled by local “general purpose” governments such as towns, villages, or municipalities. The benefits (costs) of local land use decisions can extend well beyond the municipal boundaries, while the costs (benefits) are borne locally. If this is the case, local decisions made in the local interest may be detrimental to the region at large, or less beneficial than they should be. A common example is the siting of necessary public facilities such as landfills, incinerators, roads, and energy transmission facilities. Local communities frequently exhibit the so-called NIMBY response (“not in my backyard”), a desire to prevent the local siting of such facilities even when the broader geographic benefits may be considerable.
Conversely, small suburban areas often woo cleaner commercial, office, and retail developments because these developments may bring benefits in the form of local taxes and jobs. Such development strategies may not be optimal for neighboring communities, however, because the attendant jobs draw population to those communities, perhaps straining their resources for public services such as roads and schools. In the larger context of metropolitan growth, such locally based decision-making to encourage local development may thus perpetuate urban sprawl, to the detriment of the entire metropolitan area.
Concluding comments
As the configuration of our metropolitan areas markedly changes, many observers perceive that our land use and administrative choices may be misguided. If this is so, one can envision a variety of corrective policy responses. For instance, the federal tax code could be shifted gradually toward neutrality with respect to housing. A more even-handed approach to vehicle travel and infrastructure might be adopted. So too, those public services that must contain some subsidy to the poor, such as education, should probably be funded by state or federal governments (perhaps even through cash vouchers as in the current Milwaukee experiment) in order to neutralize the incentives of individuals to isolate themselves in remote suburbs. In those instances when costs or benefits spill over community boundaries, some problems may be solved by cooperative agreements among the many affected localities. In fact, such agreements have been reached in some instances, often facilitated by state government, regional planning associations, or voluntary associations of local governments. However, it is not yet clear whether voluntary negotiation among communities is altogether successful, given the difficulties and costs of bargaining.
As another approach to solving the problem of government fragmentation, some local governments have gone so far as to consolidate formally. The city and county governments of Indianapolis consolidated into one body in 1970. Other places have formally adopted tax-base sharing (Minneapolis-St. Paul) or have codified metropolitan-wide land use plans and restrictions (Toronto and Portland, Oregon). However, such arrangements are the exception rather than the rule; local community interests are often reluctant to cede land use authority to a central government.
Tracking Midwest manufacturing activity
Manufacturing output index (1987=100)
| April | Month ago | Year ago | |
|---|---|---|---|
| MMI | 131.9 | 131.1 | 119.6 |
| IP | 117.5 | 117.1 | 111.3 |
Motor vehicle production (millions, seasonally adj. annual rate)
| April | Month ago | Year ago | |
|---|---|---|---|
| Cars | 6.9 | 7.2 | 6.2 |
| Light trucks | 5.1 | 5.6 | 4.6 |
Purchasing Managers’ Surveys: net % reporting production growth
| May | Month ago | Year ago | |
|---|---|---|---|
| MW | 70.6 | 75.0 | 59.7 |
| U.S. | 61.3 | 62.7 | 54.8 |
Purchasing managers’ surveys (production index)
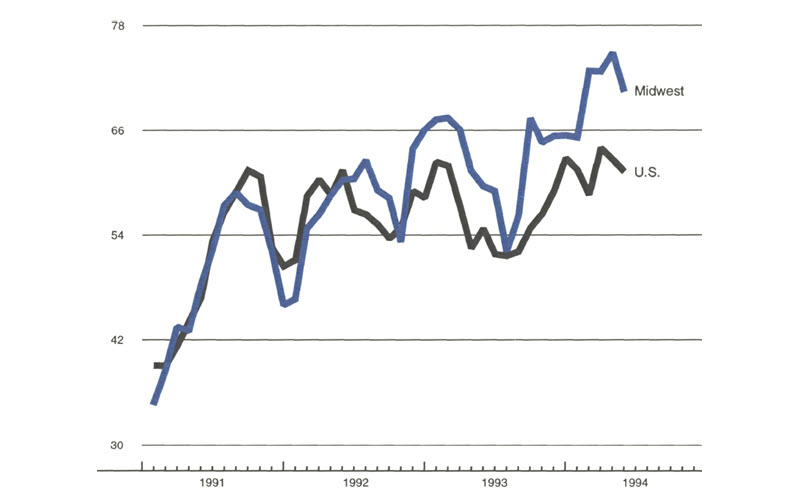
Midwest manufacturing activity continued to expand moderately in recent months, but somewhat more slowly than the robust pace earlier in the year. The purchasing managers’ survey in Chicago showed a modest pullback in industrial output growth in the area during May, while the Detroit survey depicted a somewhat sharper loss of momentum.
Light vehicle assemblies have declined during the second quarter on a seasonally adjusted basis, and preliminary schedules show no sign of a substantial rebound during the third quarter. These schedules are subject to revision, however, and if growth in retail sales by auto dealers reasserts itself in coming months, assembly schedules will most likely be revised upward.
Notes
1 See Glenn H. Miller, Jr., “Demographic influences on household growth and housing activity,” Economic Review, Federal Reserve Bank of Kansas City, September-October 1988, pp. 34-48.
2 See Elmer W. Johnson, Avoiding the collision of cities and cars, Washington, DC: American Academy of Arts and Sciences, 1993.
3 The impact of favorable tax treatment on costs of housing (and its effect on demand) has been demonstrated to vary with the rate of inflation. For a review, see Frank DeLeeuw and Larry Ozalle, “The impact of federal income tax on investment in housing,” Survey of Current Business, December 1979, pp. 50-61.
4 For an empirical study of the effect of deferred capital gains in Ohio’s seven major cities, see Thomas Bier et al., The IRS homeseller capital gain provision: Contributor to urban decline, Cleveland: Ohio Housing Research Network, 1994.
5 David Rusk, “Bend or die,” State Government News, February 1994, pp. 6-10.


