

The following publication has been lightly reedited for spelling, grammar, and style to provide better searchability and an improved reading experience. No substantive changes impacting the data, analysis, or conclusions have been made. A PDF of the originally published version is available here.
Some analysts use growth in the monetary base as an indicator of monetary policy and a guide to future economic activity and prices. This Fed Letter examines this practice, arguing that its validity depends on the Federal Reserve's operating procedure and the structure of reserve requirements applied against depository liabilities. This analysis suggests that the monetary base is not likely to be a very useful indicator of U.S. monetary policy. Moreover, changes in depository regulation and the behavior of depositors and depositories will probably continue to reduce the reliability of the monetary base as an indicator of monetary policy.
The basis for using the monetary base
Using the monetary base as an indicator of policy appears to stem from the standard textbook scenario where the monetary authority initiates monetary policy with a government securities transaction. A purchase (sale) of securities increases (decreases) reserves by an amount equal to the value of the securities. Transactions by depositories and depositors do not change the level of reserves, only redistribute them. Only changes in the public's currency holdings affect the level of reserves set by the monetary authority. An increase (decrease) in the public's currency holdings will lower (raise) reserves by an equal amount. Thus, the sum of reserves and currency (i.e., the monetary base) is determined by the monetary authority, while the distribution between reserves and currency is determined by the public. Since the monetary base is the amount of raw material provided by the central bank through its security transactions and is completely under the control of the central bank, it might seem like a good indicator of monetary policy.
However, closer examination indicates that there are difficulties in using the base as an indicator of monetary policy. A major difficulty is that the public's decision on the distribution of the monetary base between reserves and currency is quite important. To understand why this is important, consider that depositories would voluntarily hold some fraction of deposits in the form of reserves as a cushion against depositors' withdrawal of funds. If the quantity of reserves in the system is different from the fraction of deposits desired by depositories, then depositories will purchase or sell assets, extend or remove credit, and increase or decrease deposits and money until reserves account for the fraction needed. Thus, the public's decision on the distribution between currency and reserves also influences the level of deposits and money and the amount of credit supplied by depositories. Depending on this distribution, the same level of the monetary base can be consistent with many different levels of the sum of currency and depository liabilities, different levels of credit extension by depositories, and different levels of interest rates. The smaller the fraction of a given monetary base the public chooses to hold as currency, the greater the level of deposits and bank liabilities, the greater the extension of credit by the banking system, and the lower the interest rates.
While depositories would voluntarily hold reserves equal to some fraction of deposits, the Fed imposes specific percentage reserve requirements against various deposit categories. If these percentage reserve requirements are above the level depositories would voluntarily hold, then they act as a cap on the amount of deposits and the value of assets depositories can create out of every dollar of reserves. For example, at present, a 10% reserve requirement is applied against most checkable deposits (demand and other checkable deposits). This means that an additional dollar of reserves will support $10 in additional checkable deposits, and depositories will supply an additional $9 in funds to the credit market in creating these deposits.
The justification for imposing reserve requirements on deposits is that they allow the Fed to translate its control over the monetary base into control over a monetary measure thought to be related to future economic activity or prices. Yet, even casual examination of the construction of the most-cited monetary aggregates (Ml, M2, and M3) indicates that, under present reserve requirements, changes in the monetary base would not be closely related to changes in any of these aggregates. M2 and M3 both include time deposits on which there are no reserve requirements, so changes in these deposits do not change required reserves. Furthermore, all three of the monetary aggregates add currency and various subcategories of deposits dollar for dollar to determine the quantity of the monetary aggregate. Yet under fractional reserve requirements, a dollar shift of monetary base from (to) currency to (from) reserves will produce a multidollar increase (decrease) in depository liabilities and in the volume of credit supplied by depositories. Thus, under the present system of reserve requirements, a given quantity of monetary base can correspond to many different levels of any of the current money measures that are thought to be related to future activity and prices.
The intent of policy
Even if growth in the monetary base is not closely related to growth in any of these monetary aggregates, the base might still be useful as an indicator of monetary policy because it reveals the "intent" of policy. For example, if growth in the monetary base increases, analysts might interpret this as the Fed implementing a more expansionary policy. Even if shifts in public preferences temporarily negate the intended thrust of policy, analysts might still expect that future policy will be determined by the intent of the monetary authority, leading to increased growth in the monetary base until the desired economic expansion is achieved.
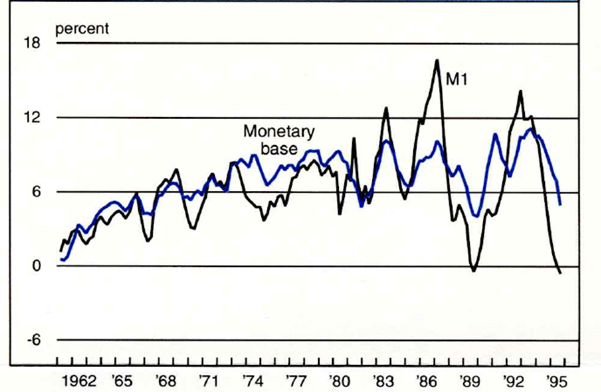
1. Year-over-year growth in M1 and the base
This analysis indicates that there are two problems with the textbook scenario of the role of the monetary base in policy. First, reserve requirements are not set so that changes in the monetary base correspond either to changes in the volume of credit extended by depositories or to changes in any of the monetary aggregates thought to be associated with future economic activity. Second, given the way monetary policy is carried out, the monetary base follows, rather than leads, changes in required reserves and the provision of credit by depositories.
Factors influencing the base
If the monetary base does not play its textbook role, how is the monetary base determined and what is its role in monetary policy? The preceding analysis indicates that, under a fed funds targeting policy, the Fed must move reserves to follow changes in required reserves. Since reserve requirements are applied only to demand deposits and other checkable deposits, required reserves essentially move with changes in these deposits. This means that the monetary base, composed as it is of currency and total reserves, will most closely track Ml, which is the sum of currency and checkable deposits, with the differences between the two growth rates reflecting the much greater role currency plays in the monetary base. Figure 1 illustrates that growth in Ml and the monetary base move together, but with dramatically increased volatility in recent years.
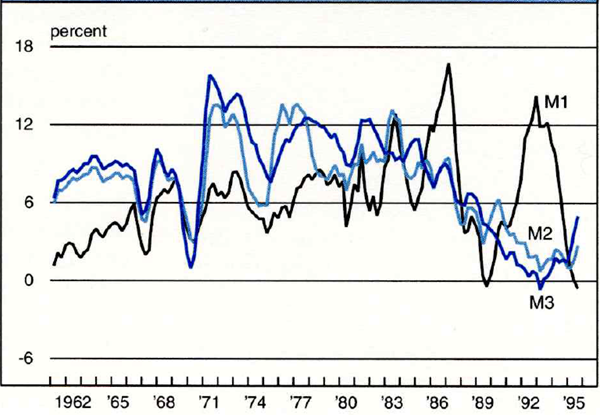
Data in figure 2 show that the increase in growth rate volatility for the three most prominent monetary aggregates (Ml, M2, and M3) is primarily confined to Ml (and the monetary base). The increased volatility in Ml growth appears to stem from regulatory changes made in the early 1980s that allowed interest to be paid on some checkable deposits. This initially prompted holders to shift some primarily savings-type deposits into the new interest-paying checkable deposits. However, interest rates paid on checkable deposits move less than rates paid on savings type deposits. When interest rates on savings-type deposits are changing, the interest return forfeited by holding the more liquid checkable deposits moves in the same direction, leading depositors to shift between checkable deposits and savings-type deposits (eg., savings deposits and small time deposits).
2. Year-over-year growth in M1, M2, and M3
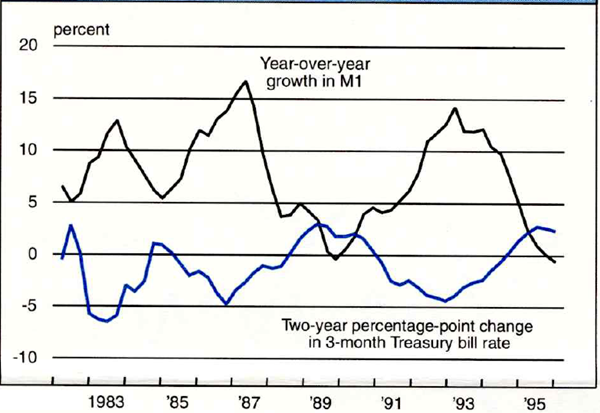
The effects of these deposit shifts are not symmetric for various money measures. Each broader monetary aggregate contains the narrower money measure, so that M2 contains all of Ml (currency plus checkable deposits), in addition to savings-type deposits and other assets. When holders shift out of (into) checkable deposits in response to rising (falling) short-term rates, Ml falls (rises), as figure 3 clearly shows. However, the broader aggregates-since they are likely to contain both the deposits that holders are shifting out of, and the deposits they are shifting into- are not much affected. This explains why growth in the broader aggregates has not shown the same increase in volatility that Ml (and the monetary base) has shown since 1980.
3. Change in M1 and Treasury bill rate
Historically, the broader aggregates have forecast economic activity and prices better than the narrower aggregates, which is reflected in M2's inclusion in the index of leading indicators and the statutory requirement that the Fed announce M2 and M3 (but not Ml) growth rate targets. The effect of movements in short-term interest rates on the narrow Ml aggregate helps explain why Ml (and the monetary base) have become less useful as policy indicators since the regulatory changes of the early 1980s. The theory of using any monetary aggregate as a policy indicator is that the Fed can set the aggregate at a different level than the public desires to hold, given current levels of economic activity and interest rates. The public tries to adjust its money balances by changing its spending-increasing spending if balances are too high and reducing spending if balances are too low. This change in spending redistributes, but cannot alter, the total money stock. However, the power of monetary policy arises because these spending changes produce a new equilibrium by changing output and/or prices until the public is willing to hold the money stock supplied by the Fed.
The most favorable situation for using a monetary aggregate as an indicator of policy is when the desired holdings of that monetary aggregate are constant, because then every change in money balances represents a change relative to the constant desired balances and leads to changes in spending. Thus, changes in money are related to future changes in real activity or prices. The least favorable situation for using a monetary aggregate as an indicator is when every movement in that aggregate is either produced by, or matched by, a change in the public's desired level of the monetary aggregate. In this situation, changes in money balances do not represent a change relative to desired balances, and so do not lead to changes in spending, economic activity, or prices.
The regulatory changes in the early 1980s led to shifts in demand that made Ml (and the monetary base) growth rates more volatile and less closely related to future changes in spending. When the Fed changes short-term interest rates, it affects all monetary aggregate measures. For example, a lowering of the fed funds rate directly induces depositories to make more loans and purchase more securities, increasing all deposit categories. However, the reduction in short-term interest rates also changes the public's preferences and induces shifts be tween different deposit categories that have the effect of increasing Ml still more, while leaving the increase in the broader aggregates (M2 and M3) largely unchanged. Since this additional increase in Ml largely reflects increased demand, it will not be as closely associated with increased spending. So the deposit shift has the effect of moving Ml (and the monetary base) in the appropriate direction, but by a larger amount than the actual shift in supply. As the figures show, the increase in Ml volatility that began with the regulatory changes in the 1980s appears to be continuing-as though depositories and the public are still learning how to adjust deposit holdings to interest rate changes.
Another factor recently appears to be distorting Ml (and the monetary base) as an indicator of monetary policy. Some depositories are automatically "sweeping" checkable deposits into money market deposit accounts (MMDAs), which have no reserve requirements; the funds are automatically brought back to checkable deposits (within the limits imposed on transactions from MMDAs) when disbursements are necessary. Again, this artificially reduces Ml, but not M2 or M3 (which include MMDAs).
Conclusion
Growth in the monetary base is sometimes used as an indicator of monetary policy. This use appears based on a textbook scenario of the conduct of monetary policy, which assumes that the Federal Reserve implements policy by setting the monetary base, and that reserve requirements are set so as to convert growth in the monetary base into growth in a monetary aggregate related to future economic activity and prices. This article argued that because neither assumption is correct for U.S. monetary policy, the monetary base is not likely to be a good indicator of policy. Furthermore, it appears likely that the performance of the monetary base as an indicator will continue to deteriorate.
Tracking Midwest manufacturing activity
Manufacturing output indexes (1992=100)
| August | Month ago | Year ago | |
|---|---|---|---|
| CFMMI | 142.8 | 138.9 | 135.4 |
| IP | 124.3 | 123.1 | 120.9 |
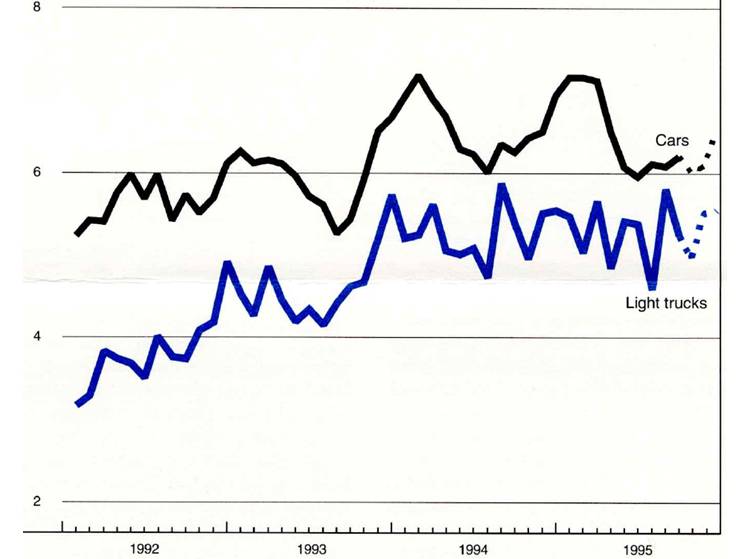
Motor vehicle production (millions, seasonally adj. annual rate)
| September | Month ago | Year ago | |
|---|---|---|---|
| Cars | 6.2 | 6.1 | 6.3 |
| Light trucks | 5.3 | 5.8 | 5.4 |
Purchasing managers’ surveys: net % reporting production growth
| September | Month ago | Year ago | |
|---|---|---|---|
| MW | 54.5 | 52.3 | 70.2 |
| U.S. | 50.6 | 49.3 | 61.9 |
Motor vehicle production (millions, seasonally adj. annual rate)
Sources: The Midwest Manufacturing Index (MMI) is a composite index of 15 industries, based on monthly hours worked and kilowatt hours. IP represents the Federal Reserve Board industrial production index for the U.S. manufacturing sector. Autos and light trucks are measured in annualized units, using seasonal adjustments developed by the Board. The purchasing managers' survey data for the Midwest are weighted averages of the seasonally adjusted production components from the Chicago, Detroit, and Milwaukee Purchasing Managers' Association surveys, with assistance from Bishop Associates, Comerica, and the University of Wisconsin-Milwaukee.
Light vehicle production flattened out in the third quarter after a weak second quarter. Production schedules published in early October called for a modest increase in output for the fourth quarter as a whole, with both car and light truck assemblies slated to increase on a seasonally adjusted basis. Floor traffic reportedly strengthened in the third quarter as well, but a survey of auto dealers pointed to some slowing into October, and auto dealers in the area have scaled back their inventory commitments in recent weeks.


