

The following publication has been lightly reedited for spelling, grammar, and style to provide better searchability and an improved reading experience. No substantive changes impacting the data, analysis, or conclusions have been made. A PDF of the originally published version is available here.
During the last decade and a half, a restructuring in the Midwest's manufacturing sector has contributed to a resurgence in the region's economic strength. Important to this renewed economic vitality has been the rapid growth in the volume of international trade and the increased ability of Midwest manufacturing industries to compete more effectively in export markets.
The coincidence of this economic recovery with the growth in export markets contributed to a widely held view that the resurgence in manufacturing in the Midwest and elsewhere was importantly attributable to the sharp depreciation of the dollar during the 1985–87 period and the continued gradual depreciation of the dollar since then. In short, the dollar's depreciation is viewed as materially contributing to Midwest manufacturing industries' ability to compete in export markets.1
Without question, export markets have become more important to the U.S. economy during the past two decades. Moreover, the dollar value of manufactured goods exported from the Midwest increased more than fivefold between 1969 and 1991.2 However, it is not clear that the strength of Midwest export growth since 1988, and in turn the resurgence of Midwest manufacturing, is largely due to the depreciation of the dollar. Indeed, taken as a whole, we find that Midwest manufacturing export industries currently face a real aggregate foreign exchange value for the dollar that is higher than was the case in 1970, the last full year prior to the 1971 dollar devaluation and the subsequent floating of the dollar in foreign exchange markets. This Chicago Fed Letter explores this unconventional view. We refer only to manufacturing industries and their exports to foreign markets. Application of these results to international markets—that is, sales to domestic markets as well as foreign markets—is not appropriate.
Numerous interrelated factors affect the ability of an industry/country to compete in export markets. They include: the relative openness of the economies; the extent and quality of infrastructure; productivity levels; unit labor costs; the variety and quality of products available; the relative rates of inflation; and values of exchange for the relevant currencies. If one accepts the proposition that such factors affect the relative competitiveness of countries in export markets, it seems reasonable to expect that they might also differentially influence the relative competitiveness of different regions within a country. In this article, we define a new measurement of one of those factors; we examine whether different U.S. regions face different exchange rates.
At any given time, there is only one exchange rate for the U.S. dollar relative to any other currency. However, we contend that different regions of the U.S., because of differences in industrial makeup and the different foreign markets to which their industries export, face different composite exchange rates. Thus, a general observation that “the dollar is depreciating” in foreign currency markets may have different implications for different regions. We examine this issue by constructing a set of real export-weighted, aggregate dollar exchange rate indexes identified by region and by industry.
Why aggregate dollar indexes?
Since the abandonment of the Bretton Woods fixed dollar-exchange standard in 1973, the foreign exchange markets have been primarily defined by a floating exchange rate regime. Against some currencies, the dollar has depreciated, against others it has appreciated, and against still others it has remained fixed. The primary rationale for an aggregate dollar index is that exchange rate movements across time and countries are neither uniform in magnitude nor in direction of change. Overall, has the U.S. dollar lost or gained in value in foreign exchange markets? Since August 1971, when the first (post World War II) de facto dollar devaluation occurred, the common perception has been that the foreign exchange value of the dollar has trended downward (except for a dramatic appreciation followed by an equally dramatic depreciation during the first half of the 1980s). Is this perception accurate?
One approach to answering this question has been to construct aggregate trade-weighted currency indexes to obtain a representative average measure of a currency's exchange rate. Using various methodologies, these aggregate indexes measure what has happened to the overall foreign exchange value of the index currency. Characteristic of all such indexes is the incorporation of a weighting scheme to identify and measure the relative importance of various trading partners in a country's overall international trade.
Some aggregate indexes also incorporate a real adjustment for relative changes in inflation, production costs, or unit labor costs. This adjustment is done to more accurately isolate changes in competitiveness that are associated with changes in exchange rate values, apart from differences in inflation or productivity across countries.
Why regions?
The premise underlying a dollar index is that there are differences in the foreign markets served by different regions of the U.S., which influence their terms of trade. In large part, these differences derive from variations across regions in industrial mix and the regions' proximity to foreign markets. To the extent that exchange rate changes vary across countries, one might expect a region's goods exports (and associated economic activity) to be differentially affected by exchange rate movements.
A comparison of export shares of major export market destinations among the U.S. regions and the nation reflects the kind of diversity one might expect in regional aggregate exchange rates. The Midwest ships nearly 56% of its manufactured goods exports to Canada and Mexico, and a little over 18% to Japan and major Western European markets. The U.S. in total ships only 33% of its manufactured exports to Canada and Mexico, while it ships about 27% to major European markets and Japan. In short, Midwest exporters of manufactured goods depend more heavily on those foreign markets where the dollar has appreciated (Canada and Mexico) relative to U.S. exporters overall.
The regional index
We have constructed indexes for eight geographic regions, and the U.S. total.3 The indexes incorporate currencies of 44 countries plus the U.S. dollar, which is the target currency.4 Trade weights applied to the individual currencies are based on the average of 1993/1994 manufactured goods exports by state to the 44 countries by industry.5 Industry classifications are based on two-digit manufacturing standard industrial classifications. Separate indexes are constructed for durable goods, nondurable goods, and total manufactured goods sectors. The real adjustment is based on rates of inflation (producer prices) in the U.S. relative to the other countries included in the indexes.6 In total, 27 indexes are constructed in the study—three industry classifications for each of the nine geographical classifications. Only three geographical regions are referred to in this article: U.S. total, Midwest, and Far West.7
What do the aggregate indexes show?
The perception that the foreign exchange value of the dollar followed a secular downward trend (with the exception of the major aberration during 1980–87) during the past 25 years has been influenced by developments in the yen/dollar and deutsche mark/dollar relationship during that period (figure 1). At the same time, however, the U.S. dollar recorded a secular appreciation against the currencies of several other major U.S. trading partners, including Canada, the United Kingdom (figure 1), and Mexico—important destinations for Midwest exports.
1. Indexes of selected dollar exchange rates
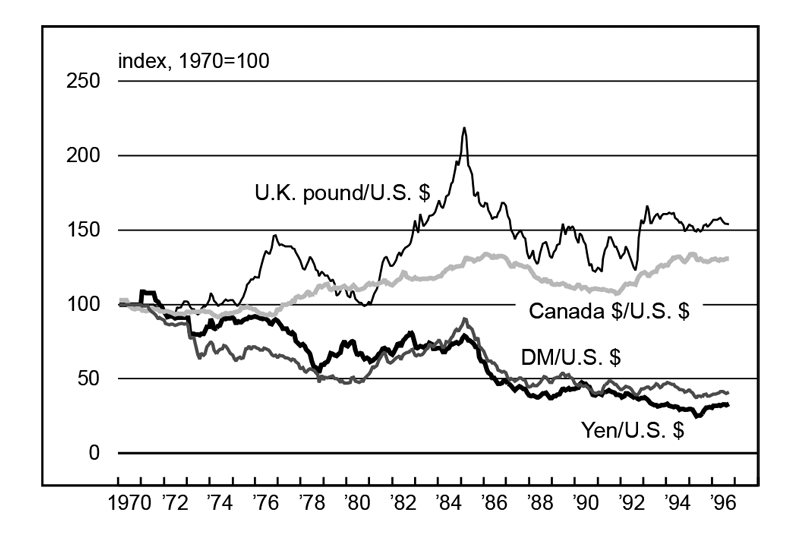
Some have argued that international competition was a major factor in forcing the restructuring of U.S. manufactured goods industries during the 1980s, especially those in the Midwest. Important to this argument is the dramatic appreciation of the dollar that occurred during the first half of the 1980s (figure 1). In the span of five years, the deterioration in U.S. manufacturing's competitive position left the sector with two hard choices: Restructure to become a viable competitor in world markets or close up shop. Because of the importance and composition of manufacturing in the Midwest, this development was critical to the region's economy.8 Proponents of this view suggest that the subsequent depreciation of the dollar during 1985–88 and into the mid-1990s importantly contributed to the rejuvenation of Midwest industry. It is further argued that expanding export markets, encouraged by a cheaper dollar, were critical to that rejuvenation.
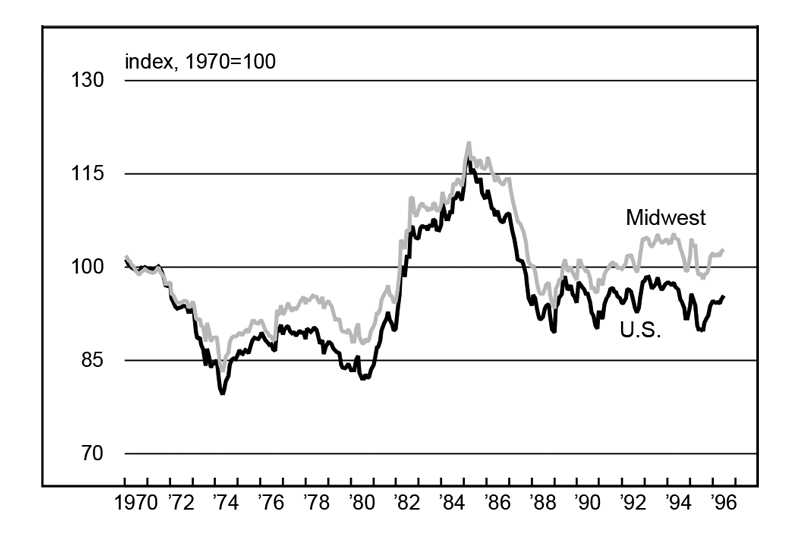
Was a depreciating dollar a meaningful contributor to the increased competitiveness of the Midwest in export markets? Contrary to the common perception, with regard to manufactured goods exports from the Midwest, the results of our work suggest that the real dollar did not continue a depreciating trend following the large gyrations recorded during 1980–87. In fact, the aggregate Midwest export-weighted real dollar index for manufactured goods shows an appreciating trend, not only for the 1988–96 period, but from 1970 to 1996 (figure 2). This appreciation is due primarily to the fact that Midwest manufactured goods exports to Canada and Mexico dominate goods exports from the region. On the other hand, these two markets have a smaller impact on the U.S. total; about one-third of U.S. manufactured goods exports go to Canada and Mexico. The aggregate export-weighted index for the U.S. shows a modest appreciating trend during 1970–96 but is virtually flat during the 1988–96 period.
2. Regional exchange rate indexes, manufacturing
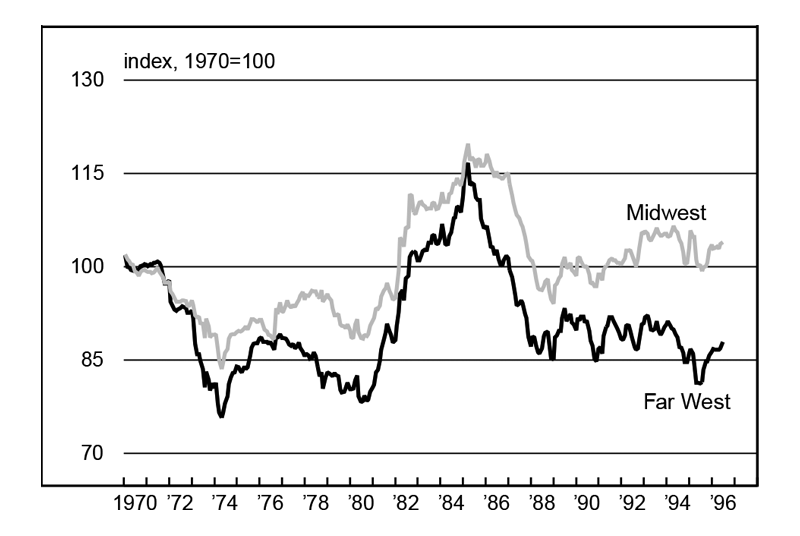
Regional differences also show up in the aggregate indexes. The durable goods index, for example, shows a substantial contrast between the Midwest and Far West regions (figure 3). The Far West's regional dollar has depreciated, as one might expect, given that the area relies relatively heavily on the Japanese market.
3. Regional exchange rate indexes, durables
Summary
Aggregate exchange rate indexes have the potential to give a more balanced overall view of the dollar's exchange rate changes relative to other major currencies. While it is true that U.S. industries engaged in export trade face a common external border and a common set of national exchange rates, from a regional perspective the specific set of exchange rates faced may be quite different.
Our research suggests that in the aggregate, Midwest manufactured goods exporters by the nature of their foreign markets and their heavy concentration in durable goods industries have, in fact, faced an appreciating dollar since the late 1980s. Indeed, except for the 1980–87 blip in the dollar, Midwest exporters have faced an appreciating-trend dollar since early 1974. As of mid-1996, the real dollar exchange rate faced by the aggregate of durable goods manufacturing exporters located in the Midwest stood 17% higher than in 1974 and 4% higher than in 1970. Furthermore, since 1988, the Midwest export-weighted dollar has generally strengthened. In June 1996, the index stood nearly 7% above its 1988 level. In sum, given its foreign export markets, it appears that not only has the Midwest increased its export competitiveness without the help of a depreciating dollar, it has done so in the face of an appreciating real dollar.
Tracking Midwest manufacturing activity
Manufacturing output indexes (1987=100)
| September | Month ago | Year ago | |
|---|---|---|---|
| CFMMI | 129.5 | 129.5 | 127.0 |
| IP | 129.4 | 129.1 | 124.9 |
Motor vehicle production (millions, seasonally adj. annual rate)
| September | Month ago | Year ago | |
|---|---|---|---|
| Cars | 6.5 | 6.7 | 6.3 |
| Light trucks | 5.4 | 5.6 | 5.2 |
Purchasing managers' surveys: net % reporting production growth
| October | Month ago | Year ago | |
|---|---|---|---|
| MW | 63.6 | 62.5 | 63.0 |
| U.S. | 56.6 | 54.1 | 48.2 |
Motor vehicle production (millions, seasonally adj. annual rate)
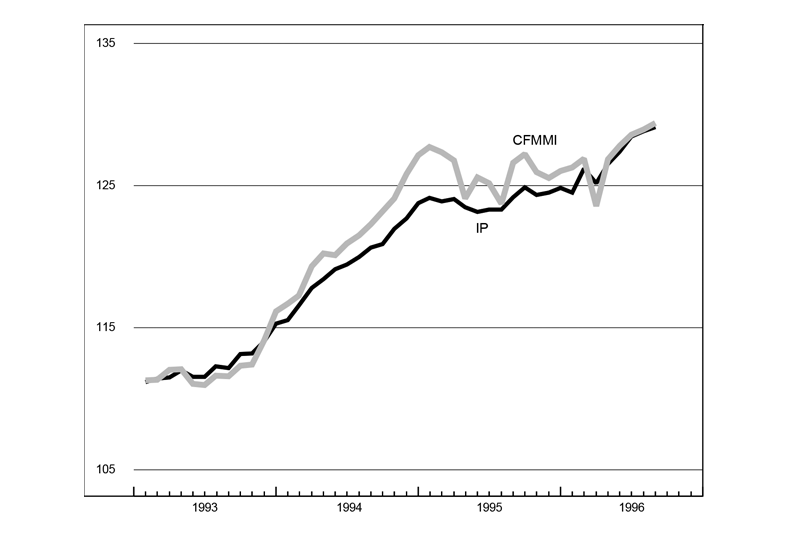
Midwest manufacturing activity remained robust in September, despite some slowing in auto production. After July’s strong showing, light vehicle assemblies dropped by nearly a million units to 12.3 million units (saar) in August and to 11.9 million units in September. Auto production nationally was still up more than 15% in the third quarter. In the Midwest, the September decline in auto assemblies offset gains in other sectors to keep the CFMMI unchanged.
The purchasing managers’ surveys from around the Midwest so far are sending positive signals for production activity in October. The composite index for production in the Midwest rose in October, consistent with the national purchasing managers’ index. With the orders index also strong, prospects are favorable for continuing modest expansion in Midwest manufacturing.
Notes
1 See Gene Koretz, “Will U.S. factories need another exchange-rate fix?” Business Week, August 8, 1988, p. 18.
2 Estimated from data presented in U.S. Department of Commerce, Bureau of the Census, “Exports from manufacturing establishments,” Annual Survey of Manufactures, Analytical Report Series, selected issues, 1983–91, and “Origin of exports from manufacturing establishments,” Annual Survey of Manufactures, selected issues, 1969–81. While the dollar value of Midwest exports of manufactured goods increased substantially, the Midwest’s share of U.S. manufactured goods exports declined from over 30% in the early 1970s to a little over 20% in the early 1990s.
3 For a discussion of the index construction, see Jack L. Hervey and William A. Strauss, “A regional export-weighted dollar: A different way of looking at exchange rate changes,” a paper delivered at the September 18, 1996, workshop “Global Linkages to the Midwest Economy,” held at the Federal Reserve Bank of Chicago as part of the Assessing the Midwest Economy project.
4 The same countries as included in the J.P. Morgan (JPM), “real effective exchange rate indices,” reported in World Financial Markets. The JPM Broad Index incorporates 22 currencies of OECD countries (including the U.S.) and 23 currencies of less-developed countries. For any given currency index, there is one target currency, e.g., the U.S. dollar, with the other 44 currencies included in the index.
5 The use of unilateral export trade weights is unusual in the construction of an aggregate exchange rate index. However, individual state data on imports are not available (for state of initial destination or state of final utilization). Thus, at this stage of the project, we rely solely on export weights. This requires that we be highly specific about any conclusions. These indexes relate only to an aggregation of exchange rates that exporters face. While we believe that the question “What aggregate exchange rate do exporters face?” is an important one, it begs the question “What is the effect of exchange rate change on the domestic market?” This issue is being addressed in another study currently in progress.
6 Price indexes were provided by the economic research group of J.P. Morgan.
7 The Midwest comprises Illinois, Indiana, Michigan, Ohio, and Wisconsin. The Far West comprises Alaska, California, Hawaii, Nevada, Oregon, and Washington.
8 These arguments miss an interesting aspect of the development of manufacturing in the Midwest during the last 25 years. The Midwest’s share of U.S. manufacturing shipments and manufactured goods exports declined sharply during the latter half of the 1970s—when the nominal dollar was depreciating in European and Japanese exchange markets. The Midwest’s share of U.S. manufacturing shipments and manufactured goods exports remained rather stable from 1983–91. See U.S. Department of Commerce, Bureau of the Census, “Exports from manufacturing establishments,” Annual Survey of Manufactures, selected years, 1969–91, the last year this survey was conducted.


