

The following publication has been lightly reedited for spelling, grammar, and style to provide better searchability and an improved reading experience. No substantive changes impacting the data, analysis, or conclusions have been made. A PDF of the originally published version is available here.
Recently, Japanese banks reported their financial results for the fiscal year ending in March 1999. The 17 largest banks suffered a net combined after-tax loss of ¥3.6 trillion ($29.51 billion at $1=¥122). Moreover, even after spending ¥10.4 trillion to dispose of nonperforming loans in the 12 months previously, the total nonperforming loans at these banks stood at over ¥20.9 trillion, representing a little over 3% of total loans of the banks. These reports were the latest installment of bleak news for a banking system that has been in the grip of a deep and prolonged crisis. Since the collapse of stock and land prices in 1990, the Japanese economy has exhibited tepid performance, with continued declines in asset prices and sharp increases in business bankruptcies. Consequently, the quality of assets at Japanese banks has deteriorated significantly, culminating in the failure of several large institutions in 1997 and 1998. Currently, it is estimated that the bad loans of major banks alone total about 7% of gross domestic product (GDP).1 This figure far exceeds the amount of government resources spent, 2.5% to 3% of GDP, to resolve the savings and loan crisis in the U.S.
Almost from the onset of the crisis, Japanese regulators have received most of the blame. They have been criticized for not controlling the level of risk in the banking system, for not taking prompt corrective action against poorly capitalized banks, and for making regulatory and accounting changes that allowed economically insolvent or nearly insolvent institutions to continue their operations.
Effective supervision and regulation of banks is essential to a safe and sound financial system. However, it is increasingly recognized that supervision and regulation is not the only means of controlling risk in banking systems. Information about bank business behavior and the resulting discipline provided by market participants can be effective tools that enhance regulatory discipline.
Although several studies document the efficacy of market discipline on U.S. banks, there is skepticism about the effectiveness of market discipline on Japanese banks.2 It is widely argued that the particular features of Japanese markets create an inhospitable environment for effective market discipline. However, recent evidence reviewed in this article suggests that market discipline on Japanese banks is alive and well. Hence, reform proposals aimed at improving the condition of Japanese banks should give serious consideration to policies promoting market discipline.
Potential constraints on market discipline
By demanding a higher rate of return on debt and equity securities of riskier banks, market participants can provide information to regulators and can potentially discipline bank management by penalizing banks with higher risk. There are two prerequisites for market discipline to be effective. First, market participants need an incentive to price risk. That is, they need to be personally exposed to potential losses arising from risk. Second, market participants need quality information on banks’ exposures to various types of risks to be able to judge the overall risk of the bank.
A widespread perception is that the regulatory, institutional, and informational structures of Japanese markets hinder the development of effective market discipline on banks. For instance, until the mid-1980s regulators encouraged banks to limit stock price fluctuations in an effort to influence the public’s perception of risk at banks. As a result, the share prices of Japanese banks were nearly constant for long periods of time. When share prices cannot respond to new information or their response is muted, they do not provide useful signals. Furthermore, the “convoy system,” where all Japanese banks move in the same general direction and the strong institutions protect the weak ones, can also hinder market discipline. If the protection provided by strong institutions shields creditors and shareholders of weak banks from extensive losses, then market participants have little incentive to charge a risk premium.
The institutional arrangements among Japanese firms do not seem any more welcoming to market discipline than the regulatory system. There are extensive ties among Japanese firms, fostered through holdings of each other’s debt and equity and through other business ties. Banks and other financial institutions form the nexus of these relationships. For instance, the major shareholders of Japanese banks are other banks and insurance companies. Furthermore, insurance companies are among the major creditors of banks. As a result of these links, the long-term stakeholders at Japanese banks may have different and more complex exposures to losses, and hence different incentives, than regulators or individual market participants. In such cases, the signals provided by participants with close ties to banks may not be useful to regulators in assessing bank risk.
Japanese investors also have less information on banks than investors in other industrial countries. For instance, it was not until 1993 that Japanese banks were required to report the amount of nonperforming loans in their loan portfolio, and it was not until March 1999 that they reported such loans by the relatively strict standards required in the U.S. This and the lack of other information on the asset composition and risk of Japanese banks serve as potential impediments to market participants’ ability to judge and price risk.
Bank failures and shareholder responses
Despite the potential constraints placed on market discipline by these features of Japanese markets, evidence indicates that market participants do provide informative signals about risk of Japanese banks.
In a recent study, Brewer, Genay, Hunter, and Kaufman (1999) examine the impact of recent failures of large financial institutions in Japan on the share prices of surviving institutions.3 They suggest that these failures represented major changes in the risk environment of surviving banks. For the first time in the postwar history of Japanese banks, the shareholders of insolvent or weak banks suffered losses, increasing the likelihood that the shareholders of other weak banks would suffer losses. If market discipline exists, the failure announcements should have had a negative impact on the share prices of surviving institutions. Indeed, the authors of the study find that share prices of banks, adjusted for market movements, declined significantly in the days following the failure announcements (figure 1). Moreover, consistent with the market discipline hypothesis, the sell-off in bank shares was not indiscriminate. Banks with observably higher risk (banks with higher loan loss reserves or nonperforming loans relative to their equity capital, banks with a higher fraction of risky loans in their portfolio, and banks with lower Moody’s ratings) experienced larger losses in value than others.
1. Responses of shareholders
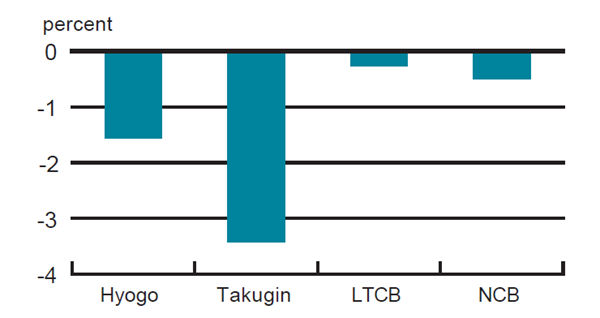
Source: Elijah Brewer III, Hesna Genay, William C. Hunter, and George G. Kaufman, 1999.
The significant negative reaction to the failures is particularly interesting because the problems at the failed institutions were widely known prior to their failure. In fact, as shown in figure 2, the shareholders of the four failed banks had already suffered significant losses relative to shareholders of surviving banks in the 12 months leading up to failure. For all but one of the failed banks, the average daily returns (adjusted for market returns) during this period were significantly negative and less than the returns of surviving banks. In fact, during the 12 months prior to the failures of Hokkaido Takushoku Bank (Takugin) and the Long-Term Credit Bank of Japan, Ltd., these banks had the lowest average daily returns of all banks. Prior to the failure of Hyogo Bank, only two banks had lower returns than Hyogo. Moreover, the share prices of the failed banks were significantly more volatile than those of other banks. For instance, in the 12 months leading up to their failure, the standard deviations of the daily excess returns for Long-Term Credit Bank of Japan and Hokkaido Takushoku Bank were three and 1.56 times the standard deviation of returns for all other banks, respectively. The behavior of stock returns of banks prior to their failure suggests that shareholders provided fairly powerful signals about the condition of these institutions.
2. Average daily excess returns
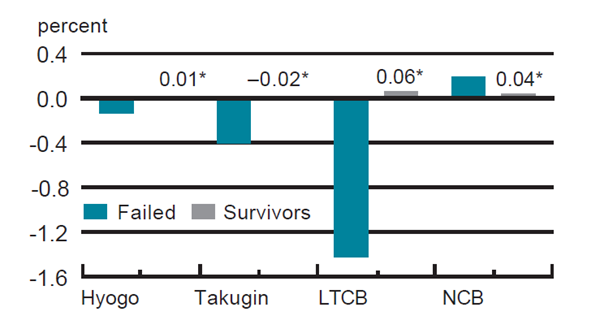
Notes: The average daily excess returns of failed and surviving Japanese banks in the 12 months prior to each failure. Daily excess return for a bank is defined as the daily return on the bank’s stock minus the return on the Tokyo Stock Exchange TOPIX index.
Source: Author’s calculations based on share price data from Bloomberg.
Other evidence on pricing for risk
In addition, the behavior of stock returns of Japanese banks suggests that, despite the poor quality of disclosed information on asset quality, shareholders price for observable measures of risk. Figure 3 compares the one-year holding period returns for banks with relatively high risk to those of banks with low risk. Banks that announced higher loan loss reserves, more risky loans, and lower capital ratios at the end of a fiscal year earned significantly lower returns over the prior 12 months.4 Simple correlations between market-adjusted returns and these measures of risk paint a similar picture.
3. Bank risk and stock returns
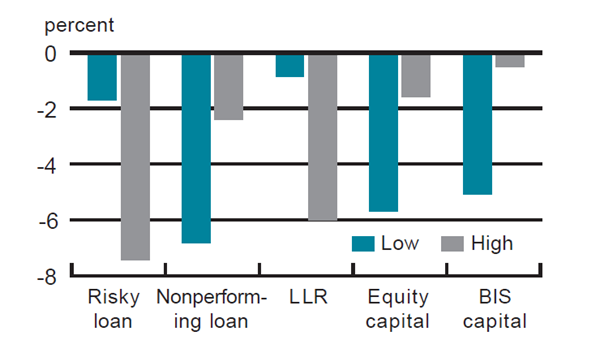
Source: Author’s calculations based on share price data from Bloomberg and accounting information in FitchIBCA’s Bankscope February 1999 disk.
This evidence of market discipline is consistent with the results of other studies on Japanese banks. For instance, Peek and Rosengren (1998) relate the daily movements in the “Japan premium,” the premium charged to large Japanese banks in the international interbank loan markets, to announcements of bank failures, regulatory policy changes, and ratings downgrades.5 Their results indicate that unsecured creditors of Japanese banks demand a higher return on loans to riskier banks and the premium changes in response to the perceived risk faced by creditors. Interestingly, the authors find that the Japan premium does not respond significantly to announcements of policy change by regulators, unless those announcements are associated with actual policy changes.
A recent article by Bremer and Pettway (1999) examines the impact of ratings downgrades by Moody’s on bank share prices.6 The authors look at stock returns prior to the announcement of the downgrade, as well as returns on the days surrounding the announcement. Although there appears to be no significant share price reaction to announcements of ratings downgrades, there is a significant decline in the share prices of banks in the two years prior to the downgrade. The authors argue that this is consistent with shareholders providing market discipline that augments regulatory discipline.
Conclusion
The recent global financial crises illustrate the importance of accurately assessing risk in banking systems. There is strong evidence that, given the opportunity, market participants provide useful information, and thus can enhance the discipline imposed by banking regulations and supervision. To the extent that investors are exposed to losses and have the information to evaluate banks, they can provide timely information to regulators in an environment of rapid changes in asset prices and risks faced by banks.
In recognition of the value of such information, the regulatory framework in developed countries has been shifting over the last several years from one of rigid command and control to one based on disciplinary incentives. Proposed changes in the Basle Capital Accord, disclosure requirements, and proposals requiring banks to issue subordinated debt are examples of the emphasis placed on incentives and market discipline.7
In the last two years, Japanese regulators also have taken steps in this direction. They have allowed insolvent institutions to fail. Perhaps more importantly, although creditors of failed institutions were protected from major losses, shareholders were not. Evidence reviewed in this article indicates that shareholders of surviving banks responded to the changes in the potential losses they faced. Stricter disclosure rules and reconstruction requirements for banks receiving public funds have been positive developments for effective market discipline. Further changes that promote market discipline, such as exposing creditors with junior claims to potential losses, taking prompt corrective action against poorly capitalized institutions, and resolving insolvent banks quickly and efficiently, can help prevent and mitigate the economic cost of future crises.
Tracking Midwest manufacturing activity
Manufacturing output indexes (1992=100)
| May | Month ago | Year ago | |
|---|---|---|---|
| CFMMI | 130.7 | 130.9 | 124.5 |
| IP | 138.6 | 138.1 | 135.4 |
Motor vehicle production (millions, seasonally adj. annual rate)
| June | Month ago | Year ago | |
|---|---|---|---|
| Cars | 5.6 | 5.5 | 4.8 |
| Light trucks | 7.3 | 7.2 | 5.2 |
Purchasing managers' surveys: net % reporting production growth
| June | Month ago | Year ago | |
|---|---|---|---|
| MW | 65.0 | 61.4 | 56.8 |
| U.S. | 63.0 | 59.2 | 50.7 |
Manufacturing output indexes, 1992=100
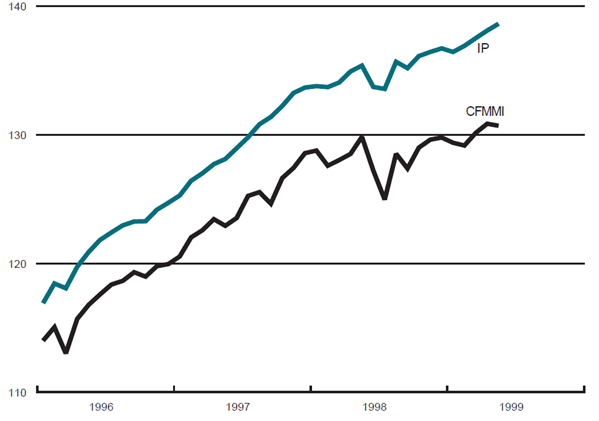
The Chicago Fed Midwest Manufacturing Index (CFMMI) fell 0.1% from April to May, to a seasonally adjusted level of 130.7 (1992=100). Revised data show the index rose 0.5% in April. The Federal Reserve Board’s Industrial Production Index for manufacturing (IP) increased 0.4% in May, the same rate experienced in April. Light truck production increased from 7.2 million units in May to 7.3 million units in June. Car production also increased from 5.5 million units for May to 5.6 million units for June.
The Midwest purchasing managers’ composite index (a weighted average of the Chicago, Detroit, and Milwaukee surveys) for production increased to 65% in June from 61.4% in May. The purchasing managers’ indexes increased for all three indexes. The national purchasing managers’ survey for production increased from 59.2% to 63% from May to June.
Notes
1 See Takeo Hoshi and Anil Kashyap, 1999, “The Japanese banking crisis: Where did it come from and how will it end?” NBER Macroeconomics Annual, forthcoming.
2 For instance, see Mark J. Flannery and Sorin M. Sorescu, 1996, “Evidence of bank market discipline in subordinated debenture yields: 1983–1991,” Journal of Finance, Vol. 51, No. 4, pp. 1347–1377; and Sangkyun Park and Stavros Peristiani, 1998, “Market discipline by thrift depositors,” Journal of Money, Credit, and Banking, Vol. 30, No. 3, pp. 347–364.
3 Elijah Brewer III, Hesna Genay, William C. Hunter, and George G. Kaufman, 1999, “Does the Japanese stock market price bank risk? Evidence from bank failures,” in Global Financial Crises: Implications for Banking and Regulation, Proceedings of the 35th Annual Conference on Bank Structure and Competition, Federal Reserve Bank of Chicago, forthcoming.
4 A similar relationship holds between these measures of bank risk and the holding period returns during the 12 months following the fiscal year-end.
5 Joe Peek and Eric S. Rosengren, 1998, “Determinants of the Japan premium: Actions speak louder than words,” Federal Reserve Bank of Boston, working paper, No. 98-9.
6 Marc Bremer and Richard H. Pettway, 1999, “Does the market discipline Japanese banks,” working paper.
7 For instance, see Bank for International Settlements, 1999, “A new capital adequacy framework,” June; Douglas D. Evanoff, 1993, “Preferred sources of market discipline,” Yale Journal of Regulation, Summer, pp. 347–367; and Charles Calomiris, 1999, “Building an incentive-compatible safety net,” Journal of Banking and Finance, forthcoming.


