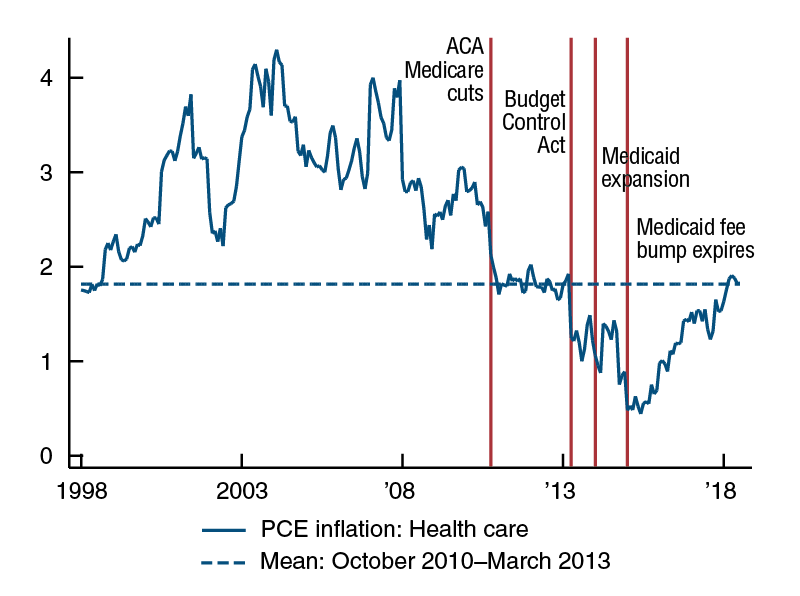
Health care services inflation was consistently at or above 3% per year in the early 2000s, declined from around 3% at the end of the 2000s to under 1% in 2015, and then rebounded to just under 2% in early 2018. The low point in 2015 was a near-historical low, with health care services price growth bottoming out at a rate not seen since 1961.
Initially, the low numbers in late 2014 through early 2016 were seen as a cause for concern; inflation was coming in below target, and health care services get a relatively large weight in the Price Index for Personal Consumption Expenditures (PCE) used to calculate inflation.1 Forecasters and policymakers saw low health care services price growth as a drag on overall inflation numbers.
Since 2015, however, health care inflation has been steadily increasing—going from 0.55% to 1.83% over the past three years (see figure 1). Like the earlier decline, this recent increase in health care services inflation has also caught the attention of reporters and policymakers. Yet while recent attention has focused on the rise in health care price growth, I argue that what was unusual was the very low levels seen from 2014 to 2016. While overall health care services inflation has clearly ticked back up, its level remains somewhat low by historical standards.
1. Health care services inflation

Sources: U.S. Bureau of Economic Analysis data accessed via Haver Analytics and author’s calculations.
In order to predict whether the recent increase will be temporary, permanent, or will signal the start of a longer-term trend, we need to understand what factors play a role in the evolution of this price series. In health care, where many prices are determined administratively by Medicare and state-level Medicaid programs, a series of large policy changes over the past decade have affected health care service prices. These policy changes can be broadly divided into two groups: policies that put long-term downward pressure on health care service prices, and policies that are best understood as temporary shocks to inflation. The patterns of these long- and short-term shocks combine to explain the very low levels of health care service price growth seen from 2014 to 2016 and suggest that the recent increase likely reflects a return to more-normal levels rather than a return to the high levels of the early 2000s.
In this Chicago Fed Letter, I discuss the role and scope of policy in determining health care prices and then particular policies that have affected the evolution of health care service prices over the past decade.
How are health care service prices determined?
The Price Index for Personal Consumption Expenditures measures the prices of goods and services consumed by U.S. households. Health care services included in the PCE deflator are services purchased out of pocket by consumers, as well as those services paid for by third parties on behalf of consumers—e.g., services paid for by employers through employer-provided health insurance or by governments through Medicare and Medicaid. The health care services component includes outpatient services (physician and dental services, home health care, and laboratory services), as well as services provided in hospitals and nursing homes.
What do health care prices mean in the context of the health care services component of the PCE deflator? Here, there are effectively two components. The first, and smaller component, is health care purchased directly by households. For example, if an uninsured person visits a retail clinic, the recorded price would be whatever he or she pays directly to the clinic. However, just 12% of expenditures on health care for Americans are out of pocket (Medical Expenditure Panel Survey, 2014).2 The second, and much larger, component of health care services in the PCE is purchased on behalf of households by insurers. When an individual with insurance visits a health care provider, the “price” is what is paid by the insurer (Medicare, Medicaid, or a private insurer) to the provider.
In Medicare and Medicaid, which make up about 20% each of total U.S. health care spending, the prices paid by insurers are set either at the state (Medicaid) or federal (Medicare) level. Furthermore, recent research has shown that a substantial fraction of the private market follows Medicare prices.3 As many of the prices paid by insurers to providers are either administratively set by Medicare and Medicaid or follow prices that are administratively set, price evolution in health care services has been influenced substantially by changes in policy over the last decade.
Understanding the evolution of prices paid to providers by Medicare is particularly important to understanding trends in health care service prices, given Medicare’s importance in market-wide price determination. The two largest components of total payments made by Medicare to providers are inpatient hospital (approximately 50%) and physician (approximately 20%) payments. As the bulk of the recent rebound in health care inflation has come through hospital prices, I focus here on the determination of prices paid by Medicare to hospitals.
While the fine details of price determination in Medicare’s Prospective Payment System (PPS) are quite complicated, at its core the system is straightforward. The starting point for determining how much Medicare pays providers is a base level of payment. This number is then adjusted based on a patient’s diagnosis (to take into account that some services are much more difficult and resource intensive than others), as well as the patient’s geographical location (to take into account that inputs are more expensive in some areas than others).
The factors that determine the evolution of Medicare prices over time come from two sources. The first is annual adjustments made by the Centers for Medicare and Medicaid Services (CMS) to the base payment level to account for changes in the costs of inputs. These adjustments are called “market basket updates,” and are strictly formulaic. For hospitals, the most important component of the market basket update is the Employment Cost Index’s (ECI) measure of the rate of change to hospital wages and benefits; the ECI directly accounts for about 70% of the price index used to adjust hospital base payments rates.
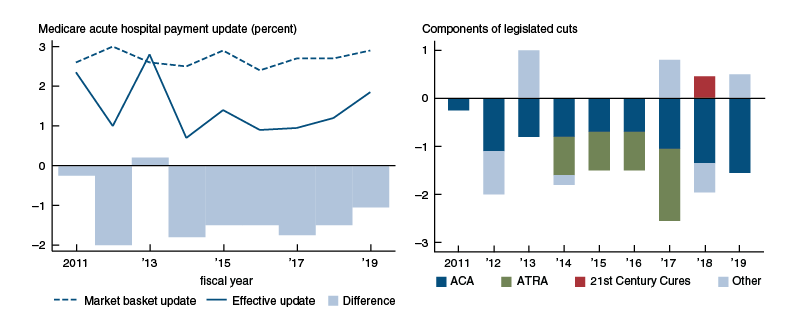
The second component of Medicare hospital price evolution comes in the form of legislated adjustments, which are either added or (mostly) subtracted from the market basket update to determine the final payment updates. The first panel of figure 2 plots the update to Medicare hospital payments that was made after legislated adjustments, the initially proposed market basket update, and the difference. The requirements of various pieces of legislation, such as the American Taxpayer Relief Act (ATRA) of 2012 and the Affordable Care Act (ACA) of 2010, mean that the final payment update may bear little relation to the original market basket update.
2. Annual initial and effective Medicare payment update to hospitals

Source: Author’s calculations from CMS Hospital Inpatient Prospective Payment System (IPPS) final rules, fiscal years 2011–19.
Long-term factors
Health care services inflation was high during the early 2000s and then dropped sharply in late 2010. This drop reflects cuts to Medicare payments included in the ACA, which came into effect in fiscal year 2011. The second panel of figure 2 decomposes the difference between the effective update and the market basket update into components of specific pieces of legislation, the most important of which are various cuts required by the ACA. These cuts to Medicare hospital payment rate updates have been in effect every year since 2011, and while some components will eventually expire, the largest component (the “multi-factor productivity” adjustment) is set to continue indefinitely under current law.
These legislated cuts to Medicare payment growth can be an important restraining force on overall health care inflation, to the extent that the evolution of Medicare prices has both a large direct and indirect effect on overall health care prices—and one that will remain in place for the foreseeable future under current law. After the Medicare cuts from the Affordable Care Act were phased in, health care inflation dropped precipitously (figure 1). Inflation remained stable at the new lower level for several years, until prices were hit by a series of one-time policy shocks discussed in the next section. If we take the average inflation level over this stable period (the dashed line in figure 1) and consider this to be the post-ACA “new normal,” we have just now returned to this level after years of very low inflation numbers.
One-time policy changes
In addition to Medicare payment cuts in the ACA, there were three large shocks to the market that likely contributed to the exceptionally low levels of health care services inflation seen from 2014 to 2016.4 Unlike the cuts to Medicare provider price updates, which reduce the growth of prices each year, these can all broadly be seen as one-time shocks to health care service prices, which would have initially held down year-over-year price increases, but then would have rolled off and allowed health care inflation to rebound.
First, the Budget Control Act of 2011 contained a package of automatic spending cuts, which was triggered when the U.S. Congress Joint Select Committee on Deficit Reduction failed to reach a bipartisan agreement to cut spending. As a result, the act required automatic reductions in federal spending (“sequestration”), which for Medicare took the form of an across-the-board cut of 2% to Medicare payments. The cuts went into effect in April 2013 and applied to Medicare payments to both hospitals and doctors. As shown in figure 1, there is a sharp drop in health care inflation that lines up with this cut to Medicare payments, and this has been attributed to the Medicare sequestration cuts.5
Unlike the Medicare payment cuts included in the Affordable Care Act, however, the sequestration cuts were a one-time payment reduction, with no further effect on the growth of Medicare payment rates. While previous work has documented that changes in Medicare prices spill over into the private sector over a period of several years, the effect is front-loaded and decreases sharply after the initial year.6 Thus, most of the effect of sequestration cuts on health care services inflation should have rolled off in 2014.
Second, the Medicaid expansion under the Affordable Care Act went into effect in 2014 and resulted in a dramatic increase in Medicaid enrollment. Medicaid payments are lower and grow more slowly than payments from other payers. Therefore, the ACA expansion shifted the composition of payments downward in states that expanded Medicaid. State-level uptake of the Medicaid expansion was particularly brisk starting in 2014 but has slowed over time. Currently, 36 states and Washington, DC, have adopted the expansion. Of these expansions, 27 became effective in 2014, three became effective in 2015, two became effective in 2016, one is currently enrolling people for coverage effective in 2019, and four have been approved by ballot initiative but are not yet effective.
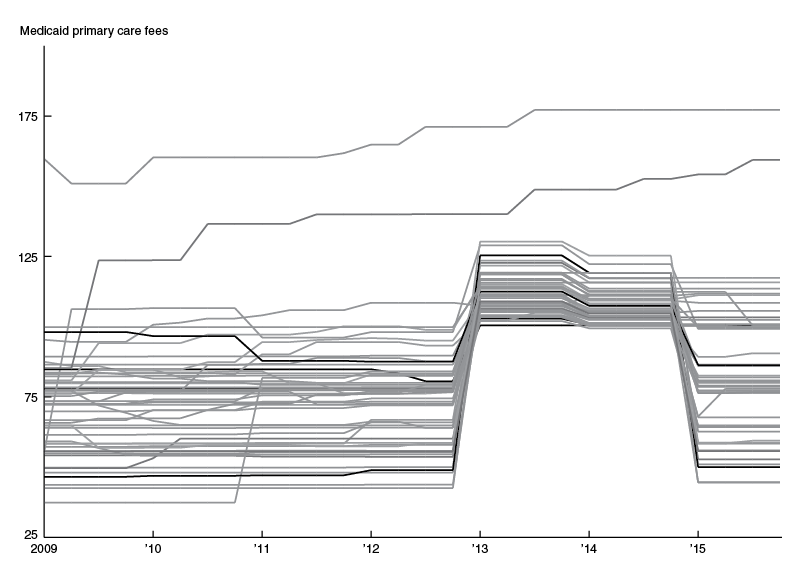
Third, in January 2015, the Medicaid primary care rate increase expired. The primary care rate increase was a provision of the Affordable Care Act that required states to increase their Medicaid payments to doctors to match Medicare levels for primary care services. The rate increase was effective in 2013 and 2014, but efforts to make the payment increase permanent failed, and in 2015 most states returned to the much lower payment rates previously in effect. Figure 3 shows the large impact of both the adoption and expiration of the primary care rate increase; in many states, payments to doctors for primary care services initially doubled in 2013 and then halved in 2015.
3. Medicaid primary care payments to doctors decrease sharply in 2015

Source: Diane Alexander and Molly Schnell, 2018, “Closing the gap: The impact of the Medicaid primary care rate increase on access and health,” Federal Reserve Bank of Chicago, working paper, No. 2017-10, revised April 21, 2018, available online.
While the effect of the primary care rate increase appears to have been offset by the sequestration cuts, the sharp reduction in Medicaid payments to primary care doctors in 2015 lines up with the lowest period of health care services inflation in figure 1.
Conclusion
Each of the three policy changes discussed here could be expected to temporarily decrease health care inflation, and the fact that they partially overlapped may explain the exceptionally low levels of inflation seen in 2015. In January 2016, when the effect of the fee boost expiration rolls off and health care service prices are not hit by any more large policy changes, we see a turning point in health care services inflation. However, while the effects of these policies have rolled off, the legislated cuts to Medicare hospital payment updates contained in the Affordable Care Act mostly remain. Thus, the rebound in health care inflation back to the initial level seen after the implementation of the Affordable Care Act may signal a return to a post-ACA “new normal” for health care services inflation.
A caveat, however, is the substantial role of policy in the evolution of health care service prices. The analysis here is based on current law. Forecasting health care service prices requires forecasting health care policy, which is much more difficult. While policy has been a restraint to health care inflation over much of the past decade, the Bipartisan Budget Act (BBA) of 2018 tilts in the other direction. This act eliminated an advisory board created by the ACA to control Medicare spending, delayed cuts to Medicaid Disproportionate Share Hospital (DSH) payments for two years, and eliminated a provision that reduced physician payments. In addition, the 21st Century Cures Act, signed into law in December 2016, included a legislated increase of 0.46% to Medicare hospital payment updates in fiscal year 2018, and a similar increase of 0.5% in fiscal year 2019 to partially restore cuts made by the American Taxpayer Relief Act years earlier. After a long period of policy holding back health care inflation, these small policy changes may signal a slight loosening of this stance.
1 Jeffrey Clemens, Joshua D. Gottlieb, and Adam Hale Shapiro, 2016, “Medicare payment cuts continue to restrain inflation,” FRBSF Economic Letter, Federal Reserve Bank of San Francisco, No. 2016-15, May 9, available online; and Jim Dolmas, 2016, “Health care services depress recent PCE inflation readings,” Economic Letter, Federal Reserve Bank of Dallas, Vol. 11, No. 11, August, available online.
2 U.S. Department of Health & Human Services, Agency for Healthcare Research and Quality, 2014, Medical Expenditure Panel Survey, Table 1: Total Health Services - Median and Mean Expenses per Person with Expense and Distribution of Expenses by Source of Payment: United States, 2014, available online.
3 Jeffrey Clemens and Joshua D. Gottlieb, 2017, “In the shadow of a giant: Medicare’s influence on private physician payments,” Journal of Political Economy, Vol. 125, No. 1, February, pp. 1–39. Crossref
4 See Clemens, Gottlieb, and Shapiro (2016).
5 Jeffrey Clemens, Joshua D. Gottlieb, and Adam Hale Shapiro, 2014, “How much do Medicare cuts reduce inflation?,” FRBSF Economic Letter, Federal Reserve Bank of San Francisco, No. 2014-28, September 22, available online.
6 See note 4.


