

In mid-September 2019, there were sudden, large fluctuations in short-term interest rates. Why did these fluctuations happen, and what do they tell us about the Federal Reserve’s monetary policy toolkit?
Overnight interest rates are a basic building block of most financial transactions. Banks, securities dealers, and other large financial institutions obtain much of their funding by borrowing overnight. The costs of this overnight borrowing then influence the rates that families and businesses pay for longer-term loans and receive on their investments. The Federal Reserve’s monetary policymaking body, the Federal Open Market Committee (FOMC), also announces its monetary policy decisions by setting a target for rates on certain overnight loans.
In recent years, overnight rates have, for the most part, been remarkably stable. Figure 1 shows the effective federal funds rate (EFFR), which is a volume-weighted median of rates paid by banks and which the FOMC sets a target range for, as well as the secured overnight financing rate (SOFR), the median rate on overnight collateralized loans known as repos that are made to a wide range of institutions. From 2015 until early September 2019, the EFFR had stayed within the FOMC’s target range on all but one day and rarely moved much even within the target range. The SOFR had been somewhat more variable, especially around quarter-end and year-end financial statement reporting dates, but rarely moved more than a quarter of a percentage point outside the EFFR target range. Then, on September 17, 2019, the EFFR moved above the top of the target range and the SOFR soared nearly 3 percentage points.
1. Money market interest rates
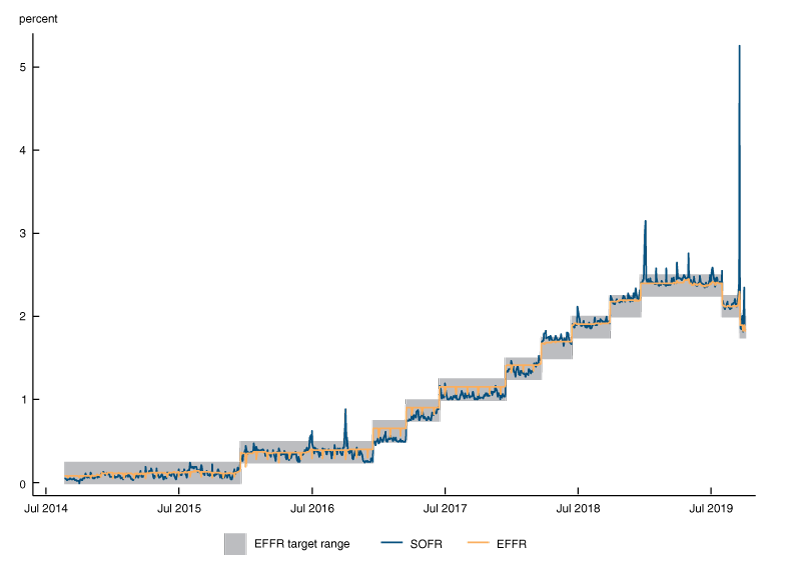
Source: Federal Reserve Bank of New York.
What happened?
Two developments in mid-September put stress on overnight funding markets. First, quarterly tax payments for corporations and some individuals were due on September 16. Over a period of a few days, these taxpayers took more than $100 billion out of bank and money market mutual fund accounts and sent the money to the U.S. Treasury. Second, the Treasury increased its long-term debt by $54 billion by paying off maturing securities and issuing a larger quantity of new ones. (A reduction in short-term Treasury bills outstanding partly offset the increase in long-term debt.) Buyers of the new debt paid for it by withdrawing money from bank and money market accounts. Combined with the tax payments, the debt issuance reduced the amount of cash in the financial system.
At the same time as liquidity was diminishing, the Treasury debt issuance caused financial institutions to need more liquidity. A substantial share of newly issued Treasury debt is typically purchased by securities dealers, who then gradually sell the bonds to their customers. Dealers finance their bond inventories by using the bonds as collateral for overnight loans in the repo market. The major lenders of cash in that market include banks and money market funds—the very institutions that had less cash on hand as a result of taxpayers’ and bond buyers’ payments to the Treasury.
With more borrowers chasing a reduced supply of funding in the repo market, repo interest rates began to rise on September 16 and then soared on the morning of September 17, reaching as high as 9% in some transactions—on a day when the FOMC was targeting a range of 2% to 2.25% for the fed funds rate.
Pressures in the repo market then spilled over to other markets, such as fed funds, as lenders in those markets now had the option to chase the high returns available in the repo market. In addition, when banks experience large outflows as a result of tax payments or Treasury issuance, they may seek to make up the money by borrowing overnight in the fed funds and other markets, putting additional pressure on rates there. The fed funds rate reached 2.25%, the top of the FOMC’s target range, on September 16 and 2.30% on September 17.
How did the Federal Reserve respond?
Consistent with the FOMC’s directive to maintain the fed funds rate within the target range, the New York Fed’s Open Market Trading Desk responded to the spiking rates on the morning of September 17 by offering to lend $75 billion in overnight repos. Borrowers had to provide Treasury securities, agency debt, or agency mortgage-backed securities as collateral for these loans and had to pay back the money, with interest, the next day. When the Desk offers repo loans, it makes them available only to primary dealers, a group of 24 broker-dealers and banks that make commitments to participate in open market operations and Treasury auctions. Loans to these firms can ease pressures in money markets overall in two ways. First, when primary dealers borrow from the Fed, they may borrow less from other lenders; this frees up repo funding for other borrowers. Second, after borrowing from the Fed, primary dealers may lend some of the proceeds onward to other firms, directly reducing those firms’ borrowing costs.
The Desk’s open market operation on September 17 clearly reduced the pressures in money markets, with money market rates immediately moving much closer to the fed funds target range. Nonetheless, the EFFR landed at 2.30% for the day, slightly above the top of the target range, while the SOFR was 5.25% for the day.
In part, the elevated SOFR that day could reflect high rates on transactions that occurred before the Desk announced its intervention. In addition, although the Desk offered $75 billion in repos, primary dealers bid for only $53 billion. On the margin, this meant that primary dealers were forgoing the opportunity to borrow at the operation’s minimum bid rate of 2.1% and lend money into repo markets that were still trading at much higher rates. This outcome suggests that there could be some limits to primary dealers’ willingness to redistribute funding to the broader market.
Analysis of market dynamics on September 17 is continuing, but a number of frictions may have kept primary dealers from intermediating between the Fed and other firms to the maximum extent possible. When a dealer borrows from the Fed and lends to another firm, the dealer’s assets and liabilities both increase. The dealer may view this expansion in its balance sheet as costly, especially if the dealer is part of a bank holding company that is subject to limits on the ratio of its assets to its capital (the “leverage ratio”) and other regulations meant to ensure the safety of the financial system. These frictions may vary over time and depend on circumstances. On September 18, when the Desk conducted another repo operation, dealers borrowed the full $75 billion available, and market rates were pulled down more strongly. Nonetheless, market rates did not fall all the way to the offering rate on the Fed’s repo operation, possibly indicating that some frictions remained between the primary dealers and the rest of the market. This gap disappeared later in the week as the Desk continued to conduct daily overnight operations.1 By September 19, both the EFFR and the SOFR had moved back within the target range for the fed funds rate.
The Fed also deployed another tool to bring down market rates. On September 19, the Fed lowered the interest rate it pays banks on their reserves, shifting this rate slightly lower within the fed funds rate target range in a move known as a “technical adjustment.”2 Because the fed funds rate currently tends to trade slightly above the interest rate on reserves, moving the interest rate lower in the target range reduces the risk that the fed funds rate will rise above the top of the range.
Implications for the Federal Reserve’s monetary policy implementation toolkit
Following its January 2019 meeting, the FOMC announced that it “intends to continue to implement monetary policy in a regime in which an ample supply of reserves ensures that control over the level of the federal funds rate and other short-term interest rates is exercised primarily through the setting of the Federal Reserve’s administered rates, and in which active management of the supply of reserves is not required.”3 But in the recent episode, adjustments of the administered interest rate on reserves were not the only tool needed to control market rates; repo operations were needed as well. These developments teach us a few lessons about the Fed’s current approach to monetary policy implementation.
First, the recent volatility appeared to result from fairly routine events—a tax due date and a Treasury debt auction—but had a much more dramatic impact on money markets than similar such events in the recent past. (There had been some mild upward pressure on rates around the April and June tax dates and little pressure in previous years.) Two developments that may have made money markets more vulnerable to this shock in September are the declining level of reserves in the banking system and the increasing quantity of privately held Treasury debt, illustrated in figure 2. To support the economy during and after the Great Recession, the Fed bought trillions of dollars of Treasury and mortgage-backed securities. These purchases massively expanded the supply of reserves to banks, to a peak of $2.8 trillion. Reserves later began to fall as currency and other Fed liabilities took their place4 and then as the FOMC reduced its asset holdings from October 2017 through July 2019 as part of the post-crisis normalization of its balance sheet. The level of reserves in mid-September 2019 was the lowest since 2012. At the same time, the Treasury has been issuing more debt to finance government deficits; in mid-September, Treasury debt outstanding, net of the Fed’s holdings, was the highest ever in nominal dollars. Dealers, hedge funds, and other investors often finance their holdings of Treasury debt by using them as collateral to borrow in repo markets. Thus, going into the mid-September tax and Treasury issuance dates, repo markets were already under increasing pressure from the combination of lower liquidity in the banking system and more Treasury securities in need of financing.
2. Bank reserves and Treasury debt outstanding
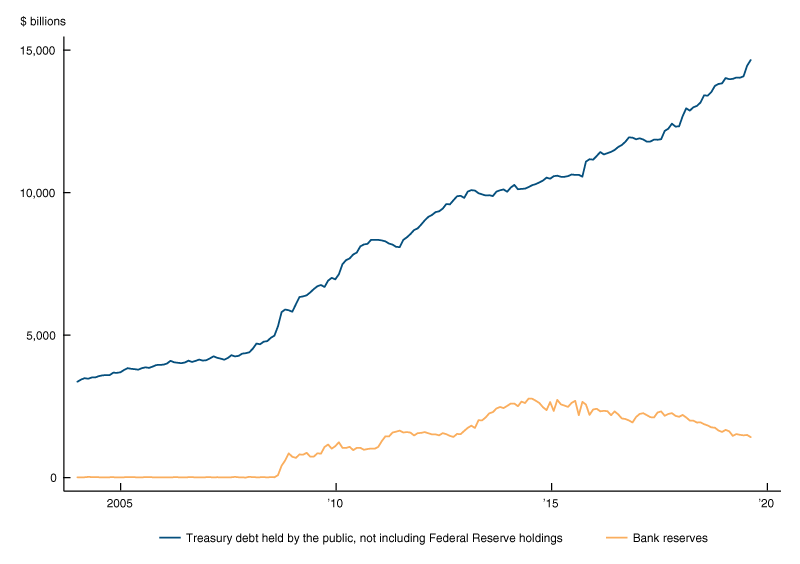
Sources: Federal Reserve Board and U.S. Department of the Treasury.
One metric for the relative supply of reserves and Treasury debt is the difference between the interest rate called IOER that the Fed pays on reserves and the repo interest rates, such as SOFR, that firms can pay to finance Treasury debt. Figure 3 shows this spread. The repo rate is effectively the yield on holding a Treasury security overnight, while the interest rate on reserves is the yield on leaving money with the Fed overnight. Both Treasury securities and reserves at the Fed are, fundamentally, liabilities of the U.S. government that have similar risk profiles and would be expected to pay similar overnight yields. When the repo rate is below the interest rate on reserves, as it generally was from 2015 through March 2018, the supply of liquidity is so great that Treasury securities are very easy to finance and have a lower effective overnight yield than reserves. From March 2018 through March 2019, repo rates were generally very close to the interest rate on reserves. Then, beginning in the second quarter of 2019, repo rates ticked above the interest rate on reserves. Around the same time, money market rates started to exhibit slightly more upward pressure near tax payment deadlines. Most recently, just before the volatility in mid-September, the spread between SOFR and IOER on September 13 was the highest yet on the business day before a tax date in the period since the FOMC began normalizing monetary policy in late 2015.
3. Spread between SOFR and interest rate on excess reserves
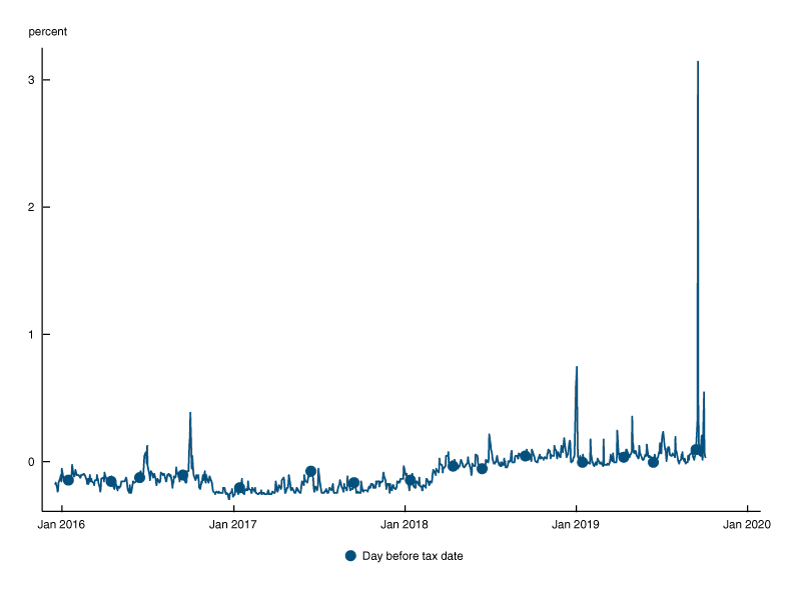
Sources: Federal Reserve Bank of New York and author’s calculations.
Second, the response to the Fed’s interventions demonstrated that open market operations remain a powerful tool for moving money market rates, but that these operations have limits. Before the financial crisis, day-to-day movements in reserve supply were much smaller than at present, due mainly to differences in how the Treasury managed its cash account.5 The Fed routinely used open market operations in that environment to control interest rates, but these operations were rarely larger than $20 billion, an amount that primary dealers could easily absorb and pass along to other firms. As evidenced by the limited take-up of the September 17 operation and the incomplete pass-through of the Desk’s offering rates on the initial Fed repos to market rates, it appears to be more challenging at times for dealers to intermediate the larger amount of funds needed to offset current fluctuations in reserves.
Although the outlines of recent money market events are clear, much remains to be learned. Continuing analysis of these markets will help ensure that the stance of monetary policy is effectively transmitted to households and businesses in the wider economy—and thus achieves the FOMC’s macroeconomic goals.
Notes
1 The Desk also began conducting 14-day term repo operations to further strengthen rate control.
2 This adjustment was in addition to the reduction in the target range that the FOMC announced at its meeting that ended September 18. Starting September 19, the target range was set at 1.75% to 2% and interest on reserves was set at 1.8%, 20 basis points below the top of the range; previously, the target range had been 2% to 2.25% and interest on reserves had been 2.1%, 15 basis points below the top of the range.
3 See Federal Open Market Committee, 2019, “Statement Regarding Monetary Policy Implementation and Balance Sheet Normalization,” press release, Washington, DC, January 30, available online.
4 See Thomas Haasl, Anna Paulson, and Sam Schulhofer-Wohl, 2018, “Understanding the demand for currency at home and abroad,” Chicago Fed Letter, Federal Reserve Bank of Chicago, No. 396. Crossref
5 See Thomas Haasl, Anna Paulson, and Sam Schulhofer-Wohl, 2018, “The structure of Federal Reserve liabilities,” Chicago Fed Letter, Federal Reserve Bank of Chicago, No. 395. Crossref


