Introduction and summary
Over the period 1992–2019, the real yield on ten-year U.S. Treasury securities fell by about 350 basis points. Roughly half of that drop happened before the Great Recession, which started in 2008, and the rest occurred during the downturn and its aftermath. Eggertsson, Mehrotra, and Summers (2016) show that the drop in long-term real interest rates in the other Group of Seven (G7) countries1 mirrors closely the U.S. experience, and Yi and Zhang (2017) note that, despite some variation across countries, the fall in these real interest rates is to a substantial extent a worldwide phenomenon. The question of why long-term interest rates have declined to such an extent received particular interest in the U.S. context for two reasons. First, falling long-term real interest rates were considered a major source of the housing boom that eventually gave way to the global financial crisis of 2007–08. Second, long-term rates stubbornly continued to fall during the expansion following the 2001 recession despite a sequence of increases in the federal funds rate and associated short-term market rates—a phenomenon that became known as the “Greenspan conundrum.”2
Capital market equilibrium theory suggests that long-term real interest rates are determined not primarily by monetary policy, but by longer-term trends in saving and investment. At a broad-brush level, real interest rates fall when there is an excess of saving over investment at the initial interest rate. In the same way as a “shortage” is defined as a disequilibrium phenomenon requiring a rise in the price of a commodity in excess demand at the initial price, a “saving glut” describes a situation in which the interest rate has to fall to restore capital market equilibrium after a rise in saving or a fall in investment at the initial interest rate.
In a watershed speech, Bernanke (2005), while continuing to focus on U.S. long-term real rates as the outcome variable, shifted attention to international considerations as a key explanatory variable. In particular, Bernanke proposed that increased saving in both developed and developing Asian countries, as well as oil-producing countries in the Middle East and North Africa, was not fully matched by increased domestic investment opportunities. This disequilibrium situation—the global saving glut (GSG)—both necessitated a fall in world interest rates and showed up as capital inflows to the United States and other Western countries, resulting in large deficits in the current accounts3 of these “recipient countries.”
Bernanke’s early formulations of the GSG hypothesis focused on current account deficits and surpluses (also sometimes referred to as global imbalances in saving and investment), without regard to the assets being purchased with the capital flows. Later work (Bernanke et al., 2011) augmented this bare-bones version of the GSG hypothesis with a preference for purchasing safe assets by the “source countries” of the capital flows (such as developed Asian nations and China). Most of our analysis here focuses on the basic saving–investment equilibrium model; however, in the penultimate section of the article, we take up the special role of Eastern countries’ preferential demand for safe and liquid assets. We explain how precautionary saving considerations can simultaneously help account for 1) an increase in overall saving in the East (and other non-Western regions), 2) the bias toward channeling that excess saving into U.S. Treasury securities and closely related safe and liquid assets (in particular agency bonds4), and 3) the fall in riskless rates in the United States relative to the returns on risky capital assets.
The overall purpose of this article is to revisit the GSG hypothesis, both theoretically and empirically, with a perspective of 15 years from when it was first articulated. As already noted, the general hypothesis went through a metamorphosis that can easily be seen by looking sequentially at the several works by Bernanke listed among the references. Because ideas of potentially major significance were expressed chiefly in speeches rather than in academic papers and focused on current events as they unfolded, the literature did not provide an analytical framework for either the basic GSG hypothesis or the more refined version that concentrated on the Eastern countries’ preference for safe and liquid assets.5 Thus, our first goal is to show how to use existing theory to provide analytics for the hypothesis.
Our second goal is to review the stylized facts of saving, investment, current accounts, and interest rates and extend the data beyond the Great Recession to the present time. We find that in the post-Great Recession period, along with the reduction in gross trade flows, net flows (the absolute value of current accounts) were also substantially decreased. Yet long-term rates continued to fall. These facts make the GSG hypothesis in its original flow-based guise less convincing an explanation for falling long-term interest rates. A third and related goal is to distinguish the role of increased saving in the East from that of decreased investment (both relative to trend). Both roles are important, and although some of the implications are the same, some of them differ significantly.
Finally, we focus more specifically on the preferential demand on the part of Eastern countries for saving in safe and liquid assets. In addition to expositing briefly the theory governing such a preference for safe and liquid assets (mostly following Kimball, 1992), we estimate the contribution of this preference to the narrowing of the yield spread between long-maturity Treasury bonds and less safe and liquid assets.
In the next section, we highlight the principal observations motivating the basic global saving glut hypothesis. Beginning with observations in the United States, we document 1) the long extended fall in long-term interest rates (both nominal and real) from the 1990s onward and 2) the sharp movement of the U.S. current account into a position of deficit. Then, we turn to observations in the GSG countries, whose current account surpluses are the counterparts of the current account deficits in the United States (and other Western countries). We stress two previously observed (as in Bernanke, 2009), but perhaps insufficiently well-known, facts: 1) the fairly comparable magnitudes of the contributions (albeit with different timing patterns) of the developed countries (and territories) of Asia, China, and the oil-producing countries of the Middle East and North Africa to the excess saving that appeared as capital inflows to the United States and Europe and 2) the close connection between current accounts in the Middle East and North Africa region and world oil prices.
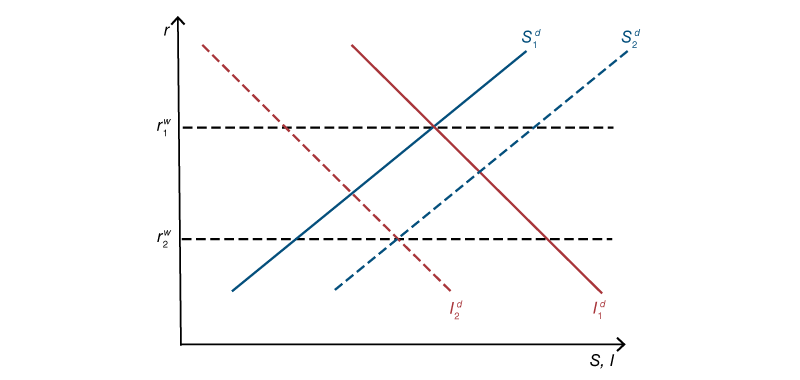
In the subsequent section, we use a diagrammatic two-country textbook model adapted from Abel, Bernanke, and Croushore (2014) to exposit the conceptual connection between movements in saving, investment, current accounts, and interest rates. All else being equal, an exogenous increase in excess saving in the source countries (that is, the GSG countries) leads to a drop in world interest rates and a current account deficit in the recipient countries. As we will demonstrate shortly, the effects on equilibrium investment in the countries are ambiguous.
After this, we look behind the curtain of current account surpluses in the GSG countries to get the breakdown of these surpluses into movements in saving and investment. Importantly, we find a significant role for sluggish investment growth, in addition to high and rising saving rates, in generating the current account surpluses in these GSG countries. Recall that the driver of changes in both interest rates and current accounts is the change in saving relative to investment at the initial interest rate. Once excess saving is allowed to arise from an exogenous fall in investment as well as an increase in saving, there is an unambiguous drop in the world interest rate; but the equilibrium quantity of world saving and investment can either rise or fall, depending on the relative shifts of the saving and investment schedules. This becomes clear in our diagrammatic analysis later on.
From our analyses, we draw the following conclusions. First, the GSG hypothesis ties the drop in long-term real interest rates to excess saving outside the United States (and other Western countries) as reflected in large surpluses in the U.S. capital account.6 Second, it is incorrect to associate the GSG almost exclusively with China. The source countries (which we also refer to as “net savers”) were at first the developed ones in Asia, such as Japan and South Korea, and then (in line with fluctuations in oil prices) countries in the Middle East and North Africa. Later China became the single most important source country, but it never completely dominated the others. Since 2015, the developed Asian nations have played a prominent role as source countries, whereas China’s current account surplus has fallen sharply. Third, excess saving reflects weak domestic investment as well as strong saving. Weakening in investment is seen repeatedly in the source countries. Indeed, the observation that the fraction of world gross domestic product (GDP) devoted to investment declined over the past 40 years (see Taylor, 2009) suggests the primacy of weak investment in the mechanics of the GSG. The role of weak investment worldwide appears to tie in well with the secular stagnation hypothesis—a close, but brasher, cousin of the GSG hypothesis.7 Fourth, current accounts fell in magnitude more or less permanently during the Great Recession, in line with the reduction in gross trade flows. The smaller capital inflows to the United States in recent years are not associated with a slowing of the continuing downward trend in long-term real rates here (if anything, these smaller inflows have been associated with an acceleration of that trend). This suggests that capital flows from countries with current account surpluses are probably not a dominant factor in the continuing drop in real interest rates in the United States since the Great Recession. Finally, in addition to the current account channel, which receives most of the attention in this article, there is a second important channel of the GSG driven by the demand for safe and liquid assets on the part of the source countries of the East. We attempt to do a rough counterfactual exercise based on Krishnamurthy and Vissing-Jorgensen’s (2012) work on the demand for U.S. Treasury debt. We estimate that the safe and liquid assets channel lowered the yield spread between long-maturity AAA corporate bonds and Treasury securities by about 50 basis points. Because the GSG may have also lowered the rate on AAA bonds to some extent, the 50 basis point reduction in the spread is probably something of an overestimate of this channel’s effect on the Treasury rate. Still, this narrowing in the spread supports the view that the safe and liquid assets channel is an important additional mechanism by which capital inflows from GSG countries may have lowered U.S. interest rates.
The observations that motivated the GSG hypothesis
In this section, we present the principal observations that motivated the basic global saving glut hypothesis. We start with observations in the United States and then turn to observations in the GSG countries.
Observations in the United States
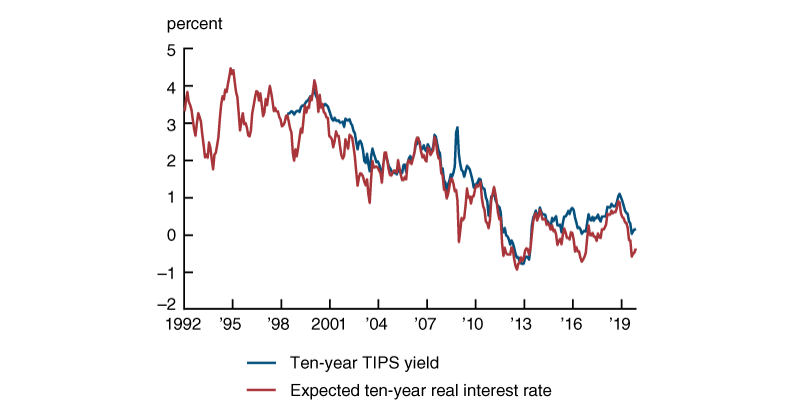
The first observation in the United States motivating the GSG hypothesis is the protracted decline in long-term real interest rates, as shown in figure 1. This figure depicts both a Treasury Inflation-Protected Securities (TIPS) rate and an expected long-term real interest rate, computed by subtracting from the nominal yield on ten-year Treasury securities the measure of ten-year expected inflation from the Survey of Professional Forecasters (SPF).8 From 2003 on, the TIPS rate is for the ten-year TIPS. Before 2003, we use a 30-year TIPS rate, data for which are available starting in 1998, subtracting 40 basis points from it to reflect the average term premium observed in the years when both the ten-year and 30-year TIPS are available. At the time Bernanke first articulated the GSG hypothesis, much of the focus was on Greenspan’s conundrum—that is, the continuing drop in long-term rates in 2004–05 despite repeated hikes in short-term rates during a strong economy. However, with the benefit of hindsight, the much longer-run, apparently secular nature of the drop in long-term real interest rates is evident. Very roughly, it seems fair to say that the ten-year real interest rate in the United States declined about 150 basis points between the latter half of the 1990s (when it averaged around 3.5 percent) and the prelude to the global financial crisis (when it averaged around 2 percent), and then it fell another 200 basis points commencing with the collapse of Lehman Brothers in September 2008 and continuing to the present. While the first drop of 150 basis points is very plausibly a consequence of capital inflows, the post-crisis drop of 200 basis points is unlikely to be attributable primarily to the GSG;9 instead, that second drop suggests a somewhat parallel story of weak domestic investment in the United States.
Figure 1. Ten-year Treasury Inflation-Protected Securities (TIPS) yield and expected ten-year real interest rate, January 1992–November 2019
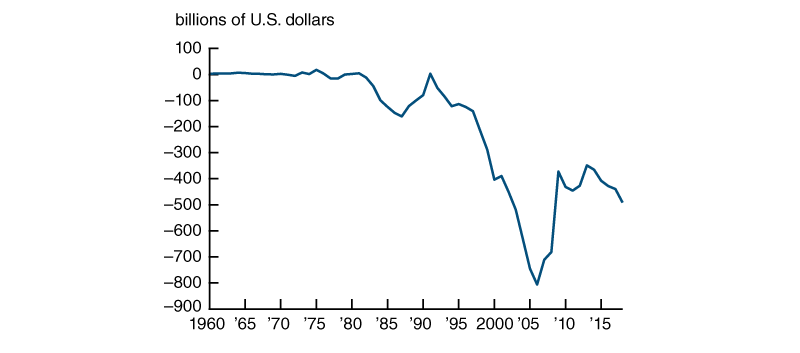
The second observation in the United States motivating the GSG hypothesis is the behavior of the U.S. current account since the early 1990s. Figure 2 shows that the U.S. current account moved steadily downward from being roughly in balance in 1992 to having a deficit of $800 billion in 2006. Such a worsening of the current account in the United States (as well as the current accounts in other major Western countries)—together with the corresponding move toward current account surpluses in Asian and other non-Western countries that we will examine next—is suggestive of a process in which a global imbalance of saving and investment developed at the initial interest rate. Such an imbalance would require a drop in long-term interest rates to reequilibrate the U.S. economy and the global economy. In particular, if the push toward current account surpluses in the GSG countries resulted from a largely exogenous increase in saving and/or decrease in domestic investment by countries in the East, we potentially have a causal story: Excess saving in the East, an important component of which is exogenous to developments in the United States (and other Western countries), leads to a reduction in world real interest rates and large current account deficits in the West. We will sketch the theory associated with such a scenario in the next section, after documenting the current account surpluses in the source countries and inquiring into their origins.
Figure 2. U.S. current account, 1960–2018
Observations in source countries
The counterpart of the large current account deficit that emerged in the United States was the surplus positions in a number of key non-Western countries that we have been referring to as source countries. Figures 3 and 4 show the evolution of the current accounts of the main source countries of the global saving glut. The figures demonstrate that between 1997 and 2006, by far the largest sources of excess saving were the developed countries and territories of Asia—that is, Japan, South Korea, Taiwan, Hong Kong (a special administrative region of China as of mid-1997), and Singapore. Beginning in 2004, China exhibited a large surge in excess saving, overtaking the saving by developed Asia only in 2007. However, since 2015, China’s current account surplus has fallen dramatically, while developed Asia’s current account surplus has risen markedly. It is thus a bit curious that in popular discourse, at least here in the United States, the global saving glut is often associated almost exclusively with China.
Figure 3. Current accounts of China and developed Asia, 1997–2018
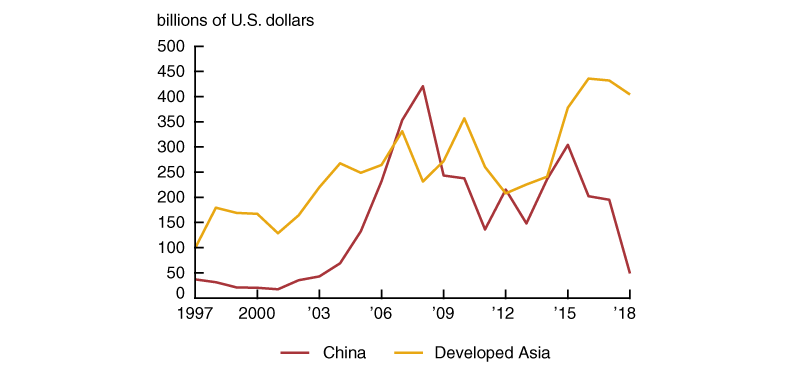
Figure 4. Current account of the Middle East and North Africa and spot price of Brent crude oil, 1997–2018
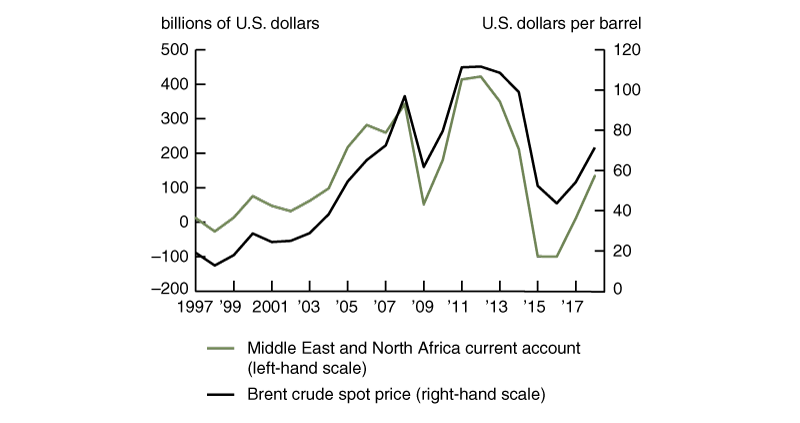
Equally striking is the growth of the current account surplus of the Middle East and North Africa region since the late 1990s. As shown in figure 4 (see the green line), in the period leading up to the Great Recession, countries in the Middle East and North Africa collectively were net savers on a similar scale as that of the Asian countries we mentioned; their combined current account was only about 25 percent less than China’s in 2007, just before the Great Recession, and eventually surpassed it in the subsequent recovery. The black line in figure 4 shows the spot price of Brent crude oil. The current account surplus of the Middle East and North Africa mirrored the world oil price rather closely from 1997 through 2018, suggesting the classic “petrodollar recycling problem” discussed avidly in the 1970s (see, for example, Emminger, 1975, and Higgins, Klitgaard, and Lerman, 2006). As the oil price increased from $25 per barrel in 2002 to $72 per barrel in 2007, the current account surplus of these oil-producing countries rose from $32 billion to $259 billion. The oil price is certainly not exogenous to macroeconomic developments in the United States and Europe (an increase in industrial output in Western countries raises demand for oil and hence its price). Yet it does not appear that the relationship between the oil price and the U.S. current account is a mere reflection of aggregate demand in the West. Rather, there seems to be at least an element of this relationship that is significantly driven by supply considerations. This bolsters the notion that capital outflows from GSG countries were at least partly determined by internal developments within these countries.
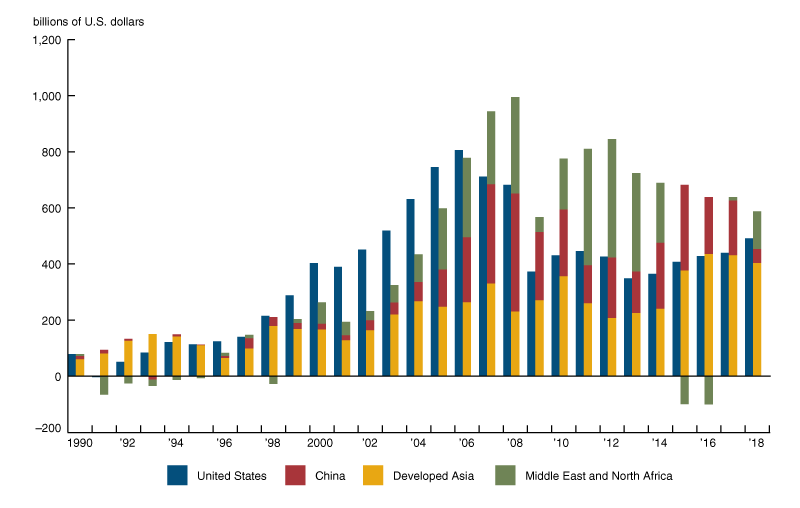
Figure 5 shows the contributions of the current account surpluses from each of the main GSG regions to capital flows to the United States. Note that the contributions of the GSG countries to the total U.S. capital account can exceed or fall short of the total because we do not account for the capital inflows from, nor the capital outflows to, other omitted countries in this figure.
Figure 5. U.S. capital account alongside major foreign current accounts, 1990–2018
What do the current account observations have to do with a drop in long-term interest rates?
Adapted from the textbook analysis of Abel, Bernanke, and Croushore (2014), figure 6 illustrates the conceptual relationship between excess saving in the East, current account deficits in the West, and the determination of the equilibrium world interest rate in a two-country model—which should be interpreted as representing the two key regions of our article.
Figure 6. Determination of equilibrium world interest rate and current accounts of net savers and net investors
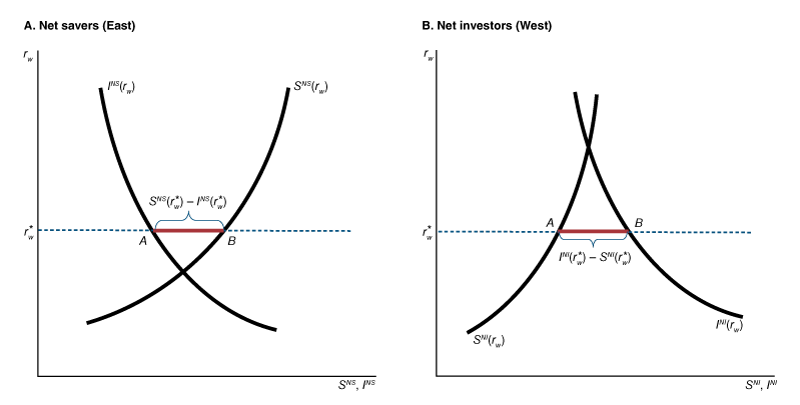
The mechanism is as follows. The world is viewed as consisting of two regions—the East and the West. Each is sufficiently large that it cannot take the world interest rate as given. Instead, the world rate is determined by the simultaneous behavior of the two regions. It is a trivial national income identity that at the world level, saving must equal investment: ${{S}_{w}}\equiv {{I}_{w}}$. If the sum of desired saving across the two regions is increasing and desired investment is decreasing, then the equilibrium world interest rate $r_{w}^{*}$ is determined by the condition that the sum of desired saving over the two regions equals the sum of desired investment:
\[{{S}^{NI}}(r_{w}^{*})+{{S}^{NS}}(r_{w}^{*})={{I}^{NI}}(r_{w}^{*})+{{I}^{NS}}(r_{w}^{*}).\]The superscripts $NS$ and $NI$ represent net savers (that is, the GSG countries, or the East) and net investors (that is, the recipient countries, or the West), respectively. Rearranging the equation slightly and recalling the key identity that the current account is the excess of saving over investment, the current account surplus in the East must be just offset by the current account deficit in the West:
\[{{S}^{NS}}(r_{w}^{\text{*}})-{{I}^{NS}}(r_{w}^{*})={{I}^{NI}}(r_{w}^{*})-{{S}^{NI}}(r_{w}^{*}).\]The equilibrium occurs at that unique $r^{*}$ at which this identity holds—that is, at the interest rate at which the length of the line segment A-B is the same in both panels.
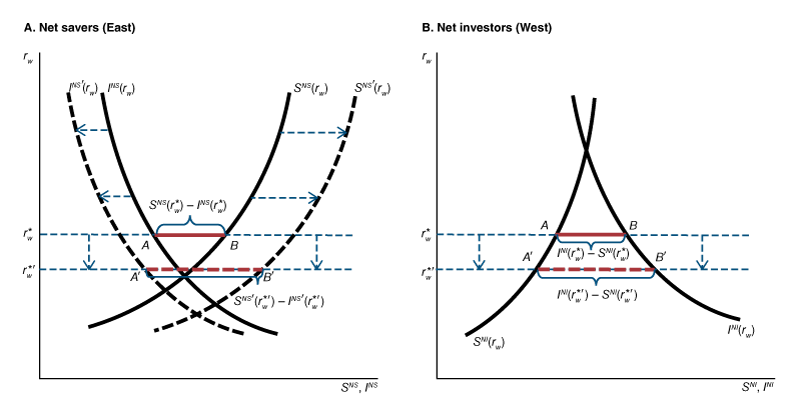
Figure 7 shows the comparative statics analysis when the countries of the East increase their saving and/or reduce their domestic investment. Just as the initial equilibrium is found by looking for the interest rate where the distance between $S$ and $I$ (that is, the length of the line segment A-B) is the same in both panels, the new equilibrium interest rate equates the distance between ${{S}^{NS^{\prime }}}$ and ${{I}^{NS^{\prime }}}$ in panel A with the distance between ${{S}^{NI}}$ and ${{I}^{NI}}$ in panel B. The world interest rate must fall, and the current account deficit in the West must increase; but the equilibrium effect on the investment of the East, as well as on world investment, depends on the relative shifts of the $S$ and $I$ curves in the East.
Figure 7. Comparative statics of equilibrium world interest rate to increased saving and/or reduced investment in the East
Saving versus investment
For the most part, it is the saving–investment balance alone that matters. It is not essential whether the impetus comes from increased saving or reduced investment. At another level, however, the difference can be important—especially if there is a change in the ability of investment projects to keep up with the growth of saving (something China in particular experienced). If difficulty in generating domestic investment projects to absorb increased saving occurs not only in developing countries (mostly in the East) but also in developed ones (mostly in the West), then this trend is of special interest, as it indicates that it may be wrong to think of the GSG as a phenomenon solely due to high saving in the East. Caballero, Farhi, and Gourinchas (2008) suggest that poor allocation of investment in developing countries is one of the reasons for these countries’ growing demand for safe and liquid assets from abroad. Further, although Summers’s secular stagnation hypothesis was put forth in terms of a dearth of investment opportunities in the United States and perhaps the rest of the West, it might in fact be in part a worldwide phenomenon.
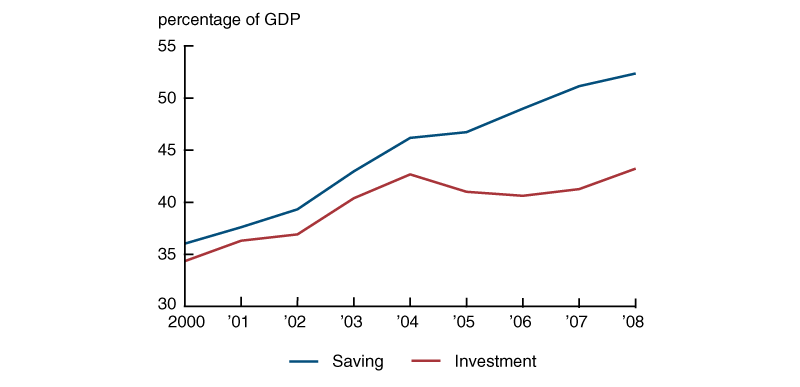
Figure 8 illustrates starkly the role that an investment slowdown elsewhere in the world can play in generating a capital account surplus in the United States. We see here that China saw its saving rise rapidly from 36 percent of GDP in 2000 to nearly 50 percent by 2006, but its investment rose as a fraction of GDP and then fell abruptly beginning in 2004. Thus, in this much-discussed period, capital outflows from China reflect first and foremost sluggish Chinese investment growth.
Figure 8. Saving and investment as a share of gross domestic product (GDP) in China, 2000–08
While the saving–investment balance at the level of individual countries and regions can clearly be positive or negative, at the world level, saving must equal investment. Figure 9 depicts a comparative statics exercise that shows this equality is preserved as the composition of saving and investment changes. The possibility that equilibrium world saving and investment (as a percentage of world GDP) might fall simply means that world investment fell more than world saving. It does not mean that there was not a global saving glut at the initial interest rate, which we explained previously is a disequilibrium situation. Using International Monetary Fund (IMF) data, Taylor (2009) showed that over the period 1970–2004, world saving and investment as a fraction of world GDP actually fell by several percentage points (see figure 3 of his paper). Taylor (2009) uses this observation to argue that there was no global saving glut at all. However, by our definition, which is consistent with Bernanke (2005) and his many subsequent contributions, the most natural reading would be that the decline in world interest rates reflected a contractionary shift in the world investment schedule that exceeded the expansionary shift in the saving schedule.
Figure 9. World saving and investment
Safety and liquidity and the preference for U.S. Treasury securities
Perhaps the most striking of all macro-finance observations in the past decade has been a large and widening gap between real Treasury yields and typical national-income-based proxies for the return on capital (see, for example, Farhi and Gourio, 2018, and Yi and Zhang, 2017). A complete treatment of the multiple considerations accounting for this observation is not in the province of this article (for an excellent recent discussion, see Farhi and Gourio, 2018). Our interest is focused purely on the possible effect of the global saving glut on this spread. In this section, we focus on large increases in the fraction of Treasury and agency securities held by investors in the GSG countries (and other foreign countries), and report the results from a rather rough counterfactual exercise to see how much the demand for safety and liquidity underlying these asset choices might have depressed Treasury yields. The initial analysis of the GSG (Bernanke, 2005) focused on saving–investment balances without regard to which assets the capital flows were directed toward. Later analyses (see, for instance, Bernanke et al., 2011; see also Hall, 2017, for a more abstract analysis) focused specifically on a putative demand for safe and liquid assets, which caused the capital flows from China and other Asian countries to be used primarily for purchases of long-term U.S. Treasury bonds (and, to a much smaller extent, agency bonds). The bulk of recent GSG discussion has focused on this channel, motivated precisely by the apparent widening of the spread between real Treasury yields and returns on physical capital.
One might wonder what the increased demand for Treasury securities per se has to do with a global saving glut. Perhaps the demand for safety and liquidity in the East is simply a flight to quality, without implications for the overall saving rate. Yet Kimball (1992) provides plausible conditions under which the demand for safety and liquidity and the demand for increased overall saving go hand in hand. The conditions are quite technical and, therefore, challenging to explain in simple, intuitive terms. First of all, they involve a positive third derivative, which is well known to be the condition required by precautionary saving (Leland, 1968). It is the second condition—a sufficiently negative fourth derivative—that is much more difficult to explain. This condition is necessary to conclude that an increase in exogenous risk, uncorrelated with any initial risk, leads to an increase in the demand for saving in riskless assets in particular (see Kimball, 1992). These two conditions are satisfied, for example, by the class of constant relative risk aversion (CRRA) utility functions, which are by far the most commonly used utility functions in the macro-finance literature.
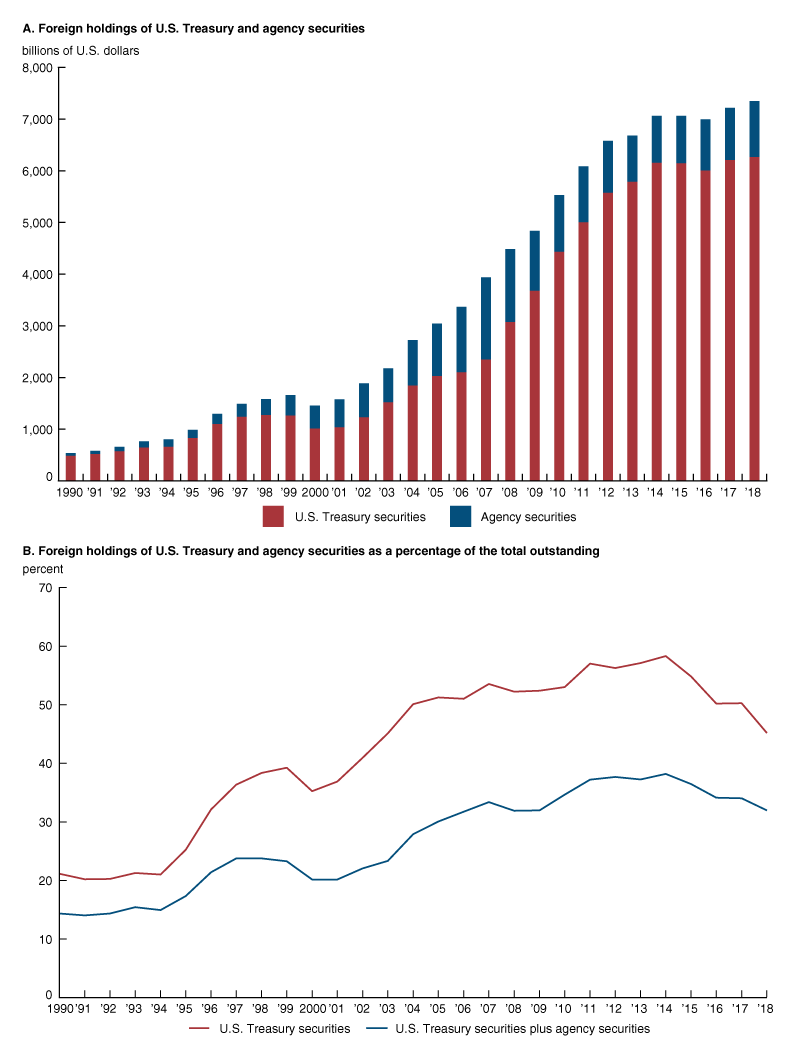
Panels A and B of figure 10 show the dramatic increase in foreign holdings of U.S. Treasury and agency securities since 1990, both in U.S. dollar terms and in percent terms (that is, as shares of total outstanding securities of those types). Note in particular the increase in the fraction of Treasury securities held outside the United States from around 20 percent in 1994 to around 50 percent in 2006. Based on the analysis in Krishnamurthy and Vissing-Jorgensen (2012), we present a rough counterfactual exercise to get an idea of the plausible magnitude of the effect on Treasury yields of this rising demand for safety and liquidity coming from abroad.
Figure 10. Foreign ownership of U.S. Treasury and agency securities, 1990–2018
Krishnamurthy and Vissing-Jorgensen (2012) measure the particular safety and liquidity characteristics of U.S. Treasury securities by the spread between long-maturity AAA corporate bond and Treasury yields. In particular, figure 1 of their paper plots the AAA corporate bond–Treasury yield spread against the ratio of Treasury debt to GDP (a proxy for the supply of Treasury securities) based on annual observations over the period 1919–2008. They document a strong negative, though nonlinear, relationship between the Treasury-debt-to-GDP ratio and the AAA corporate bond–Treasury yield spread, suggesting that when Treasury debt is in plentiful supply, Treasury yields fall relative to the benchmark AAA corporate bond rate. Conversely, a scarcity of Treasury securities is associated with high Treasury yields relative to the benchmark AAA corporate bond rate. Figure 11 plots the Krishnamurthy and Vissing-Jorgensen (2012) data on a log scale, with a kernel smoother summarizing the relationship between the ratio and spread. Note that the relationship is reasonably linear in logs.
Figure 11. Spread between long-maturity AAA corporate bond and U.S. Treasury yields versus the ratio of U.S. Treasury debt to gross domestic product (GDP)
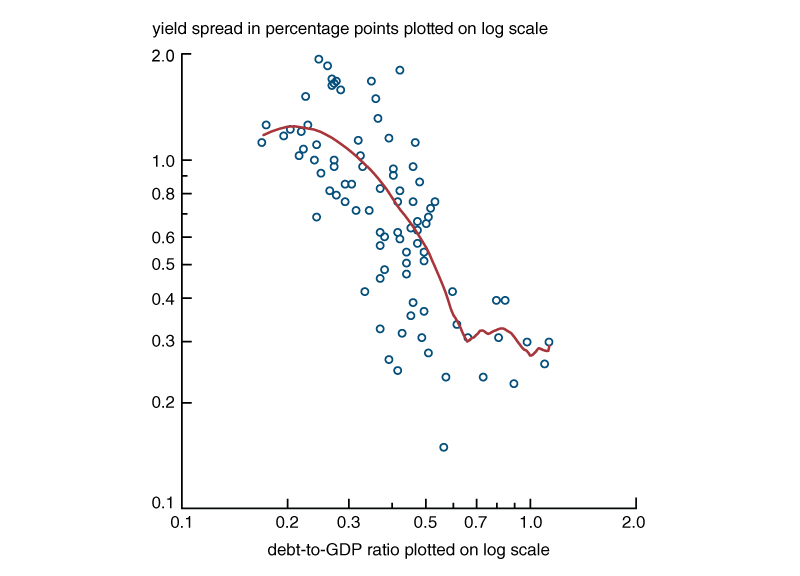
Our strategy is to treat foreign purchases of Treasury securities as a subtraction from the supply available to U.S. investors. Thus to arrive at the effective domestic supply, the Treasury-debt-to-GDP ratio is multiplied by one minus the fraction of Treasury securities held abroad. Note that this ratio (in decimal form) in 2007 is 0.37. The fitted spread, as indicated by the red line in figure 11, is then about 80 basis points. If 50 percent of the Treasury debt went to foreigners, the effective domestic ratio of Treasury debt to GDP would have been 0.19, and the fitted value goes up to about 130 basis points. By this measure, the effect of foreign purchases of Treasury securities is a decline of 50 basis points in the spread between the AAA corporate bond yield and the Treasury yield.
A limitation of our counterfactual exercise is that we do not know what the effect of the GSG was on the AAA bond rate. But if we think of a segmented market in which GSG countries were interested particularly in U.S. Treasury securities—and particularly because of safety and liquidity effects captured by the Krishnamurthy and Vissing-Jorgensen (2012) measure—our exercise should provide some notion of the extent to which foreign purchases of Treasury securities might have depressed their yields. Our estimate of a 50 basis point decline is substantial and helps to explain perhaps a third of the Greenspan conundrum, but it goes only a relatively small distance toward solving the overall puzzle of why the return on capital appears to have been so stable as safe and riskless rates fell sharply.
Conclusion
We reviewed and reassessed the global saving glut hypothesis as an explanation for depressed interest rates and the concomitant effects on asset prices and financial stability as put forth by Bernanke (and his co-authors) in various speeches and research papers. We identified two conceptually distinct mechanisms through which capital flows from East to West might have operated: 1) a pure saving–investment, or current account, channel (as shown in figures 6 and 7), and 2) a safe and liquid assets channel, which lowers interest rates on Treasury and agency securities without depressing the return on capital (as illustrated by the counterfactual exercise in figure 11). With respect to the first channel, we stressed that the GSG reflected both an increased desire to save on the part of economies in East Asia and in the Middle East and North Africa, as well as a relative dearth of investment demand worldwide. The role of inadequate investment links the GSG hypothesis to Summers’s secular stagnation hypothesis. We found the second channel helpful for explaining why the rates on safe and liquid assets fell while national-income-based measures of the return on capital showed no drop. Borrowing from Krishnamurthy and Vissing-Jorgensen (2012), we estimated that the safety and liquid assets channel accounted for about 50 basis points of the drop in U.S. Treasury yields. With the benefit of considerably more historical experience since the earlier work on the GSG hypothesis, we also documented some evidence about the evolution of global saving and investment from the Great Recession to the present. We observed that the decline in the absolute value of current accounts paralleled the reduction in gross trade flows occasioned by the Great Recession. Consequently, we concluded that the ability of the GSG hypothesis to explain the fall in long-term real rates between 2002 and 2006 is probably significantly greater than its ability to account for the further fall in rates from the Great Recession onward.
Notes
1 The Group of Seven (G7) is an intergovernmental organization whose members are Canada, France, Germany, Italy, Japan, the United Kingdom, and the United States.
2 For a retrospective view of the conundrum—which was discussed 2004 and 2005 speeches given by Alan Greenspan, the Federal Reserve Chair prior to Ben Bernanke—see Greenspan (2010). For a very different view of the conundrum, see Rudebusch, Swanson, and Wu (2006).
3 A country’s current account is the sum of its net trade in goods and services, net earnings from cross-border investments, and net transfer payments. A positive current account surplus indicates that the country’s spending falls short of its income.
4 Agency bonds are debt obligations issued by government-sponsored enterprises (GSEs) or U.S. federal government agencies (other than the U.S. Treasury Department).
5 The textbook by Abel, Bernanke, and Croushore (2014) has a diagrammatic analysis of saving, investment, current accounts, and world interest rates that is very suitable for this purpose. The analysis in this textbook is likely to have been strongly influenced by Bernanke’s interest in the GSG hypothesis, although the authors do not use their apparatus for this express purpose.
6 A country’s capital account records the inflows and outflows of capital that determine the evolution of its stock of foreign assets net of liabilities. To a first approximation, a country’s current account surplus and capital account surplus sum to zero, and a current account surplus in one region of the world is reflected one for one in a capital account surplus in the remaining regions.
7 According to the secular stagnation hypothesis, the United States and many other developed economies are experiencing not only high saving but also a chronic dearth of investment opportunities, leading to persistently low interest rates and weak inflation, along with slow growth and other symptoms. See Summers (2013, 2016).
8 Further information on TIPS is available online. Further details about the Survey of Professional Forecasters are available online.
9 The inception of the secular decline in long-term real interest rates is often dated considerably earlier. Because of the confounding effect of the Volcker disinflation and its possibly protracted aftermath, we prefer to begin with the 1990s (in particular, in 1993, after the recovery from the 1990–91 recession), which is also the approximate time at which the GSG phenomenon begins to show up in the data. That is not to deny the possibility that the secular decline in long-term real interest rates is a much longer-run phenomenon. Rachel and Summers (2019) show that even the 1970s, which are famous for episodes of negative short-term real interest rates, featured long-term real interest rates in the neighborhood of 2 percent.
References
Abel, Andrew B., Ben S. Bernanke, and Dean Croushore, 2014, Macroeconomics, 8th ed., Boston, MA: Pearson.
Bernanke, Ben S., 2009, “Welcome address: Asia and the global financial crisis,” in Asia and the Global Financial Crisis, Reuven Glick and Mark M. Spiegel (eds.), San Francisco: Federal Reserve Bank of San Francisco, pp. 11–22, available online.
Bernanke, Ben S., 2005, “The global saving glut and the U.S. current account deficit,” Federal Reserve Governor’s remarks at the Sandridge Lecture, Virginia Association of Economists, Richmond, VA, March 10, available online.
Bernanke, Ben S., Carol Bertaut, Laurie Pounder DeMarco, and Steven Kamin, 2011, “International capital flows and the returns to safe assets in the United States, 2003–2007,” International Finance Discussion Papers, Board of Governors of the Federal Reserve System, No. 1014, February. Crossref
Caballero, Ricardo J., Emmanuel Farhi, and Pierre-Olivier Gourinchas, 2008, “An equilibrium model of ‘global imbalances’ and low interest rates,” American Economic Review, Vol. 98, No. 1, March, pp. 358–393. Crossref
Eggertsson, Gauti B., Neil R. Mehrotra, and Lawrence H. Summers, 2016, “Secular stagnation in the open economy,” American Economic Review, Vol. 106, No. 5, May, pp. 503–507. Crossref
Emminger, Otmar, 1975, “International financial markets and the recycling of petrodollars,” World Today, Vol. 31, No. 3, March, pp. 95–103, available online by subscription.
Farhi, Emmanuel, and François Gourio, 2018, “Accounting for macro-finance trends: Market power, intangibles, and risk premia,” Brookings Papers on Economic Activity, Vol. 49, No. 2, Fall, pp. 147–223, available online.
Greenspan, Alan, 2010, “The crisis,” Brookings Papers on Economic Activity, Vol. 41, No. 1, Spring, pp. 201–246, available online.
Hall, Robert E., 2017, “Low interest rates: Causes and consequences,” International Journal of Central Banking, Vol. 13, No. 3, September, pp. 103–117, available online.
Higgins, Matthew, Thomas Klitgaard, and Robert Lerman, 2006, “Recycling petrodollars,” Current Issues in Economics and Finance, Federal Reserve Bank of New York, Vol. 12, No. 9, December, available online.
Kimball, Miles, 1992, “Precautionary motives for holding assets,” in The New Palgrave Dictionary of Money and Finance, Peter Newman, Murray Milgate, and John Eatwell (eds.), Vol. 3, New York: Stockton Press, pp. 158–161.
Krishnamurthy, Arvind, and Annette Vissing-Jorgensen, 2012, “The aggregate demand for Treasury debt,” Journal of Political Economy, Vol. 120, No. 2, April, pp. 233–267. Crossref
Leland, Hayne E., 1968, “Saving and uncertainty: The precautionary demand for saving,” Quarterly Journal of Economics, Vol. 82, No. 3, August, pp. 465–473. Crossref
Rachel, Łukasz, and Lawrence H. Summers, 2019, “On secular stagnation in the industrialized world,” Brookings Papers on Economic Activity, Vol. 50, No. 1, Spring, pp. 1–54, available online.
Rudebusch, Glenn D., Eric T. Swanson, and Tao Wu, 2006, “The bond yield ‘conundrum’ from a macro-finance perspective,” Monetary and Economic Studies, Vol. 24, No. S-1, December, pp. 83–109, available online.
Summers, Lawrence H., 2016, “The age of secular stagnation: What it is and what to do about it,” Foreign Affairs, Vol. 95, No. 2, March/April, pp. 2–9, available online by subscription.
Summers, Lawrence H., 2013, speech at the International Monetary Fund’s Fourteenth Jacques Polak Annual Research Conference, Crises: Yesterday and Today, in honor of Stanley Fischer, Washington, DC, November 8, available online.
Taylor, John B., 2009, “The financial crisis and the policy responses: An empirical analysis of what went wrong,” National Bureau of Economic Research, working paper, No. 14631, January. Crossref
Yi, Kei-Mu, and Jing Zhang, 2017, “Understanding global trends in long-run real interest rates,” Economic Perspectives, Federal Reserve Bank of Chicago, Vol. 41, No. 2, available online.


