

Introduction and summary
Immigration has been one key driver of labor market dynamics in the post-pandemic U.S. economy. In December 2024, the U.S. Census Bureau released new estimates of net migration (Gross et al., 2024). These roughly doubled estimates of net migration to the United States from July 1, 2022, to June 30, 2023 (from 1.1 million to 2.3 million). The estimate for July 1, 2023, to June 30, 2024, is 2.8 million (this is about 2% of the U.S. labor force). The size of the immigrant inflow has important implications for the size of the labor force, which in turn affects how one interprets standard metrics about the economy, such as the number of jobs created each month. For instance, prior to the increased immigration flows over the past two years, estimates of the “break-even” level of new jobs created each month—the number of new jobs needed to keep the unemployment rate steady—were around 80,000; with the larger labor force size, driven by both higher immigration and higher labor force participation, the estimates roughly doubled to around 160,000 (see, for example, Edelberg and Watson, 2024). To understand whether the economy is overheating or not, policymakers closely follow whether the number of new jobs being created each month is above or below the break-even level. Understanding the size and source of the immigrant inflow is thus important for policy.
The new estimates for net migration are informed by many sources, including administrative data on visa issuances, refugee and asylee admissions, and the like (the appendix contains a collection of related sources). The terms used for different categories of immigrants may be unfamiliar to many who are interested in labor market developments, so it may be helpful to provide definitions of different groups. Here, we do just that, providing a taxonomy of the categories of immigration flows. We divide the discussion into what we label “regular immigration”—the typical avenues for immigrating lawfully into the United States—and “irregular immigration”—the other ways of entering the country, which include unlawful entry, but also other types of entry that can lead to lawful status.
We describe what happened over the past couple of years in terms of these immigration categories. We also describe recent policy changes and briefly discuss how they affect the uncertainty around immigration flows in the months and years ahead.
Regular immigration
In this section we describe the typical avenues for immigrating lawfully into the United States.
Immigrant visas
The U.S. Department of State grants immigrant visas to individuals who are outside the United States under a variety of categories.1 Immigrant visas are in three groups: family-based, employment, and diversity visas. Family-based visas are the largest component of immigrant visas. There is no numerical limit to the number of immigrant visas that may be granted each year to the immediate family members of U.S. citizens. Other family-based, employment, and diversity visas are capped each year. Immigrant visa holders are allowed to apply for a green card (permanent resident status) once they are in the United States. Regardless of whether they pursue a green card, most adult individuals who obtain immigrant visas can and do apply for work authorization and quickly join the labor force. Figure 1 plots the number of immigrant visas granted for every fiscal year since 2000. While the numbers fell considerably during the pandemic, they reached an all-time high of nearly 650,000 in 2024. However, the rebound was not enough to make up for the shortfall in 2020–21. The 2002–18 trend suggests we would have expected about 500,000 visas per year, or 2 million total, over the 2019–22 period, whereas only about 1.5 million were granted.
1. Immigrant visas
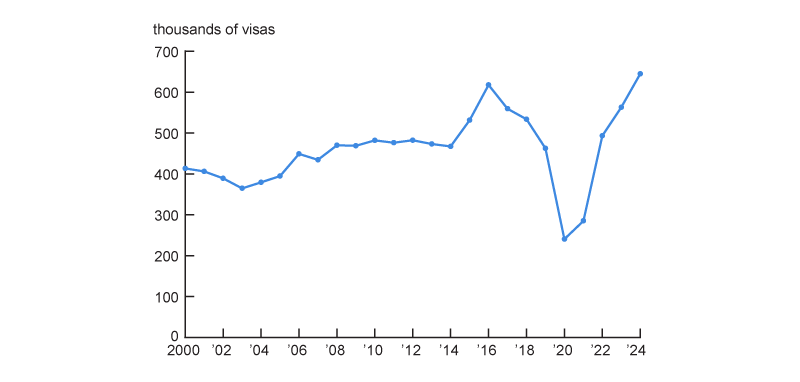
Source: Authors’ calculations based on data from the U.S. Department of State, Travel.State.Gov., Visa Statistics, available online.
Nonimmigrant visas and status adjustments
The State Department also grants a variety of nonimmigrant visas.2 The main categories are tourist visas (B), student visas (F), and work visas (H for temporary workers and O for individuals with extraordinary ability). Short-term (up to 90 days) tourist and business travelers make up the bulk of nonimmigrant admissions. Those from countries eligible for the Visa Waiver Program do not need to apply for a visa, but they do need to get authorization to enter through the Electronic System for Travel Authorization and are expected to leave by a given date. Students and temporary workers are considered to be temporarily in the United States, and they are expected to leave the country by the time their visa status expires. However, a fraction of people with nonimmigrant visas request and obtain an adjustment of status to transition into permanent residency. Figure 2 plots the number of F and H visas issued since fiscal year 1996 (the two largest categories under which a status adjustment is possible). Together, these two categories accounted for around 12% of all nonimmigrant visas in fiscal year 2023, according to our calculation based on the State Department’s annual Report of the Visa Office data. Each year there are people who adjust their status from nonimmigrant to immigrant—for example, a student (with an F visa) who demonstrates extraordinary ability (thus qualifying for an E1 visa)3 or a temporary worker (with an H visa) who gets married to a U.S. citizen (thus qualifying for an IR1 or CR1 visa).4 Since the mid-2000s, around 500,000 people per year have obtained an adjustment of status, with a large fraction of them having originally been in the United States under F and H visas (Ward, 2024, figure 3, p. 6). In 2024, for example, nearly 120,000 individuals adjusted their status related to employment-based preferences.5
2. Student and temporary worker nonimmigrant visas
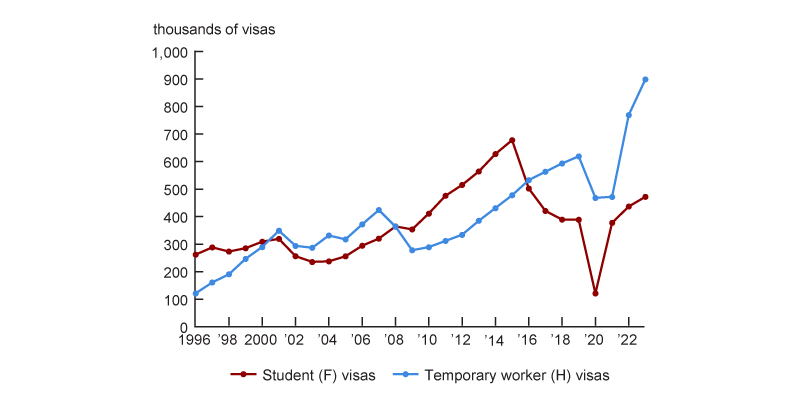
Source: U.S. Department of State, Travel.State.Gov, Reports of the Visa Office (annual reports), table XV (in reports for fiscal years 2020–23) or table XVI (in reports for fiscal years 2000–19), available online.
Refugees
Under U.S. law, refugees are individuals outside the United States who are of humanitarian concern, by demonstrating persecution or fear of persecution against them due to race, religion, nationality, political opinions, or membership in particular social groups. Individuals apply for refugee status outside the United States. Each year, the U.S. Department of Homeland Security (DHS) sets region-specific caps on the maximum number of refugee admissions. These caps have bound infrequently in the past quarter century. Individuals (and their family members) granted refugee status obtain work permits immediately upon arrival and can apply for a green card after a year. Figure 3 plots the number of refugees admitted in the past 24 years. After the drastic pandemic drop, refugee admissions have grown rapidly and reached more than 100,000 in 2024, well above the 70,000 pre-pandemic average.
3. Refugee admissions
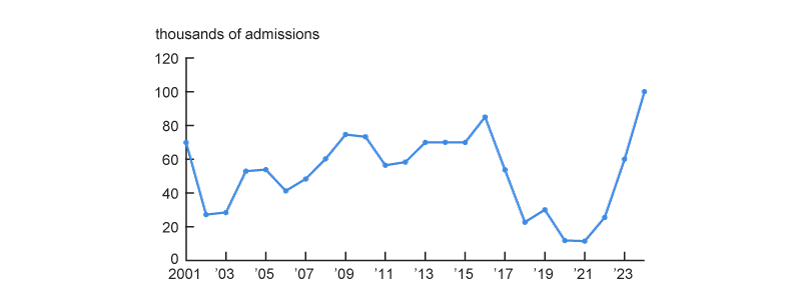
Source: U.S. Department of State, Bureau of Population, Refugees, and Migration, Office of Admissions, Refugee Processing Center, Refugee Admissions Report, available online.
Asylum
The asylum process is part of what we are calling the regular flow of immigrants to the United States. As described later in the section on what we refer to as irregular immigration, asylum seekers may also be a part of the irregular immigration flow—for example, if their claims are denied and they remain in the United States or if they request asylum as part of deportation proceedings. Here, we first describe the regular asylum rules and processes.
Title 8 of the U.S. Code governs “aliens and nationality.” Under Title 8, individuals who are inside or reach the United States have the legal right to apply for asylum because of persecution or fear of persecution due to race, religion, nationality, political opinions, or membership in particular social groups. Although the reasons for being granted refugee and asylum status are similar, asylum requests differ from refugee requests in that they can only be undertaken by individuals physically present in the United States, including at ports of entry. As discussed in more detail later, during the Covid-19 pandemic emergency, Title 42 of the U.S. Code, governing “the public health and welfare,” was invoked in March 2020. Under Title 42, asylum seekers could be denied entry because of the public health emergency. When the federal Covid-19 public health emergency was declared over, in May 2023,6 the rules governing asylum reverted to those under Title 8.
Under Title 8 of the U.S. Code, asylum applications are first reviewed by DHS officers,7 who can either grant asylum or forward the application to an immigration court for further review. Asylum claims can be of two types: affirmative or defensive. Affirmative claims are those made by individuals who, while lawfully or unlawfully in the United States, on their own initiative contact DHS to apply for asylum. There are also defensive claims. These claims are filed by individuals who are already under a deportation proceeding in the United States and make the asylum claim as part of their defense within their deportation proceeding. This defensive claims group might be best categorized under irregular immigration, but we describe it here for the sake of completeness.
People who request asylum can apply for a provisional work authorization 180 days after the asylum application date and while their case is pending. The work permit expires if the asylum claim is denied. If the asylum claim is granted, the asylee is authorized to work in the United States immediately and can apply for a green card after a year. Figure 4 plots the number of processed—meaning a determination has been made—asylum cases since 2014, together with the grant rate (fraction of processed cases granted asylum). The grant rate has been trending down since 2014 and now stands at around 0.12, or 12% (according to the 2024 numbers, which are the latest asylum data available).
4. Processed asylum cases
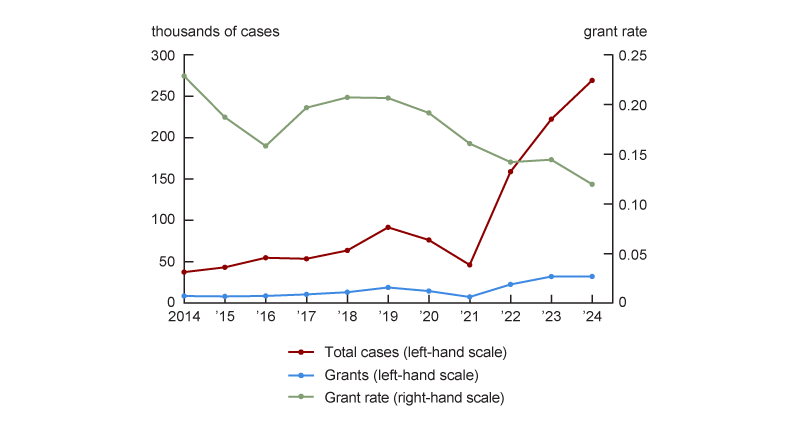
Source: Authors’ calculations based on asylum decisions data from the U.S. Department of Justice, Executive Office for Immigration Review, Workload and Adjudication Statistics, available online.
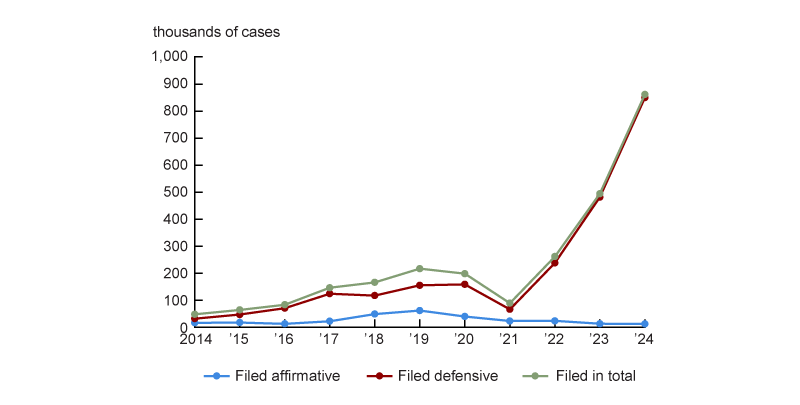
Figure 4 also shows the dramatic increase in asylum cases processed in 2022–24. Over this three-year period, approximately 85,000 asylum applications were granted. The numbers of processed cases granted asylum from this period reflect the similarly dramatic increase in asylum applications since 2022, which we present in figure 5. As this figure illustrates, the sharp increase in asylum cases filed in the past three years has been driven by defensive asylum cases. This is because under policies introduced after 2021, individuals were able to apply for asylum at the southern border of the United States through the CBP One mobile application from U.S. Customs and Border Protection (CBP) once they had surrendered to U.S. Border Patrol.8 At that point, DHS would formally begin deportation proceedings against them. In this case, their asylum request was considered defensive. The number of asylum cases filed in 2024 was nearly 368,000 higher than in 2023.
5. Number of asylum cases filed
Source: Total asylum applications data from the U.S. Department of Justice, Executive Office for Immigration Review, Workload and Adjudication Statistics, available online.
It is important to understand that in December 2018 the federal government announced the Migrant Protection Protocols, better known as the Remain in Mexico program, which it implemented in January 2019 (American Immigration Council, 2024). Under the previous Title 8 policy, individuals filing an asylum claim at the U.S. border would be granted parole and let into the United States to await the resolution of their cases; however, the new policy required those seeking asylum to wait in Mexico for the duration of their immigration proceeding. This policy was rescinded in August 2022 (U.S. Department of Homeland Security, 2022). Thus, the bulk of the asylum cases between 2019 and 2022 involved individuals who were not present in the United States while their cases were being considered. Figure 6 summarizes our port-of-entry-related discussion with a flowchart sketching the different paths an individual filing an asylum claim through the CBP One app could take, along with the legal institutions governing them. Although the CBP One app was discontinued in January 2025 (American Immigration Council, 2025), almost all the asylum filings in 2022–24 from figure 5 are currently at some point along the paths in figure 6.
6. Port-of-entry asylum claims through the CBP One app and their subsequent paths, 2022–24

Sources: Federal Reserve Bank of Chicago staff based on various U.S. Department of Homeland Security and U.S. Department of Justice sources.
Irregular immigration
In this section we describe the irregular ways of immigrating to the United States, including unlawful entry, but also other types of entry that can lead to lawful status.
Asylum nonadjudications
Historically, around 25% of processed asylum cases (the average pre-2019) end up being denied in absentia because the relevant individuals do not show up to the proceedings.9 Unless detained and removed through subsequent interior immigration enforcement, it is reasonable to assume that most of the individuals involved in these cases stay in the United States unlawfully. Pre-2019, this amounted to around 10,000 people per year.10 Given the change in the nature of asylum applications since 2021, we expect the rate of nonadjudications to be higher. Applying the historical rate, however, would imply around 50,000 individuals a year remaining in the United States unlawfully in this way.11 However, for the years 2019–22 such a number would likely be a considerable overestimation given that most asylum seekers were subject to the Migrant Protection Protocols and thus were not present in the country.
Nonimmigrant visas
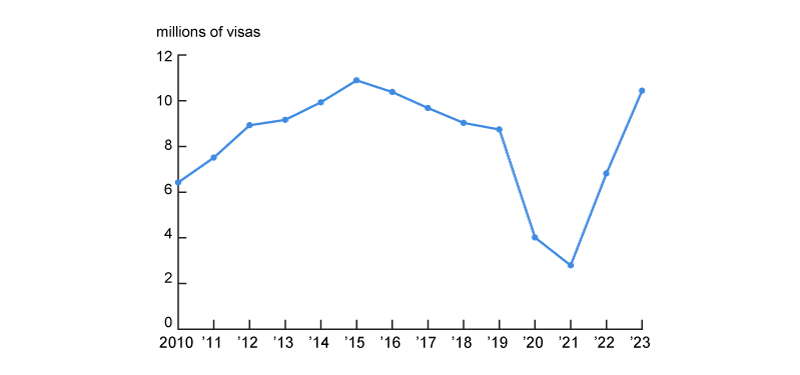
As we mentioned earlier, the State Department grants nonimmigrant visas to foreigners interested in visiting the United States temporarily, for example, for vacation, business trips, study, or temporary work. Figure 7 plots the yearly number of nonimmigrant visas issued since fiscal year 2010. The number of such visas issued increased steadily to a peak of almost 11 million in fiscal year 2015. The fiscal years 2020 and 2021 saw a significant fall in the number of nonimmigrant visas issued. But the issuance of nonimmigrant visas has since rebounded to a level similar to the pre-pandemic peak. Individuals granted such visas are required by law to leave the United States after their visit.12 However, some individuals in the country on nonimmigrant visas overstay them (this means they do not leave the country by the date indicated by the immigration officer admitting them). Because DHS tracks the lawful entries to and exits from the country through airports and ports,13 it can produce precise estimates of the number of people who overstay their nonimmigrant visas. Once a person has overstayed their visa, they are unlawfully in the United States.
7. Nonimmigrant visas
Source: U.S. Department of State, Travel.State.Gov, Nonimmigrant Visa Statistics, available online.
Overstayers
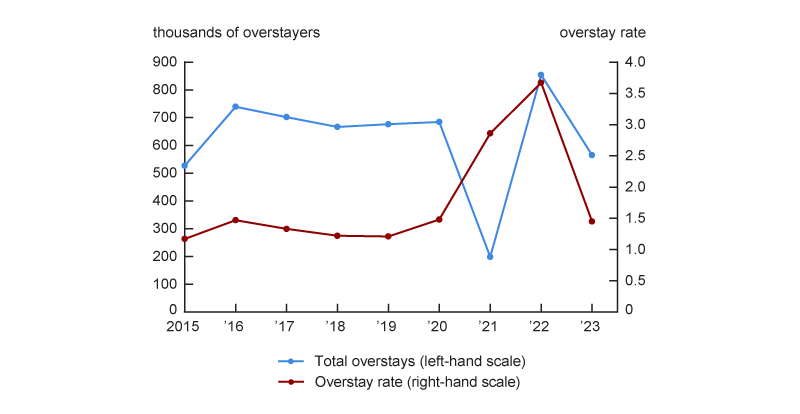
Visitors who overstay their nonimmigrant visas are not the only overstayers. Individuals who enter the country under the visa waiver program or under other types of visas such as an F visa or J visa may also overstay if they do not leave the country by the date indicated by the immigration officer admitting them (for example, individuals on student visas who did not leave after their study program ended). Figure 8 shows the total yearly number of overstayers and the overstay rate. The number of overstayers in the figure are all individuals who DHS expected to leave in a given fiscal year according to their admission status, but who did not. This reflects overstayers under any admission status. Throughout the pre-pandemic years, the overstay rate was around 1.4% overall,14 with around 700,000 overstayers per year15 (as shown in figure 8). The overstay rate, however, jumped up in 2021 and 2022, reaching over 3.5% in 2022 and implying around 850,000 overstayers that year. It returned to more typical levels in 2023 (the last year with available data).
8. Overstayers and the overstay rate
Source: U.S. Department of Homeland Security, Entry/Exit Overstay Reports, available online.
Encounters
DHS considers three types of irregular immigration cases under the umbrella of encounters: 1) inadmissibles, which refer to individuals who under Title 8 of the U.S. Code are deemed inadmissible at a port of entry by an immigration officer; 2) apprehensions, which refer to individuals who are detained by the U.S. Border Patrol under Title 8 authority for attempting to cross the U.S. border unlawfully; and 3) expulsions, which refer to individuals who were denied entry to the United States under the Covid-19 public health emergency declaration based on Title 42 (discussed earlier). In this subsection, we discuss the first two types (and we go over the third type later in a section covering outflows of individuals from the United States).
Inadmissibles (under Title 8 of the U.S. Code)
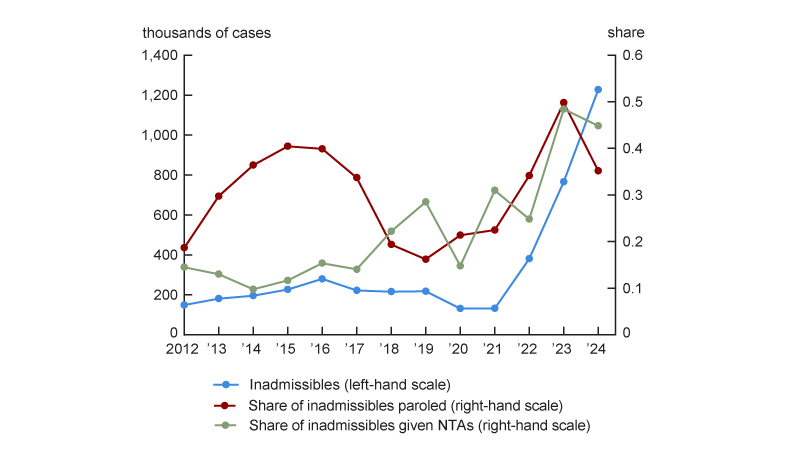
Immigration officers at ports of entry have discretion to determine whether an individual seeking to enter the country is admissible or not. The blue line in figure 9 plots the total number of inadmissible cases each year over the period 2012–24.16Inadmissible cases hovered around 200,000 from 2012 through 2019, fell to around 130,000 in 2020 and 2021, and jumped rapidly afterward to more than 1.2 million in 2024.17 Cases of individuals deemed inadmissible can then proceed in a variety of ways, and the law allows for provisions under which these inadmissible individuals can still enter the United States. After 2021, the bulk of inadmissible cases under which individuals enter the country involve parole and a Notice to Appear (NTA), which is a charging document to initiate removal proceedings in an immigration court against an individual deemed inadmissible, usually indicating a date to appear in court (see also Immigrant Legal Resource Center attorneys, 2020).18 Indeed, the sharp increase in the inadmissibles group after 2021 reflects several factors, including an increase in the number of people reaching the U.S. southern border to request entry, the end of the Title 42 emergency, and the considerable increase in the issuing rate of NTAs at the border. Figure 9 plots the fraction of inadmissible cases in the parole and NTA categories. In 2023, for example, 50% of inadmissible individuals were paroled, and 48% were given an NTA. Many of these cases involved asylum applications. The large fractions of parole and NTA cases in 2023 sharply contrasted with these fractions in the pre-pandemic years, when typically, more than half of the inadmissible cases were put under some form of removal proceeding or were withdrawn, according to data from the Transactional Records Access Clearinghouse (TRAC) at Syracuse University.
9. Inadmissibles under Title 8 of the U.S. Code
Source: Authors’ calculations based on data from the Transactional Records Access Clearinghouse (TRAC).
The increase in asylum cases filed at ports of entry (see figure 5) explains the large increase in parole and NTA cases since 2022. Under the policies from 2022 through 2024, individuals who claimed asylum at the U.S. border could be: 1) admitted into the country under parole for humanitarian reasons, in which case they would be given a subsequent appointment with a DHS officer to determine the validity of their claim (these individuals could apply for a work permit after 180 days), or 2) given a Notice to Appear. While under an NTA, individuals cannot work or apply for a work permit. They can, however, subsequently file for (defensive) asylum once their removal proceeding has been filed, at which point they are eligible to apply for a work permit after 180 days. It is worth pointing out that for the past couple of years immigration courts have faced a severe backlog in their processing of cases (3.6 million cases awaited processing at the end of fiscal year 2024, according to the Congressional Research Service19). As a result, an NTA date for a court appearance can be scheduled several years after the individual has entered the country.
Apprehensions (under Title 8 of the U.S. Code)
Under Title 8 of the U.S. Code, individuals who cross the U.S. border unlawfully are subject to arrest by the U.S. Border Patrol.20 Once under U.S. Immigration and Customs Enforcement (ICE) custody, they are put under a removal proceeding. Figure 10 plots the number of U.S. Border Patrol apprehensions since 2010. Pre-pandemic, an average of around 300,000 apprehensions took place every year. Since 2022, a remarkable increase in unlawful border crossings has occurred, reaching over 1.5 million arrests each year in 2023 and 2024. We should emphasize that individuals who cross the border unlawfully and are expelled can engage in multiple crossing attempts. The numbers reported here count arrests, not unique individuals.
10. U.S. Border Patrol apprehensions
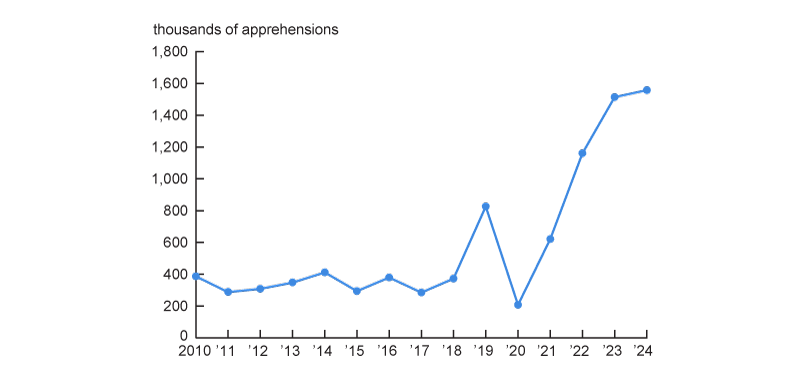
Sources: Transactional Records Access Clearinghouse (TRAC); and U.S. Department of Homeland Security (DHS), U.S. Customs and Border Protection (CBP).
Prior to June 2024 most apprehended individuals were able to claim defensive asylum during their deportation proceedings. However, in June 2024, the federal government changed the rules so that asylum claims by apprehended individuals are only allowed in exceptional circumstances. We will explain this in more detail later in this article.
Nonencounters (entry without inspection, or EWI)
Given the length of the U.S. southern border and the limited resources of the U.S. Border Patrol, every year many individuals cross the border unlawfully without being apprehended. The nature of these population flows makes them very hard to measure. DHS considers two categories of individuals successfully entering the country unlawfully: “got-aways” and “never encountered.” Got-aways refer to individuals who are detected at the border but who nevertheless manage to evade border enforcement. Never encountered refers to individuals who cross the border undetected. The only estimates of these two categories that we have come from former Secretary of Homeland Security Alejandro Mayorkas and former U.S. Border Patrol Chief Raul Ortiz; according to their congressional testimonies, there were about 600,000 got-aways and 90,000 never-encountered individuals in fiscal year 2023.21
Outflows
In this section we discuss the outflows of individuals from the United States.
Expulsions (Title 42 of the U.S. Code)
As noted earlier in this article, in May 2020 the federal government issued an emergency declaration allowing it to use the authority of the U.S. Code’s Title 42 (part of a 1944 law called the Public Health Service Act) to expel individuals encountered at the U.S. border while attempting to cross it, as a matter of public health. This pandemic-era change drastically reduced the number of asylum applications in 2021 (see figure 5) because individuals were expelled without being able to apply for asylum. In May 2023 the public health emergency was declared over, effectively extinguishing CBP’s discretionary authority based on Title 42 to expel individuals at the border. Once the public health emergency declaration was rescinded—and given the expectation of a surge in the number of asylum claims—the federal government authorized the use of the CBP One app to apply for asylum (American Immigration Council, 2025). Figure 11 plots the number of expulsions under Title 42 while it was in place.
11. Expulsions under Title 42 of the U.S. Code
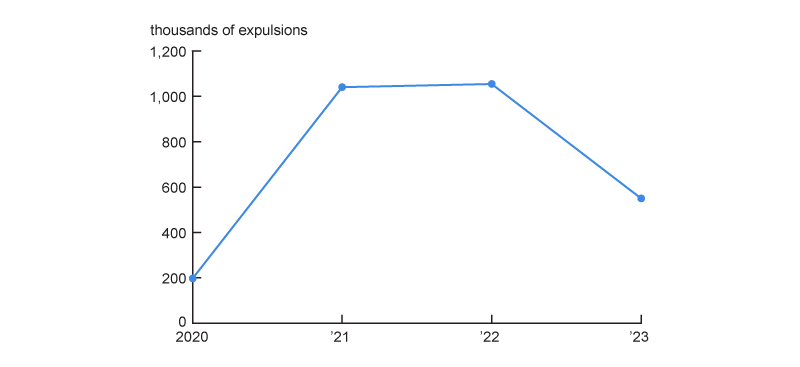
Source: U.S. Department of Homeland Security (DHS), U.S. Customs and Border Protection (CBP).
Deportations
Immigration numbers may decrease because of return migration, deaths, and deportations. Figure 12 plots the yearly numbers of deportations since 2003. The highest number of deportations—about 408,000—happened in 2012. After that, the numbers declined and settled at around 250,000 from 2015 through 2019. In tandem with the drastic fall in immigration during the pandemic years, deportations fell sharply, and they have remained at similar levels since then. In 2023, for example, around 150,000 deportations took place despite the sharp increases in regular and irregular immigration.
12. Deportations
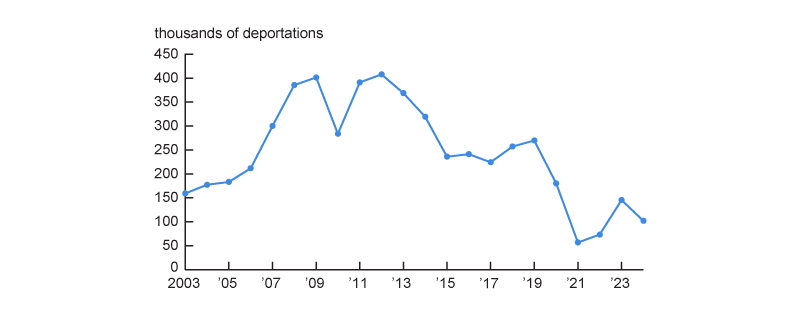
Sources: Transactional Records Access Clearinghouse (TRAC).
Recent immigration policy developments
We conclude this immigration primer by discussing some important policy changes in the second half of 2024 and the first quarter of 2025. This is a rapidly evolving policy area.
Federal order from June 2024
In June 2024, the federal government issued an order to “suspend and limit entry.”22 In practice, this order did the following:
- During periods of “high encounters,”23 individuals apprehended crossing the U.S. border between ports of entry would not be given NTAs except under exceptional circumstances and would be put under expedited removal.
- These individuals would no longer be eligible to apply for asylum except under exceptional circumstances.
- The federal order made it clear that these restrictions did not apply to individuals who applied through the CBP One app for an appointment at a port of entry.
- As of January 2025, the scheduling functionality of the CBP One app was removed and all appointments were cancelled.24
Parole for Cubans, Venezuelans, Nicaraguans, and Haitians
Citizens of Cuba, Venezuela, Nicaragua, and Haiti who were not present in the United States were allowed to apply for humanitarian parole. If granted, this status would last up to two years. With CBP One, citizens from these countries were able to apply to obtain parole from abroad and thus could make their way to the United States and enter with parolee status. This policy is no longer in place.25
Temporary Protected Status (TPS) for Venezuelans
DHS can designate citizens of a foreign country already in the United States (with or without a legal status) as beneficiaries of Temporary Protected Status when certain extraordinary conditions make their return unsafe or impossible. Under TPS, these foreign nationals can apply for work permits and are no longer removable. In October 2023, the federal government designated Venezuelan nationals present in the country by July 31, 2023, for TPS. DHS’s best estimates suggested this should cover around 470,000 people previously without TPS. The directive granted TPS status through 2025. However, in April 2025, the federal government repealed TPS for Venezuelan nationals under the October 2023 TPS designation.26
Spouses of citizens
In June 2024 the federal government extended “parole in place” to unlawfully present spouses and stepchildren of U.S. citizens. To qualify for this benefit, these individuals had to have been in the United States for at least ten years. This action was expected to cover 500,000 spouses and 50,000 stepchildren, but a district court in November 2024 issued a ruling vacating the program. The parole in place status would have allowed these individuals to be protected from deportation and to apply for a work permit; in 2024, the federal government estimated that over 80% of the potential beneficiaries were already in the labor force.27
Speculation about future developments
When monthly payroll job gains decline, a critical question is whether this is because labor market conditions are deteriorating or because there are fewer numbers of new people entering the labor market as a result of slowing population growth. Indeed, the size of the post-pandemic immigrant inflow we have described in this article contributed to population growth in the United States and expanded the labor force. It also increased the number of jobs created each month. Most forecasters raised their estimates of the break-even level of monthly payroll jobs expected as the labor market absorbed the new entrants.
Projections about the near-future behavior of the different migration inflow and outflow margins, along with their implications for the labor supply, are subject to huge uncertainties for at least three reasons: 1) Some of the components of the immigration flows are at the present time far from the steady state, making their recent numbers uninformative about future trends; 2) immigration policy is subject to considerable executive discretion; and 3) the literature studying the population impacts of historical legal changes is inconclusive. Our previous discussion, however, highlights several considerations that may be relevant from now on to understand how the inflow of new immigrants into the United Sates can shape labor supply and the labor market more broadly.
Substitution from “asylum seekers at ports of entry” to “unlawful crossings”
Research suggests that tightening restrictions at ports of entry increases unlawful crossings (see Amuedo-Dorantes and Bucheli, 2023; and Clemens, 2024). Thus, we may expect unlawful crossings to eventually increase in response to the end of the CBP One appointments. A critical question is whether the worldwide flow of people to the U.S. southern border dramatically decreases in response to this change. The latest reports suggest that flows of people arriving at the U.S. southern border have decreased considerably (see, for example, Aleaziz, 2025). However, it is unclear whether individuals from the Middle East or South Asia who flew to South America, crossed the Darién Gap, and trekked Central America and Mexico to the U.S. border may be deterred from attempting to cross unlawfully now that port-of-entry crossings are significantly more restricted.28 Because the CBP One app is now discontinued, however, grants for asylum with parole and NTAs are likely to fall dramatically, so most of the near-future irregular inflows are likely to consist of unlawful crossings (got-aways, never encountered). By their very nature, these inflows are the hardest to measure.
Overstays
The number of regular and irregular immigrants each year is dwarfed by the number of tourists and short-term business travelers to the United States (e.g., there were 37 million B-2 visas for tourists and almost 4.9 million B-1 visas for short-term business travelers in 202329). Thus, small changes in the overstay rate can have large implications for the number of new entrants who stay and eventually join the labor force. The changing global environment may alter the demand for travel to the United States and, hence, the number of overstays. Furthermore, a recomposition of the types of travelers, in part due to federal policy tightening the conditions for granting nonimmigrant visas, may reduce the number of travelers with a higher risk of overstaying.
Deportations and immigration enforcement
The direct removal of immigrants to the United States has the potential to decrease the size of the labor force directly and indirectly, by removing people or by reducing labor supply if people are worried about risks of interior enforcement associated with workplaces. East et al. (2023), for example, find that the increased interior immigration enforcement under the Secure Communities program (a DHS initiative) depressed the employment-to-population ratio. The federal government’s capacity to undertake large-scale deportation operations is uncertain; however, at its peak (fiscal year 2012), the U.S. government deported almost 408,000 people (see figure 12). Similar deportation numbers in the years ahead would make a significant dent in the growth of the labor force.
The ease with which individuals can put forward an asylum claim at the border is subject to change as a matter of policy. For example, the criteria to establish credible fear is subject to executive discretion, and the issuance of the Remain in Mexico policy suggests that similar actions are possible in the future. Indeed, the significant policy changes since January 2025 have already reduced sharply the number of individuals seeking asylum at ports of entry. It is worth pointing out that a large fraction of individuals currently under parole have court dates scheduled for several years ahead. A tightening of the asylum-granting criteria may result in the deportation of many of these individuals currently present in the United States. However, the impacts of such a policy change may only take place with some lags.
Regular immigration and emigration
Immigrant visas and refugee admissions outside the Covid years have been stable over time. These two types of immigration account for around 600,000 people per year (see figures 1 and 3). The majority of these are immigrant visas, the bulk of which consist of family immigration categories. Yearly caps for refugee admissions are subject to presidential discretion. Congress determines immigrant visa categories and the number of visas within each preference category. These could change over time depending on a variety of policy or behavioral factors.30
Emigration takes place when people leave the United States on a permanent basis. Emigration is difficult to estimate (Jensen, 2013), but several factors are likely to influence it. Macroeconomic conditions in the United States, as well as in home countries, and the conditions facing immigrants in the United States are factors that affect emigration rates.
We thank Katherine Jolley, Ryan Perry, and Aryan Safi for excellent research assistance. We thank Dan Sullivan, Spencer Krane, and Marcelo Veracierto for helpful comments.
Notes
1 More information from the State Department on visa categories is available online.
2 See the State Department’s visa resources webpage. There is the Visa Waiver Program for business and tourism: People who enter the United States with this visa waiver must stay for 90 days or less; they must have a valid passport from a country eligible for the Visa Waiver Program; and they must have applied through the Electronic System for Travel Authorization prior to travel.
3 E1 visas are immigrant visas for priority workers and persons of extraordinary ability.
4 IR1 and CR1 visas are immigrant visas for the spouses of U.S. citizens. IR1 is a type of immediate relative visa. CR1 is a conditional resident visa, which applies, for example, if someone has been married to a U.S. citizen for less than two years.
5 U.S. Department of Homeland Security, Office of Homeland Security Statistics (2025, table 1B).
6 U.S. Centers for Disease Control and Prevention, National Center for Immunization and Respiratory Diseases, Division of Viral Diseases (2023).
7 Information about what asylum officers do is available online. According to a November 2023 New York Times article, there were around 800 asylum officers in 2023 (Sullivan, 2023).
8 The CPB One app was a DHS program that began in October 2020 to facilitate the processing of cases at the U.S. southern border. In January 2023 the federal government expanded the app’s functionality. The program was terminated in January 2025. The app was used by aspiring immigrants to request appointments with DHS officers while waiting at the border. For more details on the CBP One app, see American Immigration Council (2025). Estimates suggest that CPB One was granting 1,450 appointments per day in 2023 and 2024 (see, for instance, U.S. Department of Homeland Security, U.S. Customs and Border Protection, 2023a).
9 Authors’ calculations based on asylum decisions data and the in absentia removal orders data from the U.S. Department of Justice, Executive Office for Immigration Review, Workload and Adjudication Statistics, available online.
10 See the column for in absentia removal orders for respondents released from custody in the data on in absentia removal orders from U.S. Department of Justice, Executive Office for Immigration Review, Workload and Adjudication Statistics, available online.
11 For instance, a 25% denial in absentia rate on the approximately 220,000 processed cases in 2023, as plotted in figure 4, would result in about 55,000 individuals staying in the United States unlawfully.
12 Nonwork visas preclude working. In fact, working while under such nonimmigrant visas is a cause for the visa to be invalidated, in which case the individual becomes unlawfully present. These cases are not included in the overstay counts.
13 Airlines and shipping lines are required to report to DHS the lists of their passengers traveling abroad.
14 The overstay rate varies dramatically across nationalities. In fiscal year 2022, for example, the overstay rate for most European nationals was around 0.6%, while it was above 25% for nationals from most African countries (U.S. Department of Homeland Security, U.S. Customs and Border Protection, 2023b).
15 The denominator of the overstay rate is typically around 40 million people, which is similar to the yearly number of temporary visitors to the United States. It is based on a subset of categories of nonimmigrant admissions that DHS refers to as “in scope” for the purpose of computing the overstay rate.
16 We exclude crew members of aircraft and ships (plus other modes of mass transportation) from this count because under the law such crew members are not considered admitted when they transit through the United States. We also exclude cases of individuals expelled under the Covid-19 pandemic emergency declaration because those fall under Title 42 of the U.S. Code (and we discuss them later in the article).
17 The numbers for inadmissible cases reported by DHS for 2022 and 2023 are 100,000 and 200,000 lower than the numbers we present in figure 9, which are based on data from the Transactional Records Access Clearinghouse (TRAC) at Syracuse University.
18 There are several other minor categories of inadmissibility, including withdrawals, expedited removals, and stowaways.
19 Straut-Eppsteiner (2025). This backlog of cases includes both immigration court cases for inadmissible individuals and for people arrested by the U.S. Border Patrol for crossing the U.S. border unlawfully.
20 Under the plenary rights doctrine, individuals within 100 miles of the U.S. border can be searched by CBP without probable cause.
21 See this video clip of former Secretary of Homeland Security Alejandro Mayorkas’s congressional testimony from the YouTube channel of U.S. Senator Doc Marshall from Kansas and this video clip of former U.S. Border Patrol Chief Raul Ortiz’s congressional testimony from the YouTube channel of the Committee on Homeland Security of the U.S. House of Representatives. The 90,000 never-encountered approximation is based on taking 15% of the 600,000 got-aways that Secretary Mayorkas noted in his testimony (15% being the midpoint of the estimated range between 10% and 20% of got-aways that Chief Ortiz stated are never encountered in his testimony).
22 U.S. Department of Homeland Security (2024c).
23 The high encounters status was activated after seven consecutive days with an average of 2,500 encounters or more; after being triggered, this status would only stop 14 days after seven consecutive days with an average of fewer than 1,500 encounters (and, as of late September 2024, after 28 consecutive days of a seven-consecutive-day average of fewer than 1,500 encounters). See U.S. Department of Homeland Security (2024c) and 2024 DHS web content on securing the border.
24 U.S. Department of Homeland Security, U.S. Customs and Border Protection (2025).
25 Quinn (2025) and U.S. Department of Homeland Security (2025).
26 U.S. Department of Homeland Security, U.S. Citizenship and Immigration Services (2025).
27 See López and Fullerton Rico (2024), Moriarty (2024), Timotija (2024), and U.S. Department of Homeland Security (2024a; in particular, see p. 67482, note 206).
28 Current estimates suggest more than 500,000 individuals crossed through the Darién Gap in 2023 (see, e.g., Roy, 2024). In July 2024, the U.S. government signed an agreement with the government of Panama to aid with removal flights from Panama (U.S. Department of Homeland Security, 2024b). More such negotiations are under way.
29 These are the numbers of temporary visitors for pleasure and for business who entered the United States under B-2 and B-1 visas in 2023, respectively (Rukh-Kamaa, 2024, table 1, p. 3).
30 For fiscal year 2025, the limit for family-sponsored preference immigrants is 226,000 (U.S. Department of State, Bureau of Consular Affairs, 2025). As noted early in this article, immediate family members of U.S. citizens do not face a yearly limit (9 FAM 503.1-3(A)).
Appendix
A1. Immigration data sources
| Data set | Source | Period examined | Frequency of update |
| Monthly Immigrant Visa Issuance Statistics | U.S. Department of State | March 2017–February 2025 | Monthly |
| Migration Policy Institute (MPI) analysis of Worldwide Refugee Admissions Processing System (WRAPS) data from the U.S. Department of State, Bureau of Population, Refugees, and Migration | Migration Policy Institute | Fiscal years 1980–2024 | Annual |
| Workload and Adjudication Statistics | U.S. Department of Justice, Executive Office for Immigration Review | Fiscal years 2015–24 | Annual |
| Nonimmigrant Visa Statistics | U.S. Department of State | Fiscal years 2013–24 | Annual |
| Entry/Exit Overstay Reports | U.S. Department of Homeland Security | Fiscal years 2015–23 | Annual |
| Stopping “inadmissibles” at U.S. ports of entry | U.S. Customs and Border Protection, whose data are accessed via the FOIA and reported by TRAC | October 2011–February 2025 | Continuously updated |
| Nationwide encounters | TRAC and U.S. Customs and Border Protection | Fiscal years 2010–19 (TRAC), fiscal years 2020–25 (CBP) | Monthly |
| U.S. Border Patrol arrests | U.S. Customs and Border Protection, whose data are accessed via the FOIA and reported by TRAC | March 2020–May 2022 | Not applicable (Covid-19 public health emergency under Title 42 ended on May 11, 2023) |
| Immigration and Customs Enforcement (ICE) removals | Immigration and Customs Enforcement, whose data are accessed via the FOIA and reported by TRAC | October 2002–February 2024 | Periodically updated |
References
Aleaziz, Hamed, 2025, “Illegal border crossings plunge to lowest level in decades,” New York Times, July 2, available online.
American Immigration Council, 2025, “CBP One: An overview,” fact sheet, Washington, DC, March 24, available online.
American Immigration Council, 2024, “The ‘Migrant Protection Protocols’: an explanation of the Remain in Mexico program,” fact sheet, Washington, DC, February 1, available online.
Amuedo-Dorantes, Catalina, and José R. Bucheli, 2023, “Implications of restrictive asylum policies: evidence from metering along the U.S.-Mexico Border,” Journal of Population Economics, Vol. 36, No. 3, pp. 1941–1962. Crossref
Clemens, Michael A., 2024, “The effect of lawful crossing on unlawful crossing at the US southwest border,” Peterson Institute for International Economics, working paper, No. 24-10, April, available online.
East, Chloe N., Annie L. Hines, Philip Luck, Hani Mansour, and Andrea Velásquez, 2023, “The labor market effects of immigration enforcement,” Journal of Labor Economics, Vol. 41, No. 4, October, pp. 957–996. Crossref
Edelberg, Wendy, and Tara Watson, 2024, “New immigration estimates help make sense of the pace of employment,” Brookings Institution, Hamilton Project, report, March, available online.
Gross, Mark, Jacqueline Lamas, Yeris H. Mayol-Garcia, and Eric Jensen, 2024, “Census Bureau improves methodology to better estimate increase in net international migration,” Random Samplings, U.S. Census Bureau, blog, December 19, available online.
Immigrant Legal Resource Center attorneys, 2020, “The Notice to Appear (NTA),” Immigrant Legal Resource Center, practice advisory, July, available online.
Jensen, Eric B., 2013, “A review of methods for estimating emigration,” U.S. Census Bureau, Population Division, working paper, No. 101, September, available online.
López, Jane Lilly, and Kristina Fullerton Rico, 2024, “How Biden’s executive order to protect immigrant spouses of citizens from deportation will benefit their families and communities,” The Conversation U.S., June 18, available online.
Moriarty, Andrew, 2024, “Keeping American families together: Parole in place for undocumented spouses of U.S. citizens,” FWD.us, November 7, available online.
Quinn, Melissa, 2025, “Supreme Court will let Trump administration end program protecting 500K Cubans, Nicaraguans, Haitians and Venezuelans,” CBS News, updated May 30, available online.
Roy, Diana, 2024, “Crossing the Darién Gap: Migrants risk death on the journey to the U.S.,” Council on Foreign Relations, report, July 22, available online.
Rukh-Kamaa, Aneer, 2024, “U.S. nonimmigrant admissions: 2023,” U.S. Department of Homeland Security, Office of Homeland Security Statistics, report, August, available online.
Straut-Eppsteiner, Holly, 2025, “FY2024 EOIR immigration court data: Caseloads and the pending cases backlog,” CRS Insight, Congressional Research Service, No. IN12492, January 24, available online.
Sullivan, Eileen, 2023, “Asylum in America, by the numbers,” New York Times, November 21, available online by subscription.
Timotija, Filip, 2024, “Judge strikes down Biden administration policy on immigrant spouses,” Hill, November 8, available online.
U.S. Centers for Disease Control and Prevention, National Center for Immunization and Respiratory Diseases, Division of Viral Diseases, 2023, “End of the federal COVID-19 public health emergency (PHE) declaration,” Atlanta, updated September 12, available online.
U.S. Department of Homeland Security, 2025, “Termination of parole processes for Cubans, Haitians, Nicaraguans, and Venezuelans,” Federal Register, Vol. 90, No. 56, March 25, pp. 13611–13622, available online.
U.S. Department of Homeland Security, 2024a, “Implementation of Keeping Families Together,” Federal Register, Vol. 89, No. 161, August 20, pp. 67459–67490, available online.
U.S. Department of Homeland Security, 2024b, “United States signs arrangement with Panama to implement removal flight program,” press release, Washington, DC, July 1, available online.
U.S. Department of Homeland Security, 2024c, “Fact sheet: Presidential proclamation to suspend and limit entry and joint DHS–DOJ interim final rule to restrict asylum during high encounters at the southern border,” Washington, DC, June 4, available online.
U.S. Department of Homeland Security, 2022, “DHS statement on U.S. District Court’s decision regarding MPP,” press release, Washington, DC, August 8, available online.
U.S. Department of Homeland Security, Office of Homeland Security Statistics, 2025, Legal Immigration and Adjustment of Status Report: Fiscal Year 2024, Quarter 4, Washington, DC, June 24, available online.
U.S. Department of Homeland Security, U.S. Citizenship and Immigration Services, 2025, “Termination of the October 3, 2023 designation of Venezuela for Temporary Protected Status,” Federal Register, Vol. 90, No. 23, February 5, pp. 9040–9044, available online.
U.S. Department of Homeland Security, U.S. Customs and Border Protection, 2025, “CBP removes scheduling functionality in CBP One App,” press release, Washington, DC, January 21, available online.
U.S. Department of Homeland Security, U.S. Customs and Border Protection, 2023a, “CBP One appointments increased to 1,450 per day,” press release, Washington, DC, June 30, available online.
U.S. Department of Homeland Security, U.S. Customs and Border Protection, 2023b, Fiscal Year 2022 Entry/Exit Overstay Report, Washington, DC, June 21, available online.
U.S. Department of State, Bureau of Consular Affairs, 2025, Visa Bulletin, Vol. 11, No. 1, Washington, DC, April, available online.
Ward, Alicia, 2024, “U.S. lawful permanent residents: 2023,” U.S. Department of Homeland Security, Office of Homeland Security Statistics, report, September, available online.


