In recent decades with the growth in inequality, Americans have become increasingly concerned about the degree of equality of opportunity in American society. Does every child growing up in the United States have the same chances for economic success or do parents’ economic circumstances largely dictate a child’s future economic status? An important way that researchers have approached this question is by studying intergenerational economic mobility. These studies typically measure the degree of the association of parents’ income to their children’s income in the next generation. When the association is very high, intergenerational income mobility is said to be low. Similarly, if the intergenerational association in income is low, mobility is thought to be relatively high.
This brief summarizes some of the key findings from the research on intergenerational income mobility in the U.S. in recent decades. I start by showing how the consensus view on the degree of intergenerational mobility has changed as researchers have used increasingly better data and methods. These newer studies suggest that intergenerational mobility is lower than we used to think, and that the U.S. has one of the lower rates of mobility among advanced economies. I then describe the research highlighting the sharp racial gap in intergenerational mobility. A key finding is that Black families experience much lower rates of upward mobility from the bottom of the income distribution, and much higher rates of downward mobility from the top of the income distribution, than similarly situated White families. Research has also highlighted the wide disparities in mobility based on where children in America grow up. Some new research has also highlighted that intergenerational mobility appears to have taken a turn for the worse right around 1980, when there was a sharp increase in various measures of cross-sectional inequality measured at a point in time.
The new view of mobility in the U.S.
Most of the early studies on intergenerational income mobility across several countries, including the U.S., found a relatively low degree of association between the income (log income in research terms) of parents and children. These studies typically found an intergenerational association of around 0.2., which suggests that only 20% of the income gaps between any two families would be expected to remain a generation later. Based on this evidence, in a 1986 paper Becker and Tomes summarized the evidence from these studies as follows: “Almost all earnings advantages or disadvantages of ancestors are wiped out in three generations.” (Becker and Tomes, 1986)
Many of these early studies, however, relied on using just a single year of earnings to try to capture the economic status of parents and children, and some studies did not use fully representative samples. Starting in the 1990s, nationally representative longitudinal data, such as the Panel Study of Income Dynamics that tracked the income of parents and children over longer periods, could be applied to this question. Solon (1992) used the PSID and showed how using more representative samples and longer time averages of parents’ income of up to five years could better address measurement error. Solon found that the intergenerational association was 0.4 or higher, or more than double what previous studies had found, implying that income differences among families would take much longer to dissipate than had been thought. In a 2005 paper, I used Census survey data matched to administrative Social Security earnings data and found that using even longer time averages of parents’ income of up to 16 years led to an intergenerational coefficient of 0.6, or 50% higher than Solon had found (Mazumder, 2005).1 In that paper I also highlighted the implications of that higher degree of intergenerational persistence, suggesting that for a family living in poverty it might take five generations before their descendants (on average) would be close to the national average of income. So the new evidence suggested that, rather than being a country with relatively high mobility, the U.S. was actually a relatively rigid society in which income gaps were likely to persist for many generations.
The Great Gatsby curve
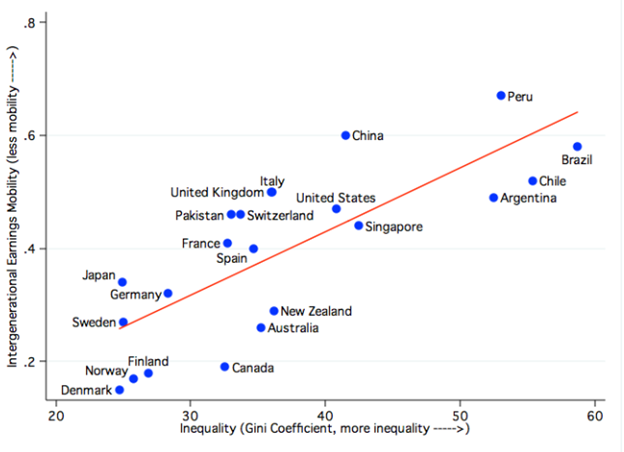
One notable pattern that has emerged from various studies of intergenerational mobility around the world is that there appears to be a strong positive correlation between the degree of intergenerational persistence in income and the level of inequality in a country. In other words, countries with high inequality also tend to have lower rates of intergenerational mobility. This relationship was noted by Corak (2006)2 and was dubbed the “Great Gatsby Curve” by Krueger (2012). While this relationship is not necessarily causal, it has motivated a great deal of both theoretical and empirical research into the underlying factors that lead to this strong association (e.g., Durlauf, Kourtellos and Tan, 2022).
Figure 1, which is taken from Corak (2013), also shows that the U.S. has a relatively low rate of intergenerational mobility. For example, all of the Nordic countries, as well as Germany, France, Spain, Japan, Canada, Australia, and New Zealand have higher rates of intergenerational mobility than the U.S. Therefore, in addition to better evidence from the U.S. suggesting that intergenerational persistence is much higher than we thought several decades ago, accumulating evidence from other countries also suggests that the U.S. economy is relatively immobile, particularly when compared with other advanced economies.
1. The Great Gatsby curve

Racial gaps in intergenerational mobility
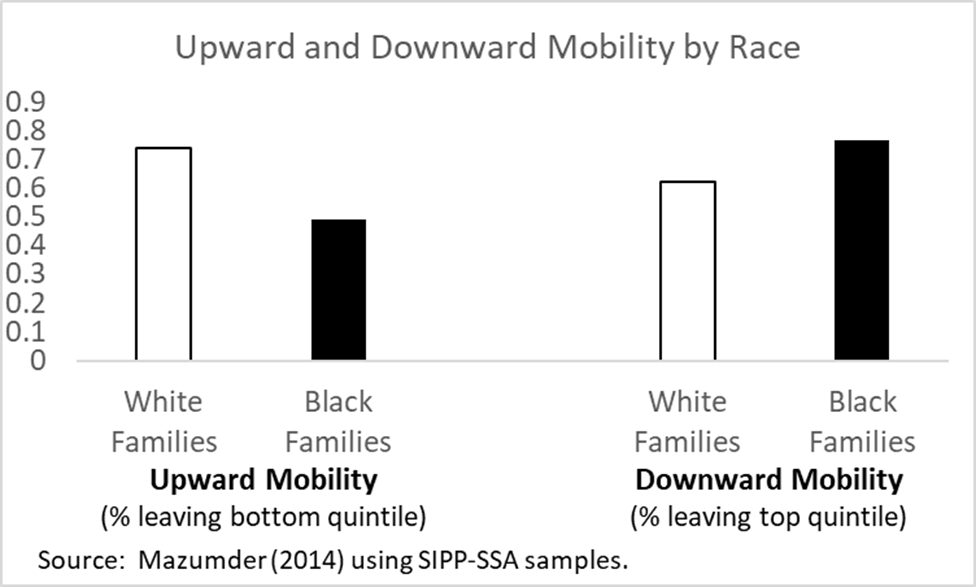
Of course, the evidence discussed so far has ignored potentially important differences in intergenerational mobility across subgroups of the population. Notably, given the legacy of slavery and discrimination against Black Americans in the United States, an important question is whether Black families are able to experience improvements over generations to the same degree as White families. An early study by Hertz (2005)3 using the PSID showed, for example, that 42% of Black children whose parents were in the bottom decile of the national income distribution remained in the bottom decile as adults, compared with just 17% of White children whose families were similarly placed on the income distribution. In Mazumder (2014), I expanded on this work by using larger and more nationally representative samples that also contained administrative earnings data. Figure 2, which is based on the results in that paper, shows that not only do Black families experience much lower rates of upward intergenerational mobility when they start near the bottom, but they also experience much higher rates of downward mobility when they start near the top. Thus, Black families are disadvantaged at both ends. If this kind of disadvantage in both upward and downward mobility were to continue for subsequent generations, then this would imply that there would be no closing of the racial income gap. Therefore, it is critical to think about policies that can alter these patterns, and there are important historical examples of interventions that have led to racial convergence in socioeconomic outcomes in the past.
2. Upward and Downward Mobility by Race

Geographic differences in intergenerational mobility
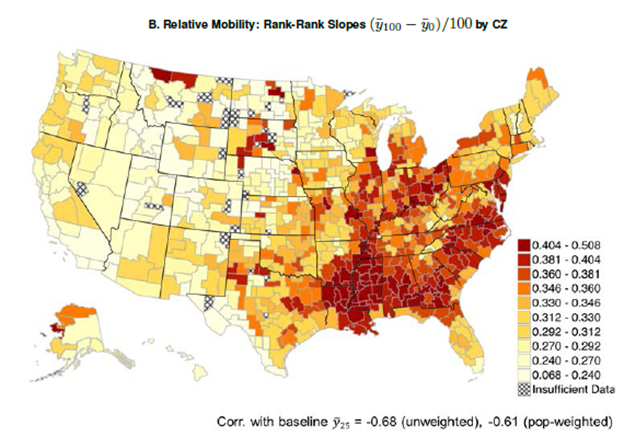
It also turns out that there are important differences in intergenerational mobility in the U.S. based on where children are raised. Chetty, Hendren, Kline, and Saez (2014) used population-wide administrative tax records to show that there is substantial variation in rates of intergenerational mobility across cities. For example, a child born in the early 1980s who grew up in poverty in Boulder, Colorado, could expect to end up far higher in the income distribution (around the 47th percentile) than a child who grew up in poverty in Cincinnati, Ohio, (38th percentile). Figure 3, taken from that paper, shows the large spatial variation in intergenerational mobility across the United States using a heat map where darker values correspond to lower mobility.
3. Intergenerational Mobility Varies by Place

The authors highlight several key factors that can explain the regional variation in mobility rates. They show that areas with high mobility have less residential segregation, lower income inequality, better primary schools, higher levels of social capital, and greater family stability.
Changes in mobility in recent decades
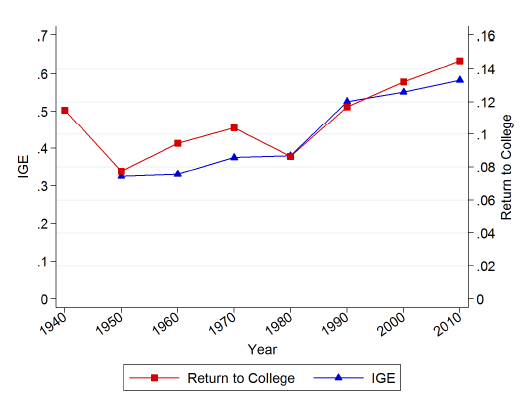
Given the strong inverse association between inequality and intergenerational mobility illustrated by the Great Gatsby curve and the fact that income inequality began to rise sharply in the U.S. around 1980 (e.g., Piketty and Saez, 2003), there is reason to expect that intergenerational mobility also began to fall after 1980. Several studies appear to show evidence consistent with this pattern, including several of my own studies (Levine and Mazumder, 2007; Aaronson and Mazumder, 2008, and Davis and Mazumder, 2022). In Aaronson and Mazumder (2008), my co-author and I show that the decline in intergenerational mobility appears to track the sharp increase in the returns to schooling that occurred around 1980. Figure 4 shows an updated version of the graph.
4. Trends in the Intergenerational Income Elasticity (IGE) and the Returns to Education

In more recent work, my co-author and I (Davis and Mazumder, 2022) show that changes in the return to education can explain 20% of the decline in intergenerational mobility in family income for older cohorts who entered the workforce before 1980, compared with more recent cohorts who entered the workforce after 1980. We also document that there was a four-fold increase in the gradient between the likelihood of being married and one’s parents’ income between these two cohort groups, and that this change can explain about 40% of the decline in intergenerational mobility in family income.
Summary
In recent decades, new research on intergenerational economic mobility has established an important set of new facts that should inform our thinking about opportunity and mobility in America. The U.S. has relatively low rates of intergenerational income mobility, especially when compared with other advanced economies, and mobility appears to have declined since 1980. There are also important differences in intergenerational mobility by race or ethnicity and location. In particular, Black families are disadvantaged relative to White families when it comes to both upward mobility from the bottom and downward mobility from the top.
1 Bhashkar Mazumder, 2005, “Fortunate sons: New estimates of intergenerational mobility in the United States using social security earnings data,” The Review of Economics and Statistics, Vol. 87, No. 2, pp. 235–255, by subscription, or download the earlier working paper version for free.
2 Miles Corak, 2006, “Do poor children become poor adults? Lessons for public policy from a cross country comparison of generational earnings mobility,” Research on Economic Inequality, Vol. 13, Dynamics of Inequality and Poverty, J. Creedy and G. Kalb, eds., Amsterdam: Elsevier, by subscription.
3 Tom Hertz, 2005, “Rags, riches, and race: The intergenerational economic mobility of black and white families in the United States,” in Unequal Chances: Family Background and Economic Success, Samuel Bowles, Herbert Gintis, and Melissa Osborne Groves (eds.), Princeton, NJ: Princeton University Press, available online with free login.


