

A heightened focus on wealth inequality emerged in the Covid-19 pandemic, due to disproportionate health and economic impacts on people of color. These adverse impacts exacerbated the existing wealth gap between Black and White households in particular. In a recent paper, co-authored with Darlene Booth-Bell and Taylor Griffin, we outline the existing racial wealth gap and illustrate longstanding disparities in several measures of financial success.1
Across the existing research on the racial wealth gap, such disparities prove to be both significant and persistent. This indicates the inequities are deeply entrenched: They preceded and outlasted the housing crisis, pandemic, and myriad economic booms and busts. The disparities also prove to be most significant between Black households and White households.
Using data from the 2019 Survey of Consumer Finances and the U.S. Census Bureau, among other sources, we present seven economic facts about the racial wealth gap in the United States.
Seven Economic Facts about the Racial Wealth Gap in the United States
1. Racial disparities in income are significant and persistent.
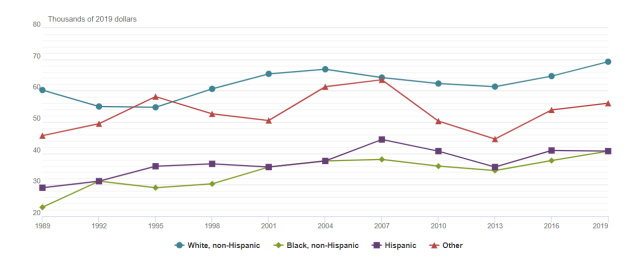
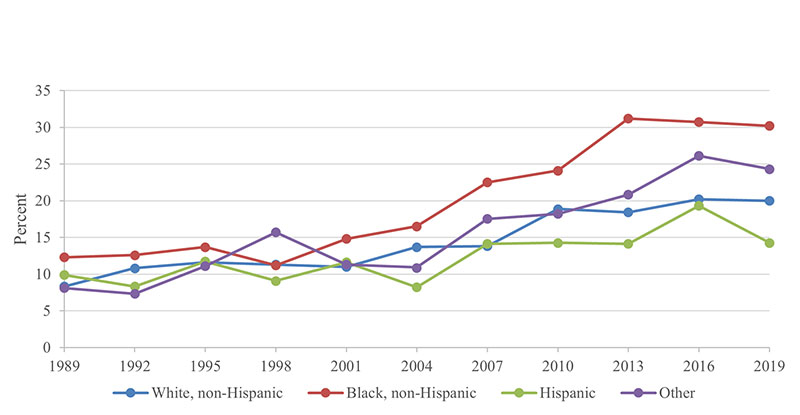
Data from the Survey of Consumer Finances reveal large and persistent disparities in income by race and ethnicity between 1989 and 2019, as shown in figure 1. During that time before-tax family income for White households averaged 28 percentage points higher than before-tax family income for Black households and 25 percentage points higher than before-tax family income for Hispanic households.
Figure 1. Median before-tax family income by race and ethnicity: 1989 to 2019
2. The average White household has significantly greater wealth than the average Hispanic or Black household.
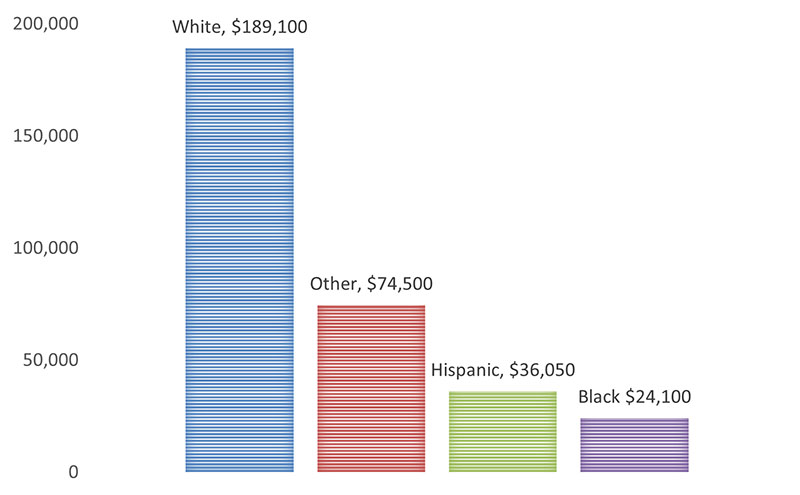
Data from the 2019 Survey of Consumer Finances show a significant wealth disparity between households by race and ethnicity, with the average White household having a median net worth of $189,100, 5.2 times greater the median net worth of the average Hispanic household ($36,050) and 7.8 times greater than the median net worth of the average Black household ($24,100).
Figure 2. Median net worth by race or ethnicity: 2019
3. Higher unemployment rates and lower household incomes for Black Americans reflect a history of structural barriers to economic mobility.
Data from the Bureau of Labor Statistics June 2022 Employment Situation Summary released on July 8 showed an increase of 372,000 jobs in June, and the unemployment rate remained at 3.6%. From April 2022 to June 2022, there were higher unemployment rates for Black and Latino or Hispanic Americans than for White and Asian Americans—consistent with historical trends.
Figure 2. Median net worth by race or ethnicity: 2019
| Race | April 2022 | May 2022 | June 2022 |
|---|---|---|---|
| U.S. | 3.6 | 3.6 | 3.6 |
| White | 3.2 | 3.2 | 3.3 |
| Black | 5.9 | 6.2 | 5.8 |
| Latino or Hispanic | 4.1 | 4.3 | 4.3 |
| Asian | 3.1 | 2.4 | 3.0 |
4. White Americans have higher rates of homeownership than Black and Hispanic Americans.
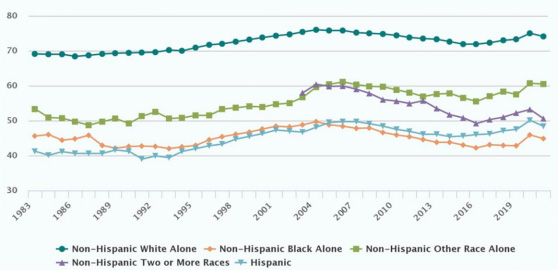
In the first quarter of 2022, the homeownership rate was 65.4% (U.S. Census Bureau, 2022). At 74%, the homeownership rate was highest for White Americans, followed by 59.4% for Asian Americans, 56% for Americans of two or more races/ethnicities, 49.1% for Hispanic Americans, and 44.7% for Black Americans.
Figure 3. Annual homeownership rate by race or ethnicity: 1983 to 2021
5. Black and Hispanic Americans have significantly less saved for retirement than their White and Asian American counterparts.
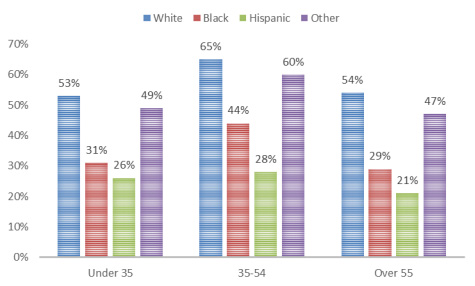
According to a 2019 report from the Center for Retirement Research at Boston College, the average household nearing retirement with a 401(k) had about $135,000 in 401(k)/IRA assets, while almost a third of all households approaching retirement had no retirement savings. Black and Hispanic Americans are less likely to own retirement accounts than their White counterparts.
Figure 4. Retirement account ownership by race and age: 2019
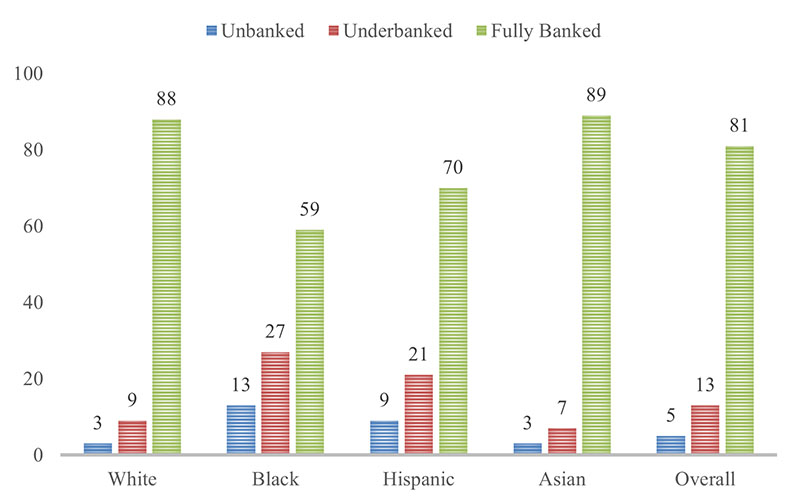
6. Black and Hispanic Americans are less likely to be fully banked and more likely to pay higher banking fees than White Americans.
According to the 2020 Federal Reserve Survey of Household Economics and Decisionmaking, the majority of adults in the United States, 81%, were “fully banked,” meaning that they had a bank account and in the previous 12 months, had not used any of the alternative financial services referenced in the survey. Unbanked rates are higher for Americans who have lower incomes, less education, are Black, Hispanic, American Indian or Alaska Native, are of working-age and have a disability, and experience income volatility (FDIC, 2019).
Figure 5. Banking status percentage by race or ethnicity: 2020
7. While White students are more likely to earn a baccalaureate degree, Black graduates shoulder a higher financial burden.
In 2019 White Americans were more likely to earn a baccalaureate degree, but Black Americans bore a higher financial burden for higher education. In 2019 the mean education installment loan amount for Black Americans was $44,880, compared with $40,170 for White Americans, and $30,890 for Hispanic Americans.
Figure 6. Mean eudcation installment loans by race or ethnicity
Summary
Across indicators and economic cycles, the extreme racial wealth gap continues to persist. The vast disparities in wealth between Black and White households are complex and interconnected, indicating any policy approach to address them should be, too.
To learn more, please download the full working paper.
1 We use the shorthand racial wealth gap to describe the disparities in wealth that affect households of color, which include people from many ethnic backgrounds.


