

Read our AgLetter Insights Q&A with author David Oppedahl for further insights into Seventh District farmland values and agricultural credit conditions described in this issue of AgLetter.
The latest issue of AgLetter features a new look, with updated figures that present farmland values and credit conditions somewhat differently than before. For farm-related data that appeared in the final table of the previous format, consult the set of hyperlinks on our agricultural sector webpage. For any further questions concerning AgLetter, email agconditions@chi.frb.org.
Farmland values
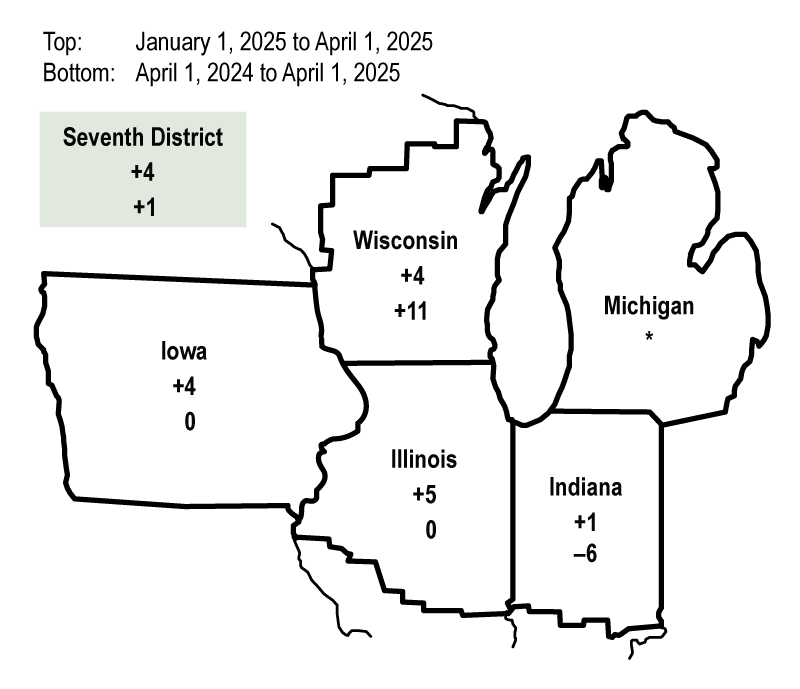
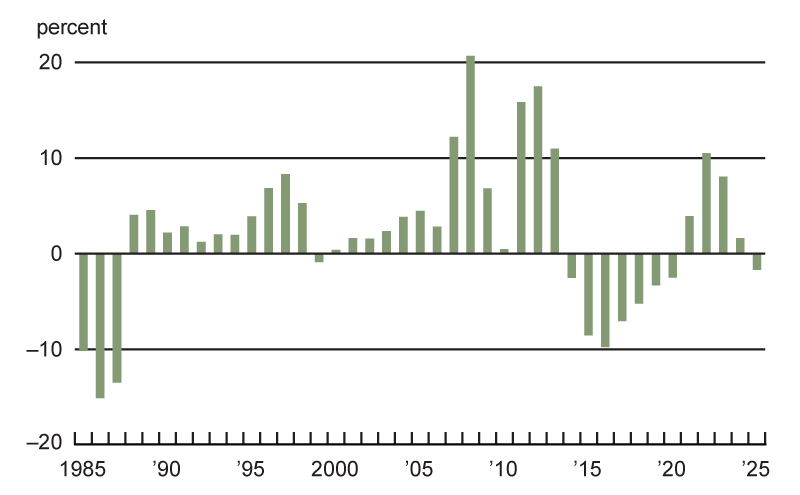
In the first quarter of 2025, the Seventh Federal Reserve District’s agricultural land values saw a 1% increase from a year ago, and “good” farmland values rose 4% from the fourth quarter of 2024, according to the survey respondents of 141 District agricultural banks (see figure 1). Demand to purchase farmland was lower in the three- to six-month period ending with March 2025 than in the same period ending with March 2024 (15% of the survey respondents reported higher demand to purchase farmland and 29% reported lower demand). Plus, the amount of farmland for sale was down during the winter and early spring of 2025 compared with a year earlier. Likewise, the number of farms and the amount of acreage sold were down in the winter and early spring of 2025 relative to a year ago. Annual cash rental rates for District farmland saw a decrease of 2% in 2025—their first decline since 2020 (see figure 2). For 2025, average annual cash rents for farmland were down 2% in Illinois and 3% in Iowa and up 1% in Indiana and 3% in Wisconsin (not enough survey responses were received from bankers in Michigan to report a numerical change for that state).
1. Percent change in dollar value of “good” farmland
2. Annual percentage change in Seventh District farmland cash rental rates
Credit conditions
District agricultural credit conditions weakened during the first quarter of 2025. Repayment rates for non-real-estate farm loans were much lower in the January through March period of 2025 compared with a year ago, and the renewals and extensions of these loans were higher (see figure 3). In the first quarter of 2025, demand for non-real-estate farm loans relative to a year ago was up for the sixth consecutive quarter, while the availability of funds for agricultural lending relative to a year earlier was down for the eighth consecutive quarter. The breakdown of the index readings for the first quarter of 2025 follows:
- At 143 (its highest value since the first quarter of 2016), the index of demand for non-real-estate farm loans indicated strong demand in the first quarter of 2025; for that quarter, 55% of the responding bankers noted higher loan demand compared with a year ago and 12% noted lower demand.
- The index of funds availability was 94; 9% of the survey respondents reported their banks had more funds available to lend in the first quarter of 2025 than a year earlier, while 15% reported their banks had less.
- At 61 (its lowest value since the first quarter of 2020), the index of repayment rates for non-real-estate farm loans was down from a year ago for the sixth consecutive quarter; 39% of responding bankers observed lower rates of repayment for the first quarter of 2025 relative to the first quarter of 2024, and no bankers observed higher rates.
- The index of loan renewals and extensions stood at 133 in the first quarter of 2025 (its highest value since the second quarter of 2020); 35% of the survey respondents reported higher levels of loan renewals and extensions over the January through March period of 2025 compared with the same period last year, while just 2% reported lower levels of them. Furthermore, bankers reported that, on average, 19% of their farm borrowers had more carryover debt (loans not paid off at the end of the growing season and subsequently carried over into the next one) in 2025 than in 2024.
At 76.9%, the average loan-to-deposit ratio in the first quarter of 2025 was up slightly from the previous quarter and was nearly 5 percentage points below the average level desired by survey respondents. The amount of collateral required by banks across the District was slightly higher than a year earlier. In line with weaker farm credit conditions, the share of loans guaranteed by the U.S. Department of Agriculture’s Farm Service Agency (FSA) in the portfolios of the reporting banks across the District was a bit higher than a year ago. By the end of the first quarter of 2025, the District’s average interest rates on farm operating, feeder cattle, and farm real estate loans had declined some and were last lower at the end of the fourth quarter of 2022.
3. Credit conditions at Seventh District agricultural banks
| Latest period | Prior period | Year ago | |
|---|---|---|---|
| 2025:Q1 | 2024:Q4 | 2024:Q1 | |
| Indexesa | |||
| Loan demand | 143 | 129 | 136 |
| Funds availability | 94 | 90 | 78 |
| Loan repayment rates | 61 | 64 | 78 |
| Loan renewals and extensions | 133 | 130 | 125 |
| Average loan-to-deposit ratiob | 76.9 | 76.7 | 76.1 |
| Interest rates on farm loansc | |||
| Operating loans | 7.73 | 7.78 | 8.44 |
| Feeder cattle loans | 7.76 | 7.88 | 8.45 |
| Real estate loans | 7.09 | 7.19 | 7.57 |
Looking forward
According to an Illinois banker, “working capital decreased dramatically in 2024 and probably will in 2025 as well.” With farms in need of more financial liquidity, survey respondents forecasted that the overall volume of non-real-estate farm loans would rise in the District during the April through June period of 2025 relative to the same period of 2024 (36% of the responding bankers expected a higher volume of such loans, while 16% expected a lower volume). In particular, operating, feeder cattle, and FSA-guaranteed loans were anticipated to have higher volumes relative to a year earlier. In contrast, survey respondents forecasted a decline in the District’s farm real estate loan volume in the second quarter of 2025 from a year earlier.
In the first quarter of 2025, 48% of survey respondents considered farmland to be overvalued, while only 1% considered it undervalued. Even so, over two-thirds of the responding bankers expected farmland values to be unchanged in the second quarter of 2025: Specifically, 69% of these bankers forecasted agricultural land values to be stable, 25% forecasted them to decrease, and just 6% forecasted them to increase.
Save the Date
The Federal Reserve Bank of Chicago will hold a hybrid conference about midwestern agricultural trade on September 30, 2025. Additional information about this event will become available online in the coming months.


