Financial Positions of U.S. Public Corporations: Part 1, Before the Pandemic
This blog is the first in a series that will discuss how the current pandemic affects the financial positions of publicly traded U.S. corporations, the potential implications of these financial developments, and the federal policy response. This first blog discusses the financial positions before the pandemic started. We document three facts: (1) the share of nonfinancial public companies with large amounts of leverage was elevated, suggesting financial fragility; however, (2) interest expenses were small for most firms due to the low level of interest rates; and (3) most firms had significant liquidity.
Why are we interested in the financial positions of U.S. public corporations?
The economic shutdowns necessitated by the Covid-19 pandemic are having a large impact on the financial position of many firms in the United States. Most importantly, they are dramatically reducing revenue and cash flow, albeit very unevenly across sectors. Even though the shutdowns are not expected to be long-lasting in most areas, these cash flow shocks have the potential to lead to widespread illiquidity or insolvency. This in turn would reduce the productive capacity of the economy due to the loss of human and intangible capital and slow down the recovery after the economy is able to reopen.
In this first blog, we discuss the financial situation of publicly traded U.S. corporations before the pandemic started.
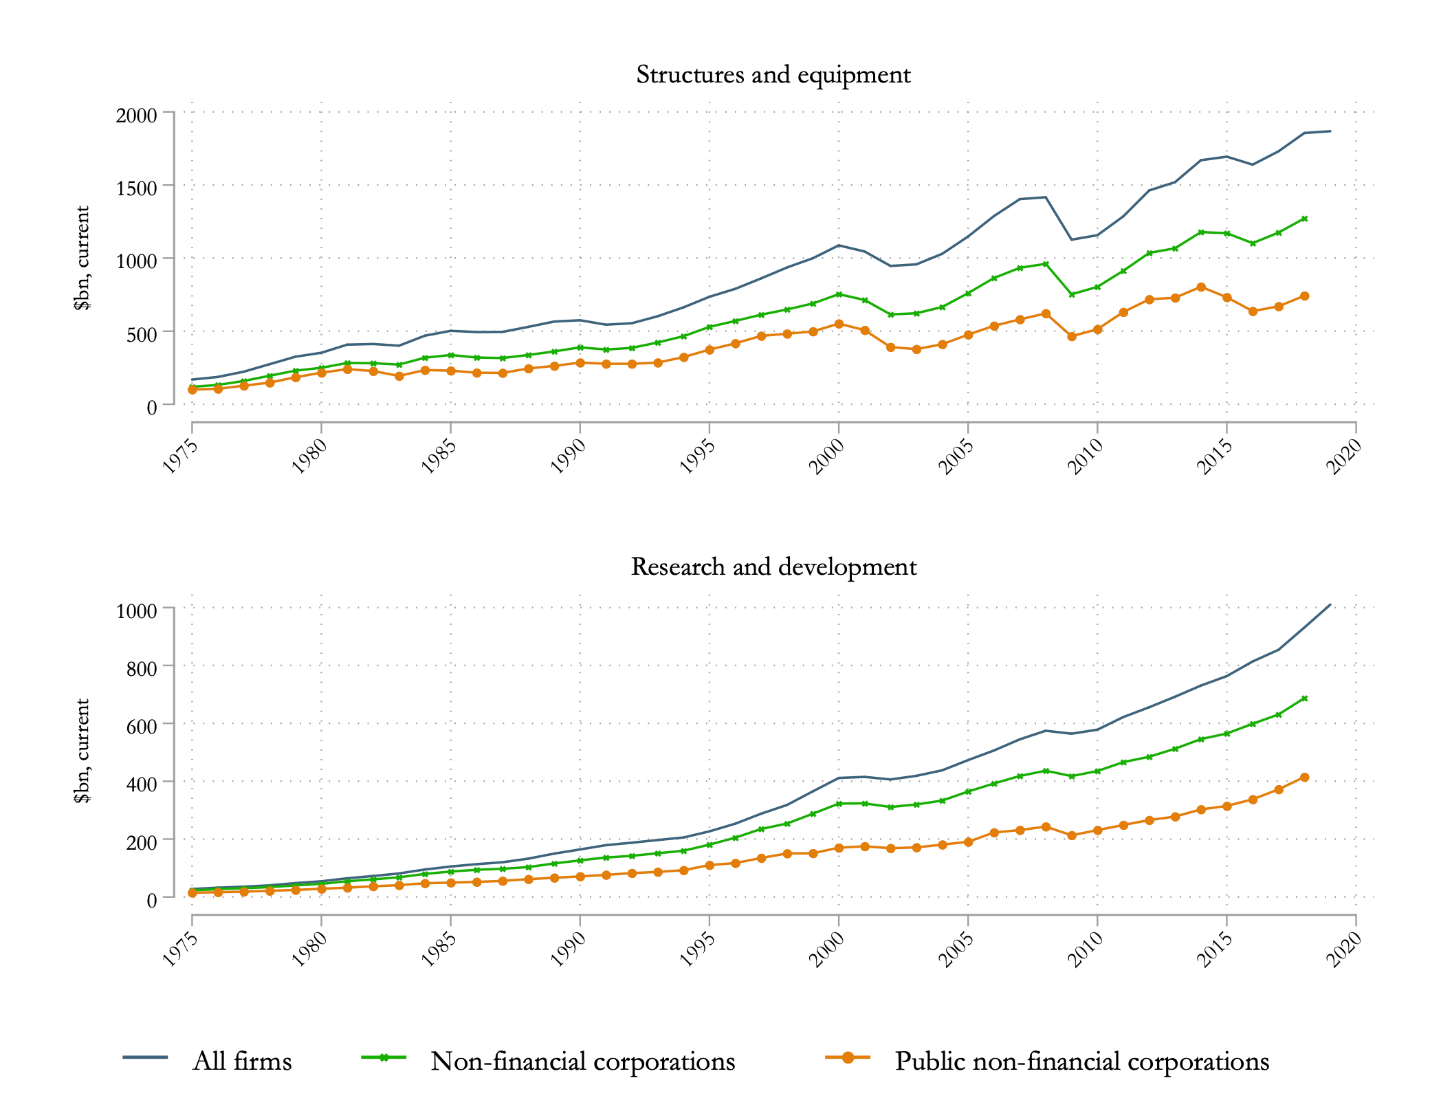
Throughout this series, we focus on public corporations because their financial reporting requirements make it possible for us to measure their financial positions and compare them to historical precedent. We also focus on nonfinancial corporations, i.e., we exclude banks and other financial institutions, whose business consists of borrowing and lending. Public nonfinancial corporations account for a significant share of U.S. economic activity, particularly business investment. In 2018, the latest year for which we have reliable and comparable data across firms, public nonfinancial corporations made up about 40% of all U.S. investment in tangible assets (structures and equipment) and about 44% of all R&D, as illustrated in figure 1.1
1. Contribution of public nonfinancial corporations to business investment
Financial positions pre-Covid 19: a high fraction of significantly levered firms…
While the U.S. economy entered 2020 on a strong footing, there have been concerns for some time about the financial fragility of the corporate sector. For instance, the Federal Reserve’s financial stability report from May of 2019 highlighted growing risky business debt. Rather than look at broad aggregates, such as the overall ratio of nonfinancial corporations’ debt to GDP, we prefer to study the cross-sectional distribution of firms and gauge how many firms might be in financial distress.
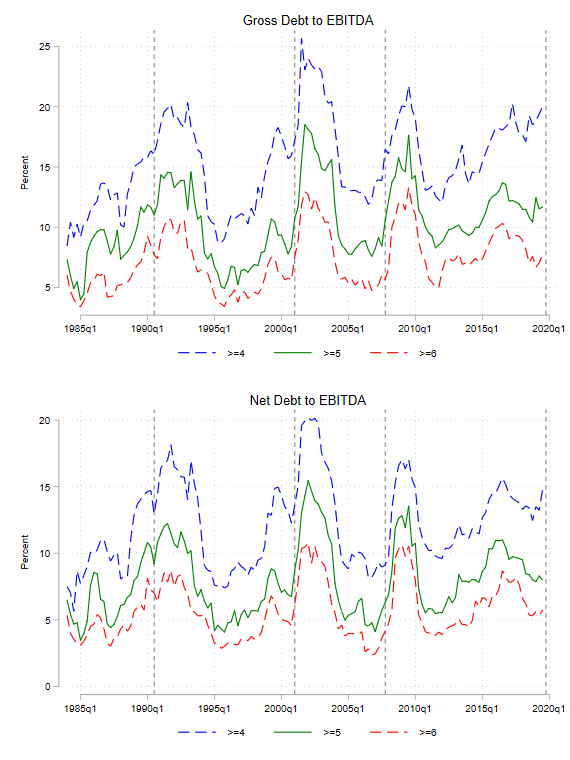
The top panel of figure 2 depicts the evolution of the distribution of a commonly used measure of leverage, the ratio of gross debt to earnings. (Earnings are measured as earnings before interest, taxes, debt and amortization (EBITDA), a standard measure of profitability.) The different lines show the fractions of firms (weighted according to their sales) with a ratio above 4, 5, and 6.2 Looking at the top (blue) line, we see that the fraction was elevated in 2019, with almost 20% of the sales of publicly traded firms in firms with a debt/EBITDA ratio above 4. The share of firms with very high leverage (i.e., debt to EBITDA over 5 or 6) was also high, but not as dramatically elevated.
The bottom panel of figure 2 displays the evolution of the distribution of net debt to earnings. Net debt is gross debt less cash and other short-term equivalents. Offsetting debt with cash arguably presents a more accurate measure of the firms’ financial commitments. Here too, we see that the leverage ratios were high, comparable to previous peaks.3
2. Evolution of (sales-weighted) share of U.S. nonfinancial public corporations with gross debt to EBITDA, or net debt to EBITDA above given thresholds
Relatedly, the share of outstanding bonds of nonfinancial public firms with an S&P rating of BBB or BBB– (the lower tier of the investment grade group) increased from 34% to 44% (on a par-weighted basis) between January 2015 and January 2019. Many of these companies may lose their investment grade rating due to the effects of the pandemic, becoming so-called fallen angels. Because many investors are not allowed to purchase bonds issued by non-investment-grade rated firms, this can potentially increase these companies’ funding costs significantly.
… but low interest expense and significant liquidity.
One important caveat to concerns about these high leverage levels is that the historically low cost of borrowing, combined with high profits, made this leverage easily sustainable for many firms. The top panel of figure 3 depicts the distribution of the interest coverage ratio, i.e., interest payments divided by (EBITDA) earnings. The share of companies that use more than 30%, 40%, or 50% of their earnings in interest payments has been declining for some time, and was quite low. Of course, a sudden decline in earnings may now reverse this trend.4
3. Evolution of (sales-weighted) share of U.S. nonfinancial public corporations with interest coverage (interest/earnings) and cash-asset ratios above given thresholds
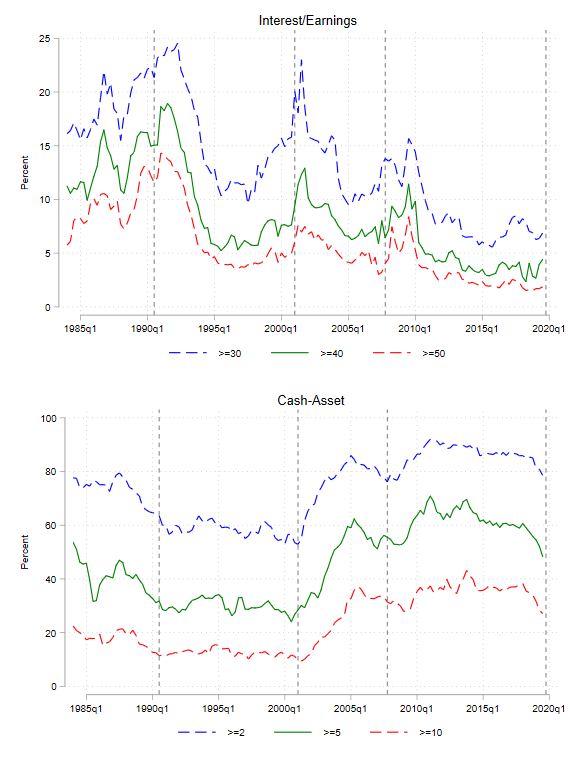
Firms were also holding relatively large cash buffers. The bottom panel of figure 3 depicts the evolution of the cash-to-asset ratio. (These data do not include lines of credit, which provide a further liquidity buffer.) The fraction of firms with a cash-to-asset ratio above 2% or 5% increased post 2000 and remained high from then on.5 Corporations entered this crisis with significant liquidity.
Conclusion
In this blog, we showed that many nonfinancial publicly traded companies entered 2020 with historically elevated levels of leverage. However, this fragility is somewhat tempered by their low level of interest expense and their high liquidity. Our next two posts will project the evolution of the financial positions of these companies.
Notes
1 Figure 1 also shows that public nonfinancial firms make up 58% of tangible investment and 60% of all R&D of nonfinancial corporations.
2 Firms with negative EBITDA are defined to be above any threshold.
3 We obtain similar results if we use other measures of leverage, such as gross or net book leverage (i.e., debt or net debt, divided by assets rather than earnings) or gross or net market leverage (i.e., dividing by the market value of the firm (proxied as market value of equity plus book value of other liabilities) rather than the book value.
4 A rise in the interest rate could also reverse this trend, but it is less likely since most corporations’ interest rates are either fixed, or floating and tied to short-term rates (LIBOR) which have, on net, fallen since February.
5 The decline toward the end of the sample may have been driven by the recent corporate tax reform (TCJA) that repatriated all cash held abroad, allowing it to be distributed to shareholders.


