Financial Positions of U.S. Public Corporations: Part 2, The Covid-19 Earnings Shock
This blog is the second in a series that discusses how the current pandemic affects the financial positions of publicly traded U.S. corporations, the potential implications of these financial developments, and the federal policy response. The first blog discussed the financial positions before the pandemic started. It documented that many nonfinancial publicly traded companies entered 2020 with historically elevated levels of leverage. This second blog explains how we use stock returns to project the potential earnings losses due to Covid-19; this will be used in our next blog to project the evolution of firms’ financial positions.
The Covid-19 earnings shock
The health emergency and the ensuing shutdowns have led to a sharp drop in sales for many firms. Because firms’ costs are in part fixed or prepaid, cash flow from operations suddenly turned negative. We are interested in estimating these “Covid-19 cash flows shocks” to understand how firms’ financial positions would evolve—and in particular, how many of them might end up in financial distress.
The challenge in estimating these cash flow shocks is that much is unknown about the severity of the shock, its duration, and how it will affect each business. Corporations are only starting to understand the effects of the pandemic on their ability to operate and be profitable. Indeed, many corporations have chosen not to provide estimates of their earnings this year due to the level of uncertainty.
We circumvent this problem by using the stock price reaction to gauge the effect of the pandemic on future cash flows. The underlying logic is that, in general, lower stock prices reflect lower expected cash flows. Moreover, stock prices can aggregate the opinions of many investors and hence provide a reasonable benchmark for future earnings, even if each investor is highly uncertain—the so-called wisdom of crowds.1
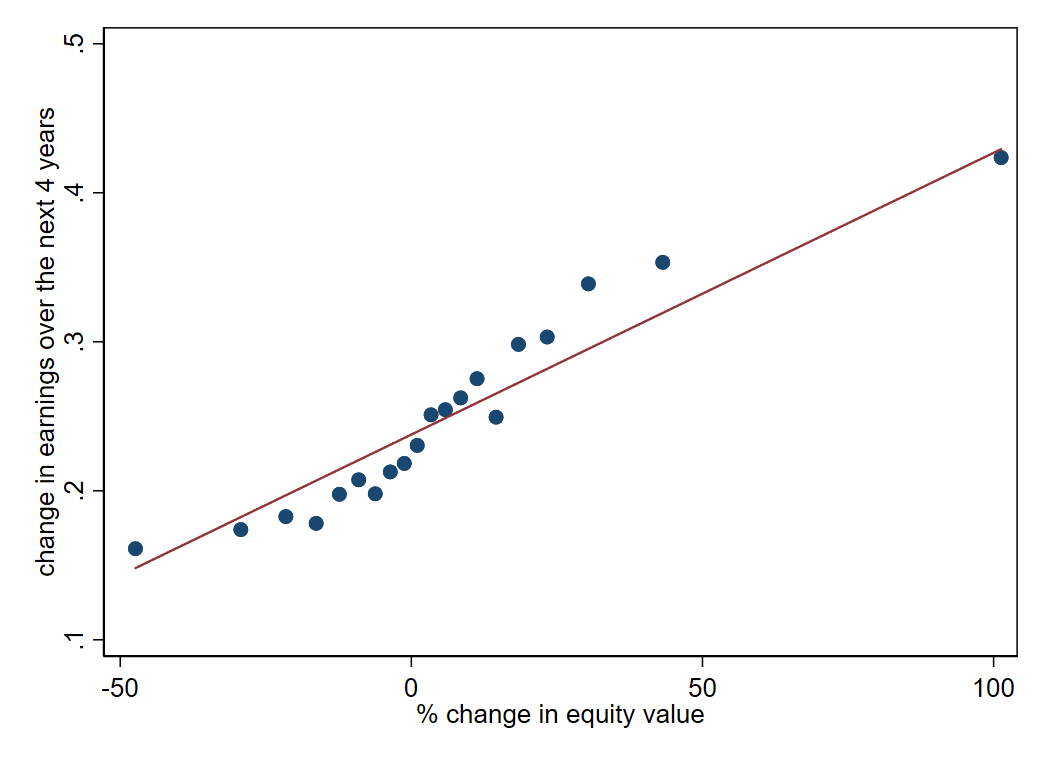
Concretely, we calculate for each firm the change in equity value between February 20 and March 13—the period during which it became clear that the U.S. economy would be directly affected by the pandemic. We then use a statistical model that infers the likely change in future earnings, using the historical relationship between stock returns and future earnings. Figure 1 illustrates this historical relationship using data from 1995 through 2019 for all public firms.2 (This graph shows only 20 points for clarity, but is based on thousands of firms during this 25-year period.)
One peculiarity of the current shock is that it is likely to have dramatic effects in the very short term, but these effects might then reverse fairly quickly, rather than being more persistent over time as would be typical for a macroeconomic shock. To take the potentially transitory nature of the shock into account, we mechanically adjusted the earnings path implied by our statistical model to redistribute 75% of the impact due to happen over the next eight quarters to only two quarters: 2020:Q2 and 2020:Q3.
1. Historical relation between change in equity value in a quarter and cumulated growth rate of earnings over next four years
There are a number of caveats to our approach, which is of course a rough approximation at best. First, it is not always true that stock returns predict future earnings. Indeed, for the entire U.S. stock market (the index), this relationship is notoriously weak.3 However, this relationship is much stronger at the individual company level.4 Second, our adjustment for the transitory nature of the shock is judgmental. Third, it is possible that the stock return reaction reflects not just the raw earnings but the expectation of specific liquidity or solvency problems. And finally, a firm’s stock return might be affected by a change in the discount rate used by investors to value its future cash flows, perhaps owing to a change in its perceived riskiness.
Were more fragile firms hit more by the Covid-19 shock?
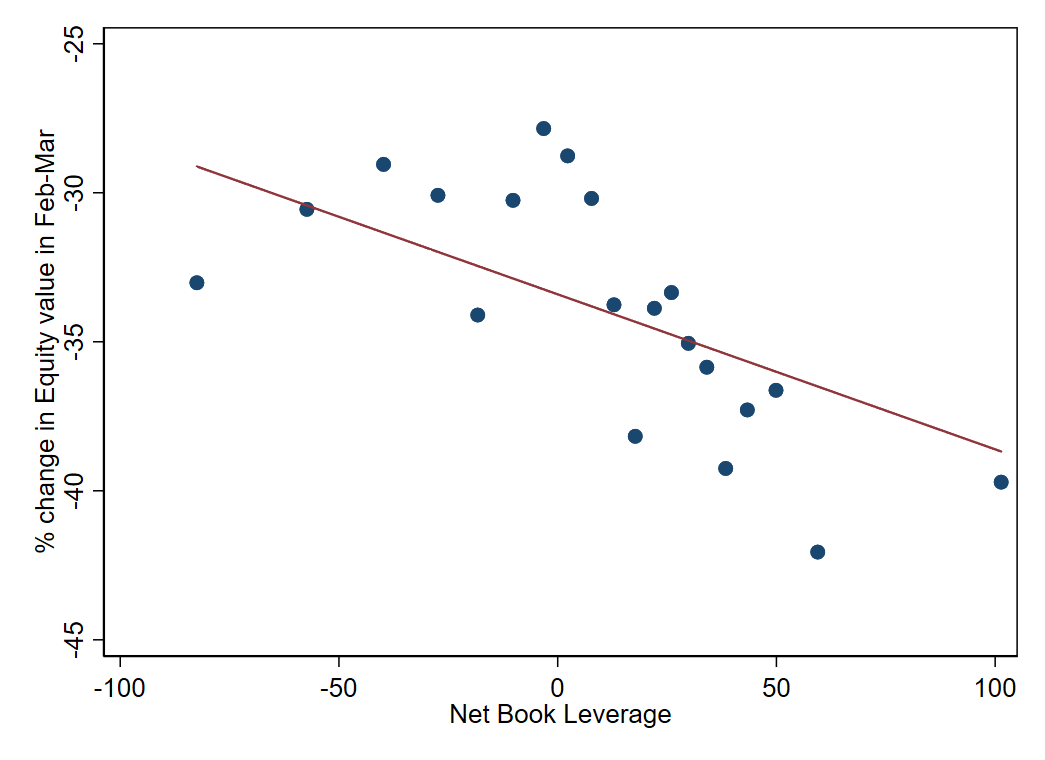
In our previous blog, we noted that many firms were already highly indebted before the pandemic. Were these firms hit especially hard by Covid-19? At first, it seems that the exceptional, unanticipated nature of the shock makes it unlikely: While the virus hit certain sectors, or certain companies, disproportionately, there is no obvious reason to expect that these companies would have had more debt before the pandemic started. Figure 2, however, shows that, on average, companies that had initially more debt also had larger declines in their stock return during the February–March period that we study. (Here debt is measured as net book leverage, i.e., debt, net of cash and short-term equivalents, divided by the book value of assets.) In this sense, the Covid-19 shock seems to have hit the more fragile firms more severely.5 Of course, this means that these firms are now at an elevated risk of becoming financially distressed, since they are combining a weak initial position with a very negative shock.6 Our next blog post will study this issue, using the earnings projections generated using stock returns to project the future cash and debt position of each U.S. public firm.
2. Relation between companies’ net book leverage as of 2019:Q4 and change in equity value, February 20–March 13
Conclusion
In this blog, we explain how we use the change in individual stock prices between February 20 and March 13 combined with the historical relationship between stock market changes and earnings to project each firms’ future earnings. We will use this in our next post to project financial distress. As a side note, we find that firms that were more highly levered before the pandemic experienced a stronger decline in their stock prices.
Notes
1 For an amusing example of the ability of the stock market to reveal hidden information, see this article.
2 To handle negative earnings, our statistical model uses profitability (the return on assets, i.e., (EBITDA) earning over assets) rather than the growth rate of earnings, which is what is displayed in figure 1 for simplicity. Our model is a simple linear regression of future profitability on lagged profitability and the change in the firm’s equity value.
3 This is the point of Shiller’s Nobel-prize winning 1980 paper and the vast literature that follows it on “return predictability.”
4 See for instance one of these papers.
5 Similar results are obtained using the other financial measures we showed in our previous blog, such as debt to EBITDA, interest coverage, and cash to assets.
6 To be sure, it is possible that the low stock returns experienced by highly levered firms in part reflects this anticipated financial distress (or even the direct effect of financial leverage).


