Background Information for Exhibits in President Goolsbee’s Speech, “The 2023 Economy: Not Your Grandpa’s Monetary Policy Moment”
Background information for exhibits in Chicago Fed President Austan D. Goolsbee’s speech, delivered at the Peterson Institute for International Economics on September 28, 2023.
Since March 2022, the Federal Reserve has tightened policy substantially, increasing the federal funds rate by 525 basis points (bps), in an effort to diminish inflation by bringing demand in line with supply. In this post, I present some simple calculations to estimate the contribution of this monetary policy tightening to the evolution of gross domestic product (GDP), employment, and inflation. I first present and discuss the results, which are depicted in figure 1. Then, I discuss the methodology.
1. Estimated contribution of monetary policy
Sources: U.S. Bureau of Economic Analysis and U.S. Bureau of Labor Statistics data through Haver Analytics and author’s calculations.
Results
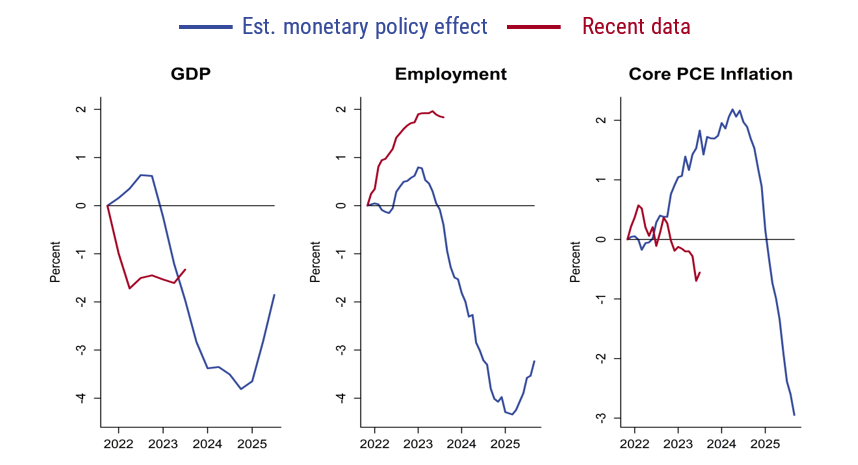
Each panel in the figure shows the estimated contribution of monetary policy in blue. These lines represent the cumulative effect of the interest rate policy actually followed, compared to a hypothetical world in which the Fed had kept the policy interest rate constant since the fourth quarter of 2021.
According to my estimates, the dramatic tightening of monetary policy had a relatively small effect on GDP until the beginning of 2023. At this point, the contribution of monetary policy becomes substantial, reaching about –3.5% by the end of 2023, before levelling out in 2024. The effect of the tightening starts to diminish in 2025. These estimates are consistent with the traditional view that monetary policy operates with long lags. According to my estimates, the lags are even slightly longer for employment. The leftmost panel shows the effect on year-over-year core PCE (personal consumption expenditures) inflation. Monetary policy eventually reduces inflation significantly—by about 3 percentage points—but these effects take a very long time to occur. 1
The figure also shows, in red, the evolution of the data since 2021:Q4. I report the change in GDP and employment since 2021:Q4, net of their 2014–19 average growth rates, and the change in inflation since 2021:Q4. While GDP has grown tepidly since the monetary policy tightening started, employment growth has remained strong, and inflation has started to fall. (The recent decline in inflation is starker if calculated on a month-over-month basis as opposed to year over year as displayed.) Clearly, we would not expect the data (red) to line up perfectly with the effect of monetary policy (blue), since the economy is buffeted by other factors, in particular the unusual aftermath of the Covid contraction. Still, the divergence of employment is remarkable, as is the absence of a significant slowdown in GDP growth this year. In that sense, the current experience is markedly different from previous monetary tightening cycles. Of course, a number of reasons have been advanced to explain why the economy might be less sensitive to monetary policy currently than in the past.2
Methodology
This calculation combines two inputs: first, an estimate of the dynamic effects of a surprise monetary policy tightening on the outcome variables (GDP, employment, and inflation), also known as an “impulse response function”; second, a measure of the monetary policy tightening. To estimate the impulse response function, I estimate linear regressions (“local projections”) of each outcome variable (in the future) on past lags of itself and measures of monetary policy surprises.3 I use the so-called Romer and Romer shocks, which are changes in the target fed funds rate that are not explained by revisions in the Federal Reserve’s Greenbook forecast or by the lagged target fed funds rate.4
The second step of the calculation is to infer the changes in monetary policy since 2021:Q4. I use the two-year real interest rate to measure the monetary policy stance. I use the estimated impulse response of this rate to Romer-Romer shocks, and recursively back out the shocks that generate the observed path of the two-year real interest rate since 2021:Q4. I then use the resulting shocks in the impulse response functions of the outcome variables to generate the estimated contributions of monetary policy (i.e., the blue lines in figure 1).5 This calculation assumes that all interest rate changes since 2021:Q4 have the same effect as the historical surprises—whether they are actual surprises or not.
I use a real interest rate because, in many models, the real interest rate, rather than the nominal rate, reflects the stance of monetary policy. I use a two-year rate to capture expectations about future monetary policy. For instance, during the current tightening episode, longer-dated interest rates rose ahead of the actual increases in the federal funds rate.
Of course, there are a number of assumptions underlying these calculations, such as the linearity of the effect of monetary policy. The estimates are also subject to large statistical uncertainty. But the general patterns are in line with a long research literature.
Notes
1 Indeed, the estimates suggest that monetary policy initially increases inflation. This counterintuitive feature (often deemed the “price puzzle”) is frequently found in empirical estimates of the effects of monetary policy.
2 To note just one potential explanation, balance sheets of households and businesses are healthier than is typical during a tightening cycle, in part because they “locked in” low interest rates in 2020–21.
3 Specifically, the equation is $y(t+h) = a(h) + b(h,0)RR(t) + b(h,1)RR(t–1)+…+ b(h,M)RR(t–M)+ c(h,1)y(t–1)+…+ c(h,L)y(t–L)+ d(h)x(t) + e(t+h)$, where y is the outcome variable, h the horizon, a an intercept, $b(h,0)$ the coefficient of interest (the IRF is the sequence $b(h,0))$, $RR$ is the Romer-Romer shock, x is a set of control variables, and e an error term. I run a monthly model for inflation and employment; in this model, I use M=24 and L=12 and include a quadratic time trend as control. In the quarterly model, used for GDP, I use M=L=16 and a linear time trend. The estimation period is 1969–2007.
4 These series were constructed in Romer and Romer, 2004, “A new measure of monetary shocks: Derivation and implications,” American Economic Review, Vol. 94, No. 4, pp. 1055–1084, and extended by Wieland and Yang, 2020, “Financial dampening,” Journal of Money, Credit and Banking, Vol. 52, No. 1, pp. 79–113.
5 The two-year real interest rate for historical estimation is constructed as the two-year nominal rate net of realized one-year forward core PCE inflation. To construct the shocks since 2021:Q4, I use the two-year nominal rate net of the two-year inflation swap.


