An Analysis of State and Local Government Spending
Starting in February 2012, the Federal Reserve Bank of Chicago, Detroit Branch, in partnership with the Michigan Council on Economic Education (MCEE) began hosting a series of educational workshops entitled, “Night at the Fed.” The purpose of these workshops is to give economics, history, and social studies teachers, as well as other financial or economic educators, the opportunity to enhance their knowledge of economics and personal finance. In addition, primary and secondary public school teachers may earn continuing education credits by attending these workshops. These workshops are held on a quarterly basis during the school year and will continue in early 2013.
The most recent “Night at the Fed” took place on Thursday, November 15, 2012, and focused on the distinction between monetary and fiscal policy. David Zin, chief economist of the Michigan Senate Fiscal Agency, presented information on the limitations and powers of fiscal policy. Zin discussed not only federal fiscal policy, but also state and local fiscal policy, in great detail. State and local fiscal policy has been somewhat ignored, with greater attention being placed on the approaching “fiscal cliff” facing the federal government. However, whatever proposals result from the ongoing “fiscal cliff” negotiations, state and local budgets will most likely be affected.
The largest sources of revenue for the state of Michigan and its local governments, as seen in Chart 1 below, are non-tax sources, such as school fees, state-provided services, licenses, permits not related to transportation, and lottery transfers to the School Aid Fund. The next largest revenue sources are intergovernmental revenues, corporate taxes, and income taxes, which when put together with non-taxable sources, comprise over 88% of the state of Michigan’s revenue and 96% of its local governments’ revenue.
Chart 1: State revenue sources: All states, Michigan
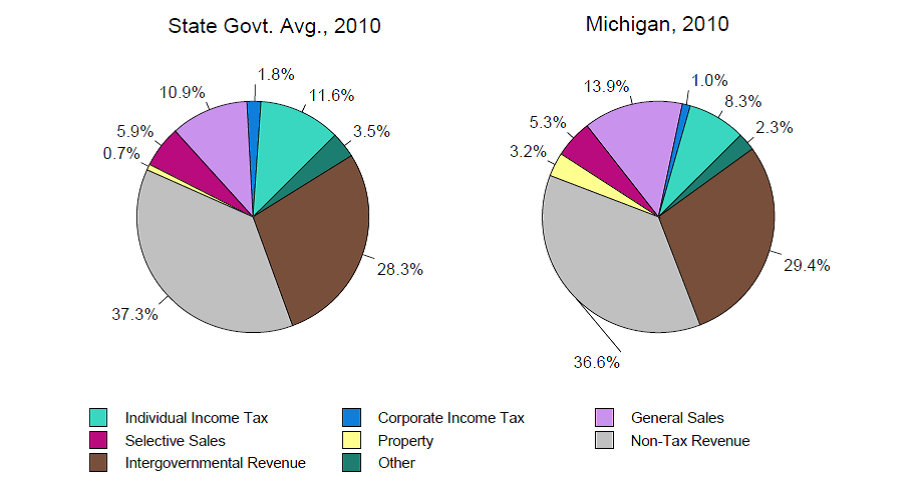
Chart 2: Michigan General Fund Revenue Sources
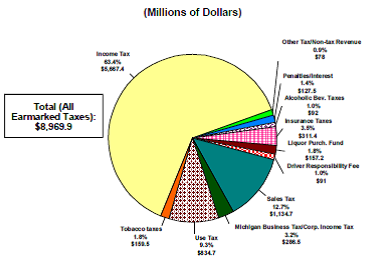
Chart 3: Michigan School Aid Fund Revenue Sources
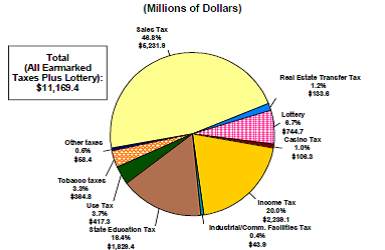
As seen in Chart 3, the largest input into the SAF is state sales tax revenue, which makes up almost 47% of SAF revenue. SAF nominal revenues have remained flat since the beginning of the most recent national recession in December 2007; SAF real revenues have fallen slightly during the same period. Overall revenues (GF/GP + SAF) are expected to increase at 2% to 4% annual rates over a three-year period that includes the most recent fiscal year. After a slight decrease in net revenues during the most recent fiscal year, 1% to 3% increases in net revenues are expected from fiscal year 2012 to 2014.
Despite some increase in net revenues since the end of the recession, tax breaks have grown even faster. This gap may widen further because of the state’s failure to replace lost revenues due to changes in the state business and personal property tax codes, respectively.
The gap between tax expenditures and revenues based on current state policies takes on greater importance when analyzing state spending trends. At the state level, spending is dominated by intergovernmental grants, Medicaid, and other social services, areas of intensifying cost pressures. Those categories, plus insurance trusts, which include unemployment compensation funds, workers’ compensation, and employee retirement systems, constitute the majority of state government spending. When examining where all gross Michigan tax revenues are spent, more than 75% are spent on social services and education as seen in Chart 4.
Chart 4: Where State of Michigan Tax Dollars Are Spent
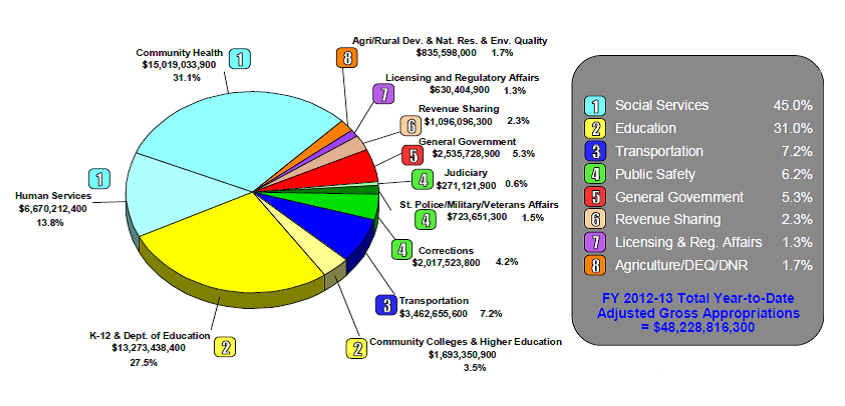
Looking at spending that the state can control, which comes from the GF/GP, health services and education make up almost half of all appropriations, but another 20% is spent on corrections. When considering current fiscal year projections, gross spending has been relatively flat since 2008, while GF/GP spending has increased 5%. Most of the spending increases are occurring in the budget areas of community health and corrections. In the past decade, spending on community health in Michigan, which includes Medicaid, has increased 53% as Medicaid caseloads have increased by almost 47%. Spending on corrections has increased 21% in the past decade, yet the prison population has decreased by almost 15%. In contrast, higher education spending has fallen 29% over the last decade, in spite of an increase in enrollment of 8%.
Chart 5. General fund / general purpose FY 2012-13 initial appropriations

Since the end of the Great Recession, Michigan has instituted budgetary reforms that have eliminated structural budget deficits present during the mid- to late 2000s. Also contributing to the elimination of these structural budget deficits has been above-trend economic growth, led by a resurgent domestic auto industry. However, more pressure will likely be placed on state and local budgets due to some of near-term challenges. These challenges include the potential establishment of health insurance exchanges and expansion of Medicaid through the Affordable Care Act, increasing state and local public pension fund liabilities, the slow housing market recovery, the taxable value cap on property values, and potential congressional action to avert the “fiscal cliff.” These challenges can be alleviated to some degree if Michigan’s economy keeps growing at a faster rate than the nation’s and more Michigan residents opt to stay in the state rather than moving elsewhere, thereby supporting the state’s tax base.
Footnotes
1 Michigan Senate Fiscal Agency, available online.


