Ballard Discusses Michigan’s Economy
At the Detroit Association of Business Economists’ (DABE) November 1, 2012, meeting, Charles L. Ballard, professor of economics at Michigan State University, delivered a presentation entitled “Michigan’s Economy on the Eve of the Election.” In his opening remarks, Ballard pointed out how “fundamental structural changes in the U.S. economy have created big problems for the Michigan economy for a very long time – not just in the last decade.” The structural change he was referring to is the shift away from manufacturing as a dominant contributor to Michigan’s economy toward more technical and service-oriented industries. The following graph shows just how much manufacturing’s share of the economy has declined for the United States and Michigan since 1963.
1. Manufacturing as a percent of gross product — U.S. and Michigan, 1963 - 2011
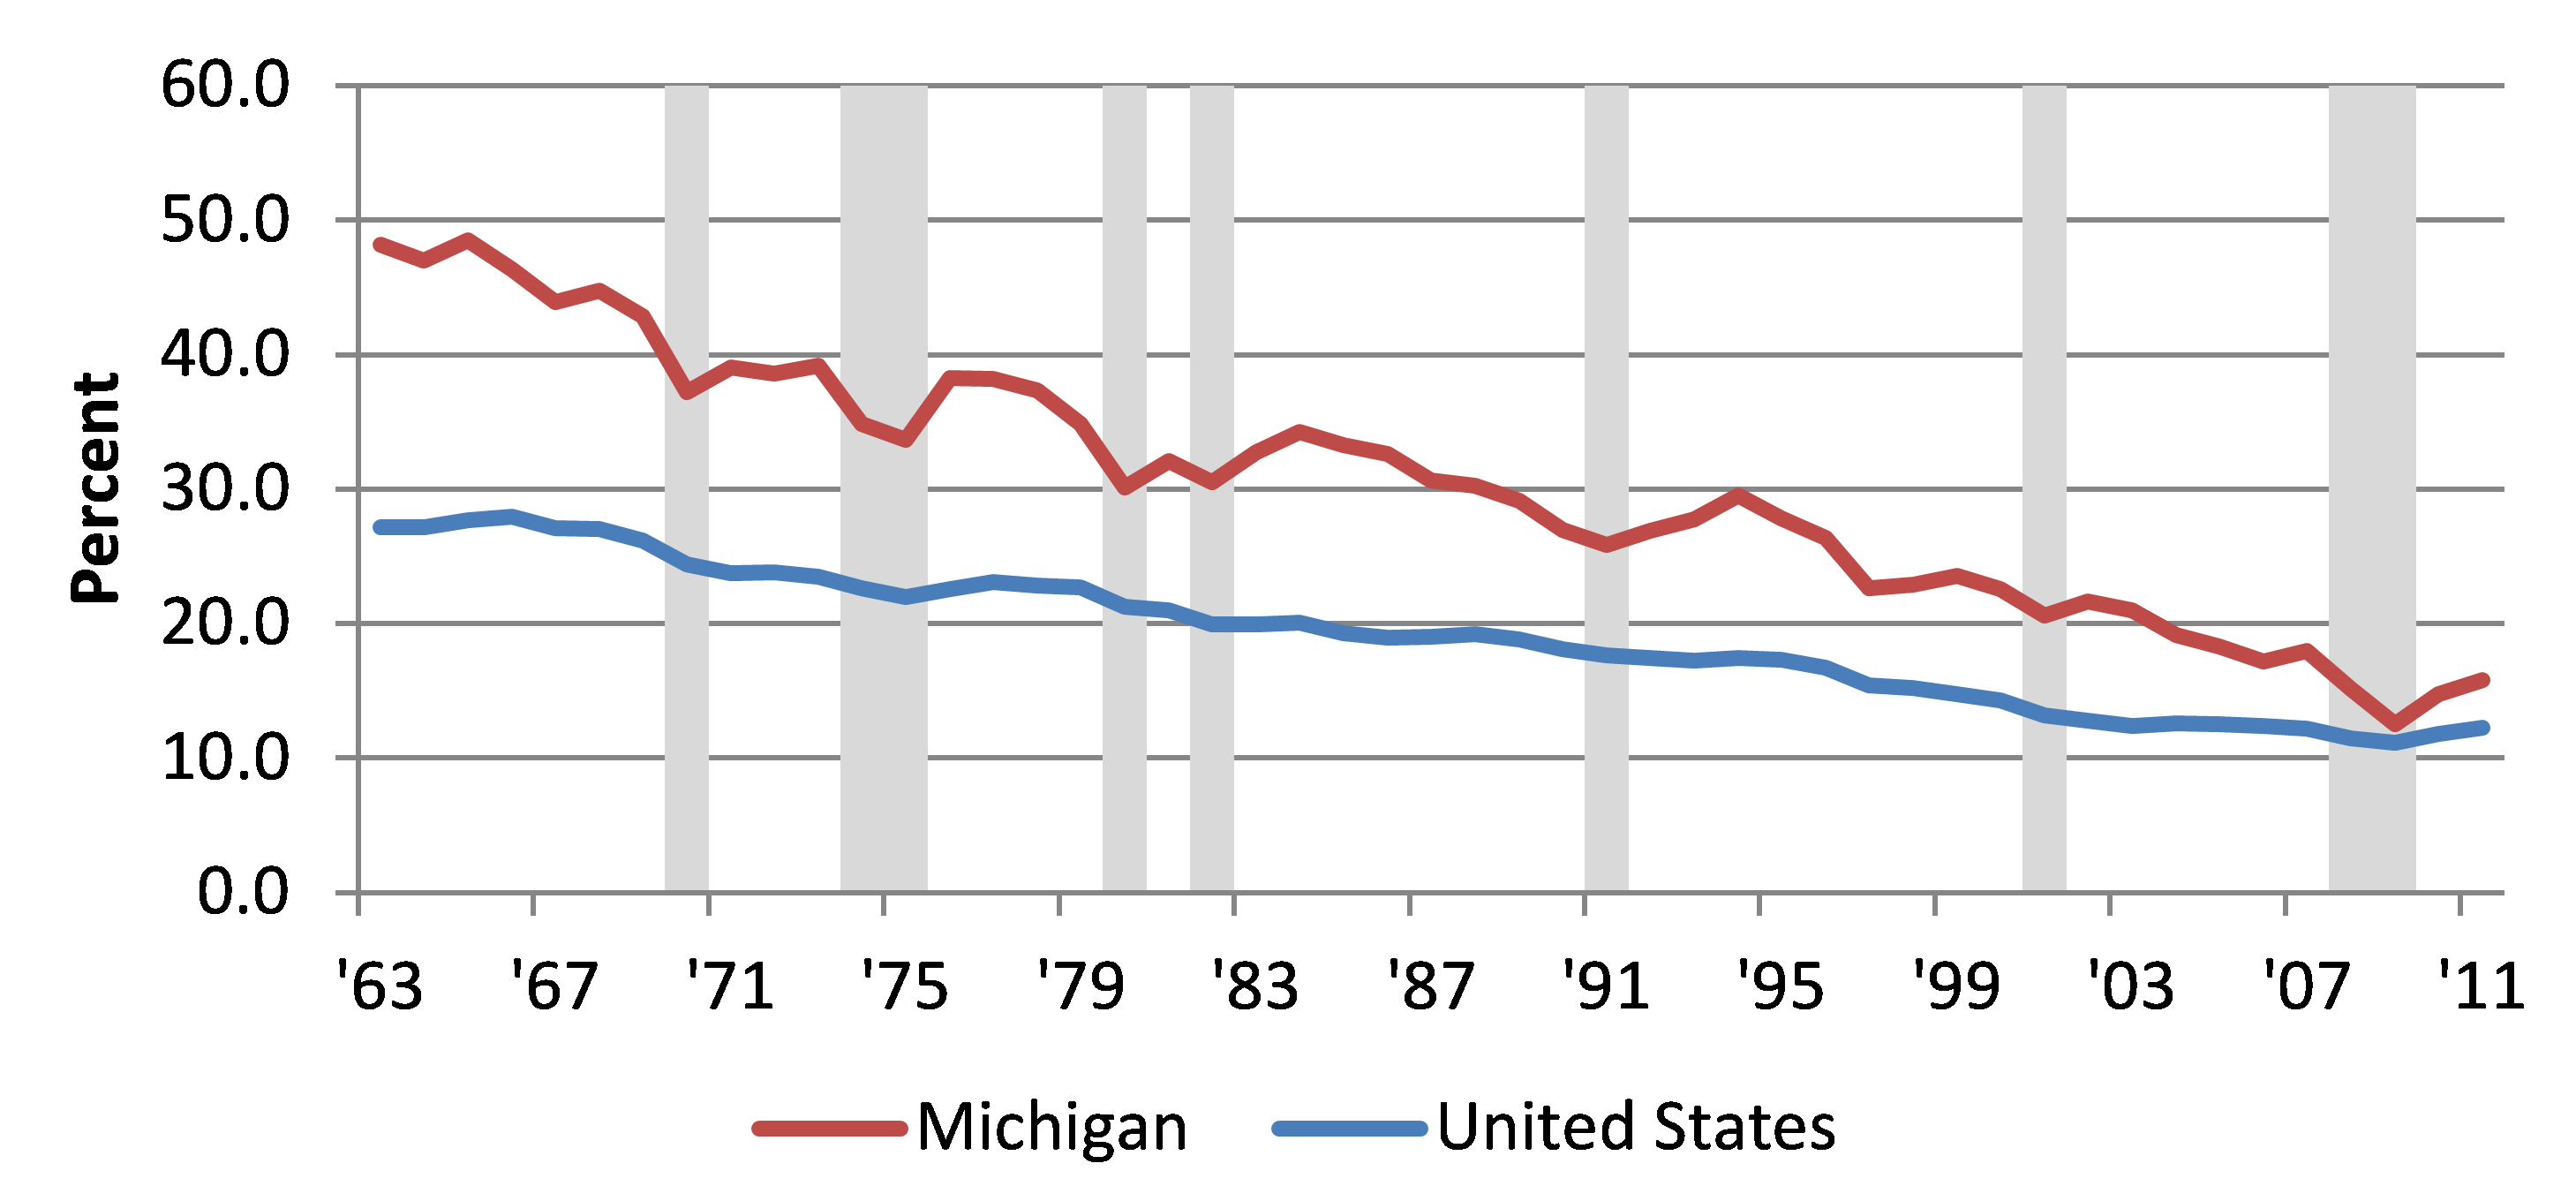
In 1963, almost half of Michigan’s economy (measured as gross state product, or GSP) was in manufacturing, most of which was related to the automotive industry. By 2009, at the bottom of the recession, manufacturing’s percentage of Michigan’s GSP had fallen to 12.5%. During that same period, manufacturing’s share of U.S. gross domestic product (GDP) fell from 27.2% to 11.1%.
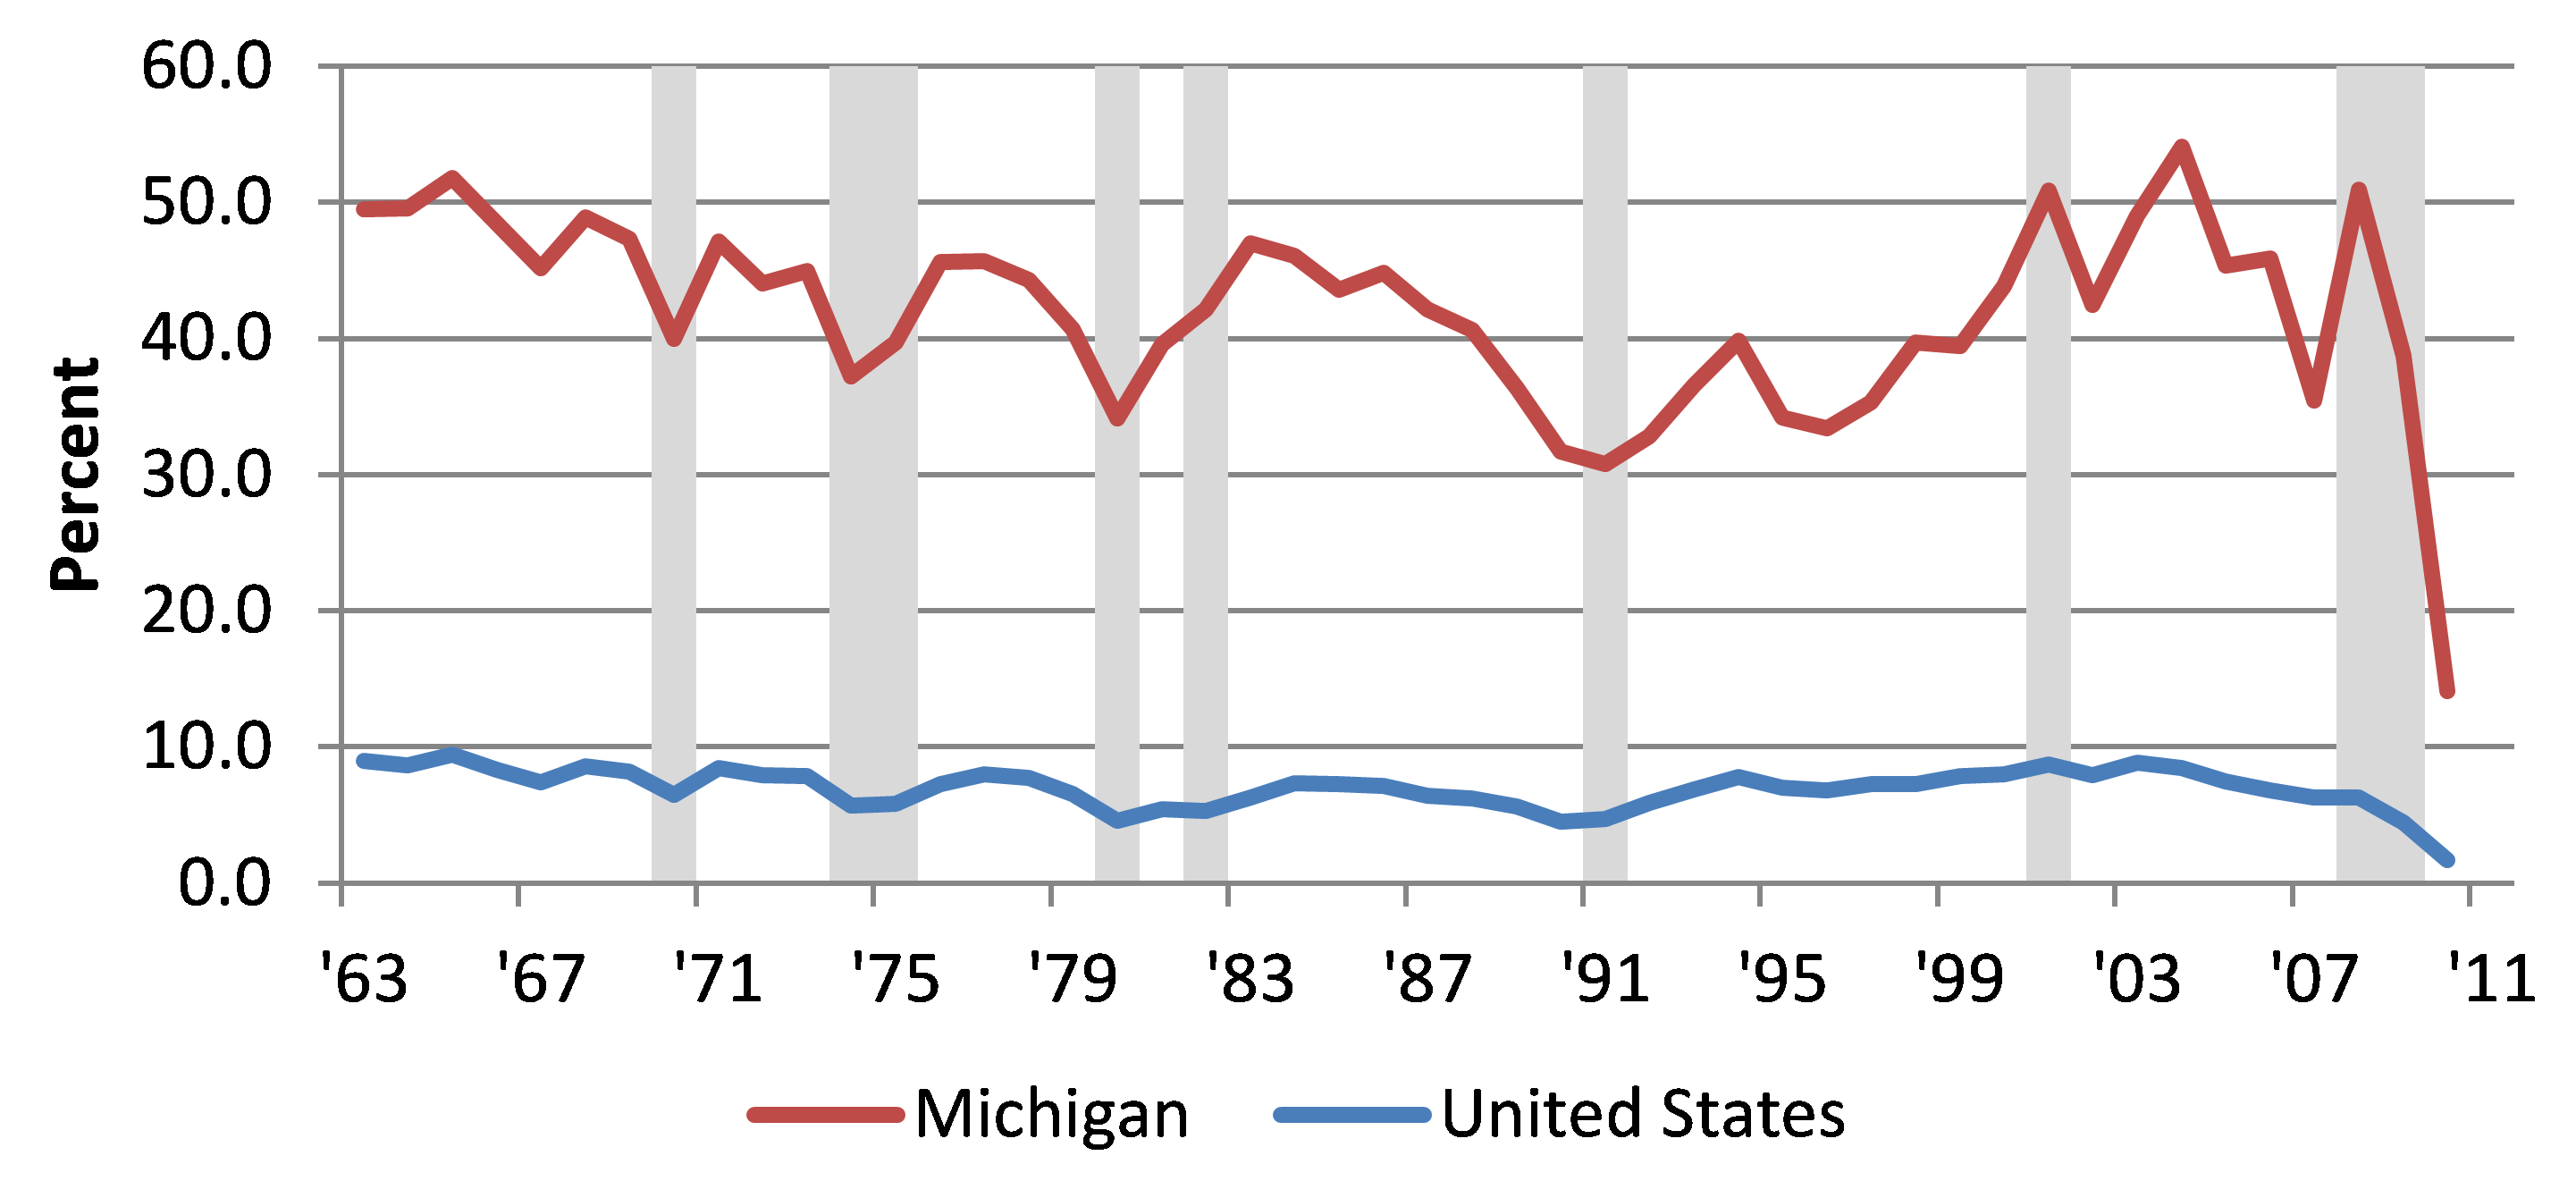
Looking deeper into the data, it can be seen that while total manufacturing was declining, motor vehicles and equipment remained a significant share of Michigan’s manufacturing structure. Even after suffering some significant declines in the late 1980s and early 1990s, the motor vehicles and equipment share of Michigan’s total manufacturing output reached a high of 50.9% in 2001 (see chart ). Every time it became apparent that Michigan’s economy was going through a significant structural change and something needed to be done to diversify its economy, the automotive industry would stage a cyclical comeback, which would act to mask Michigan’s over-dependence on a declining sector of the U.S. economy. To some extent, Michigan became a victim of its own early success with the auto industry.
2. Motor vehicles and equipment as a percent of manufacturing — U.S. and Michigan, 1963 - 2011
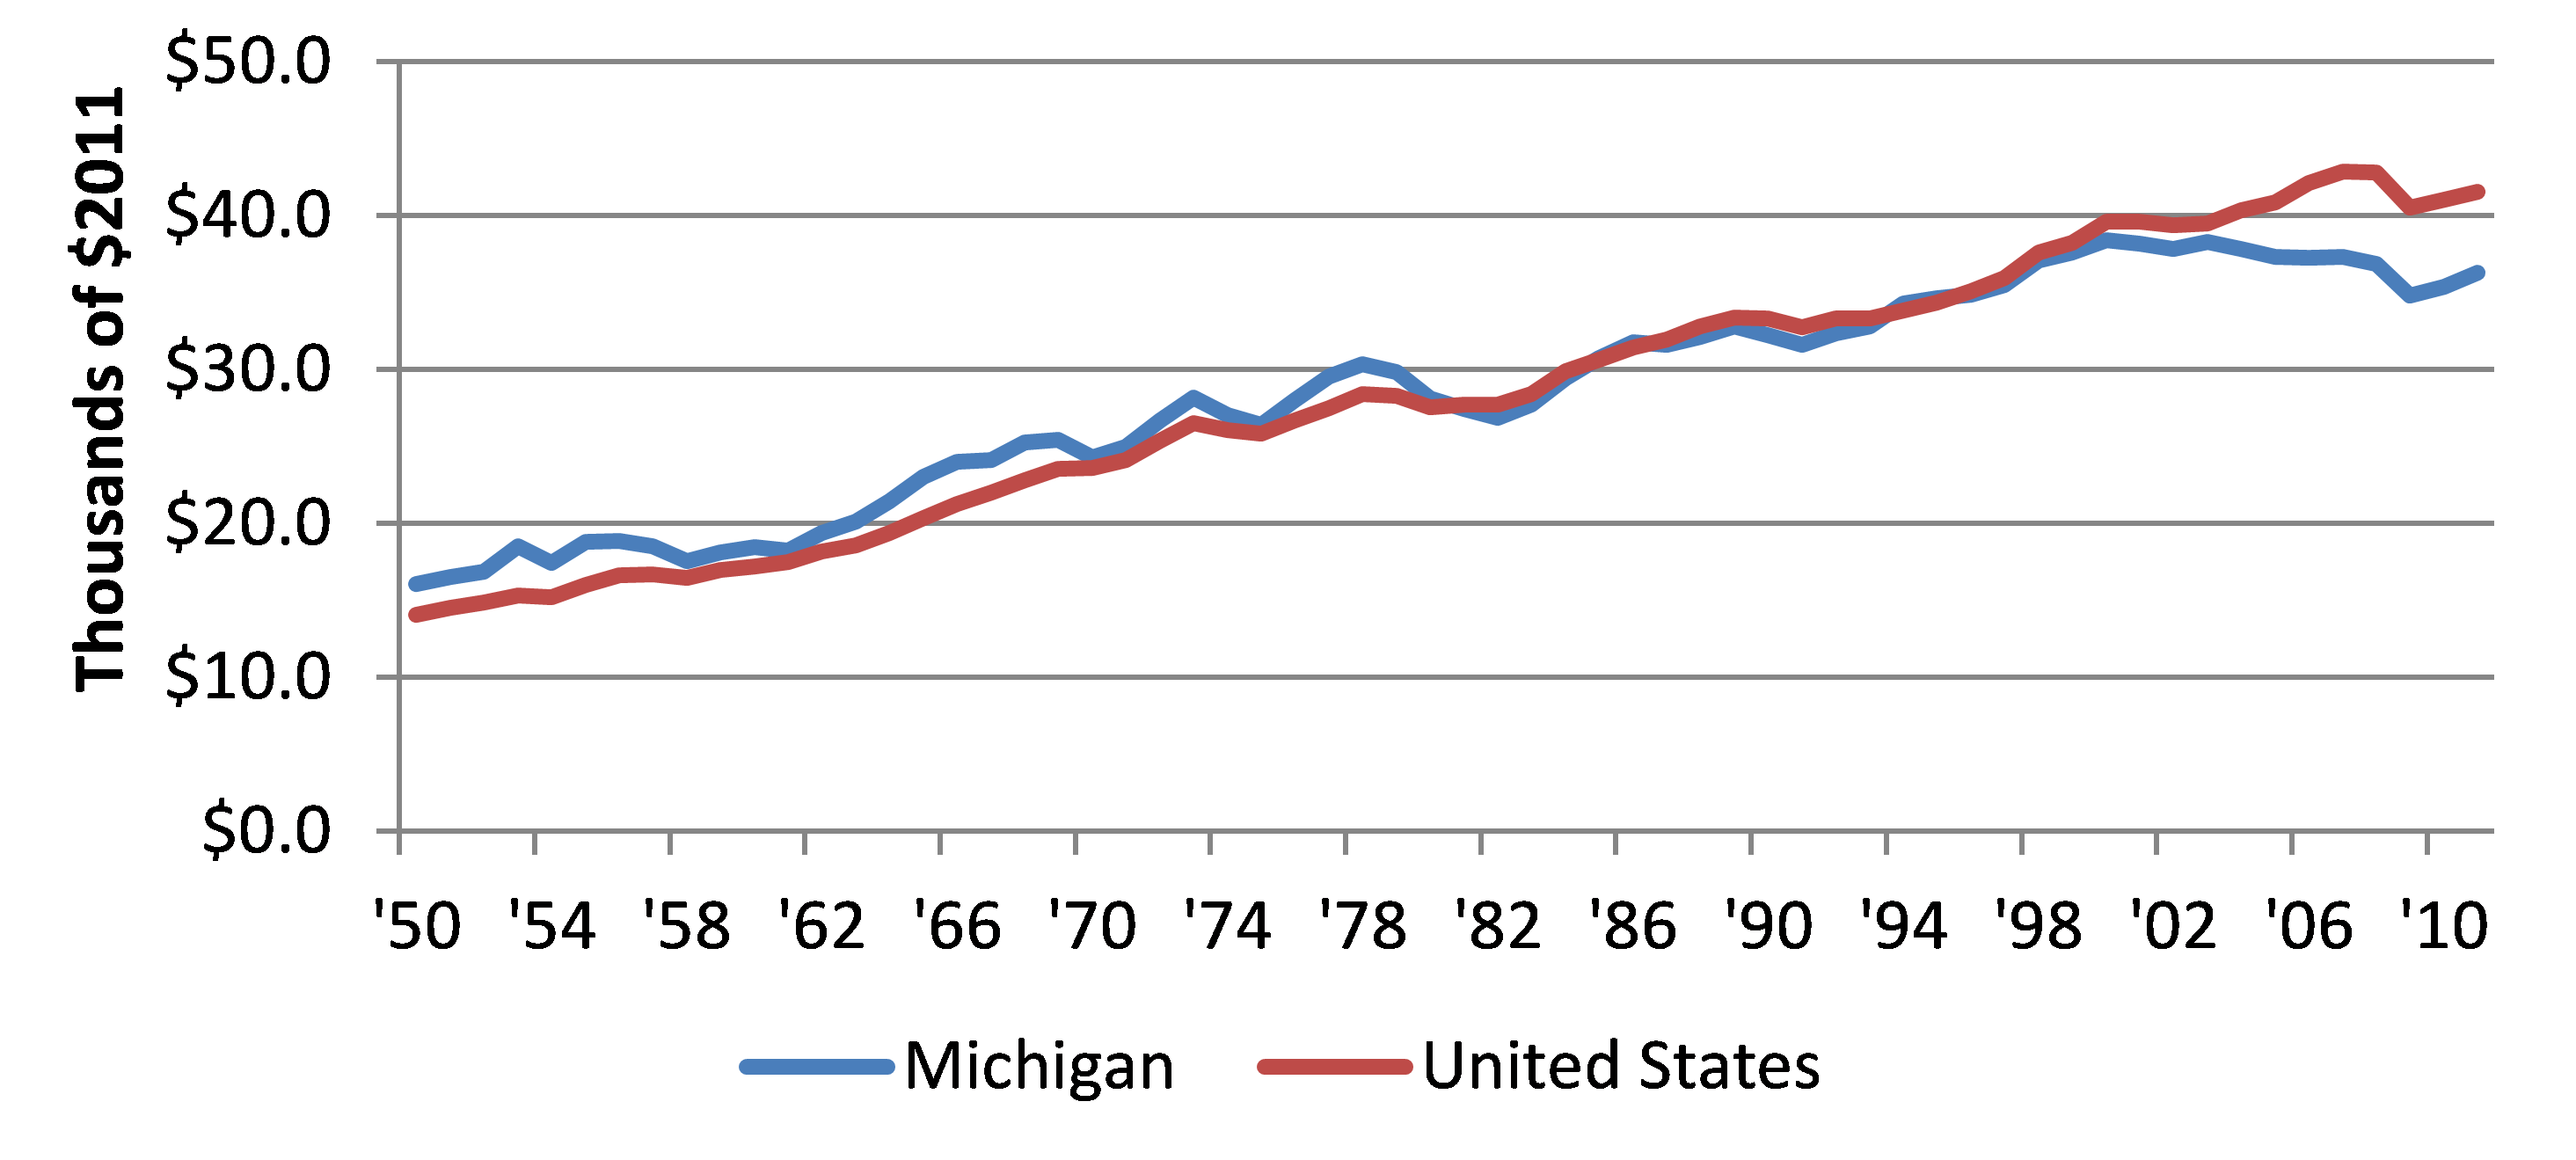
Professor Ballard went on to point out that despite its struggles, Michigan remained a relatively affluent place to live. The following chart shows Michigan’s inflation adjusted per capita income, compared with that of the United States as a whole. What this seems to show is that through the early 2000s, Michigan’s per capita income tracked the nation’s very closely.
3. Per capita income — 1950 - 2011
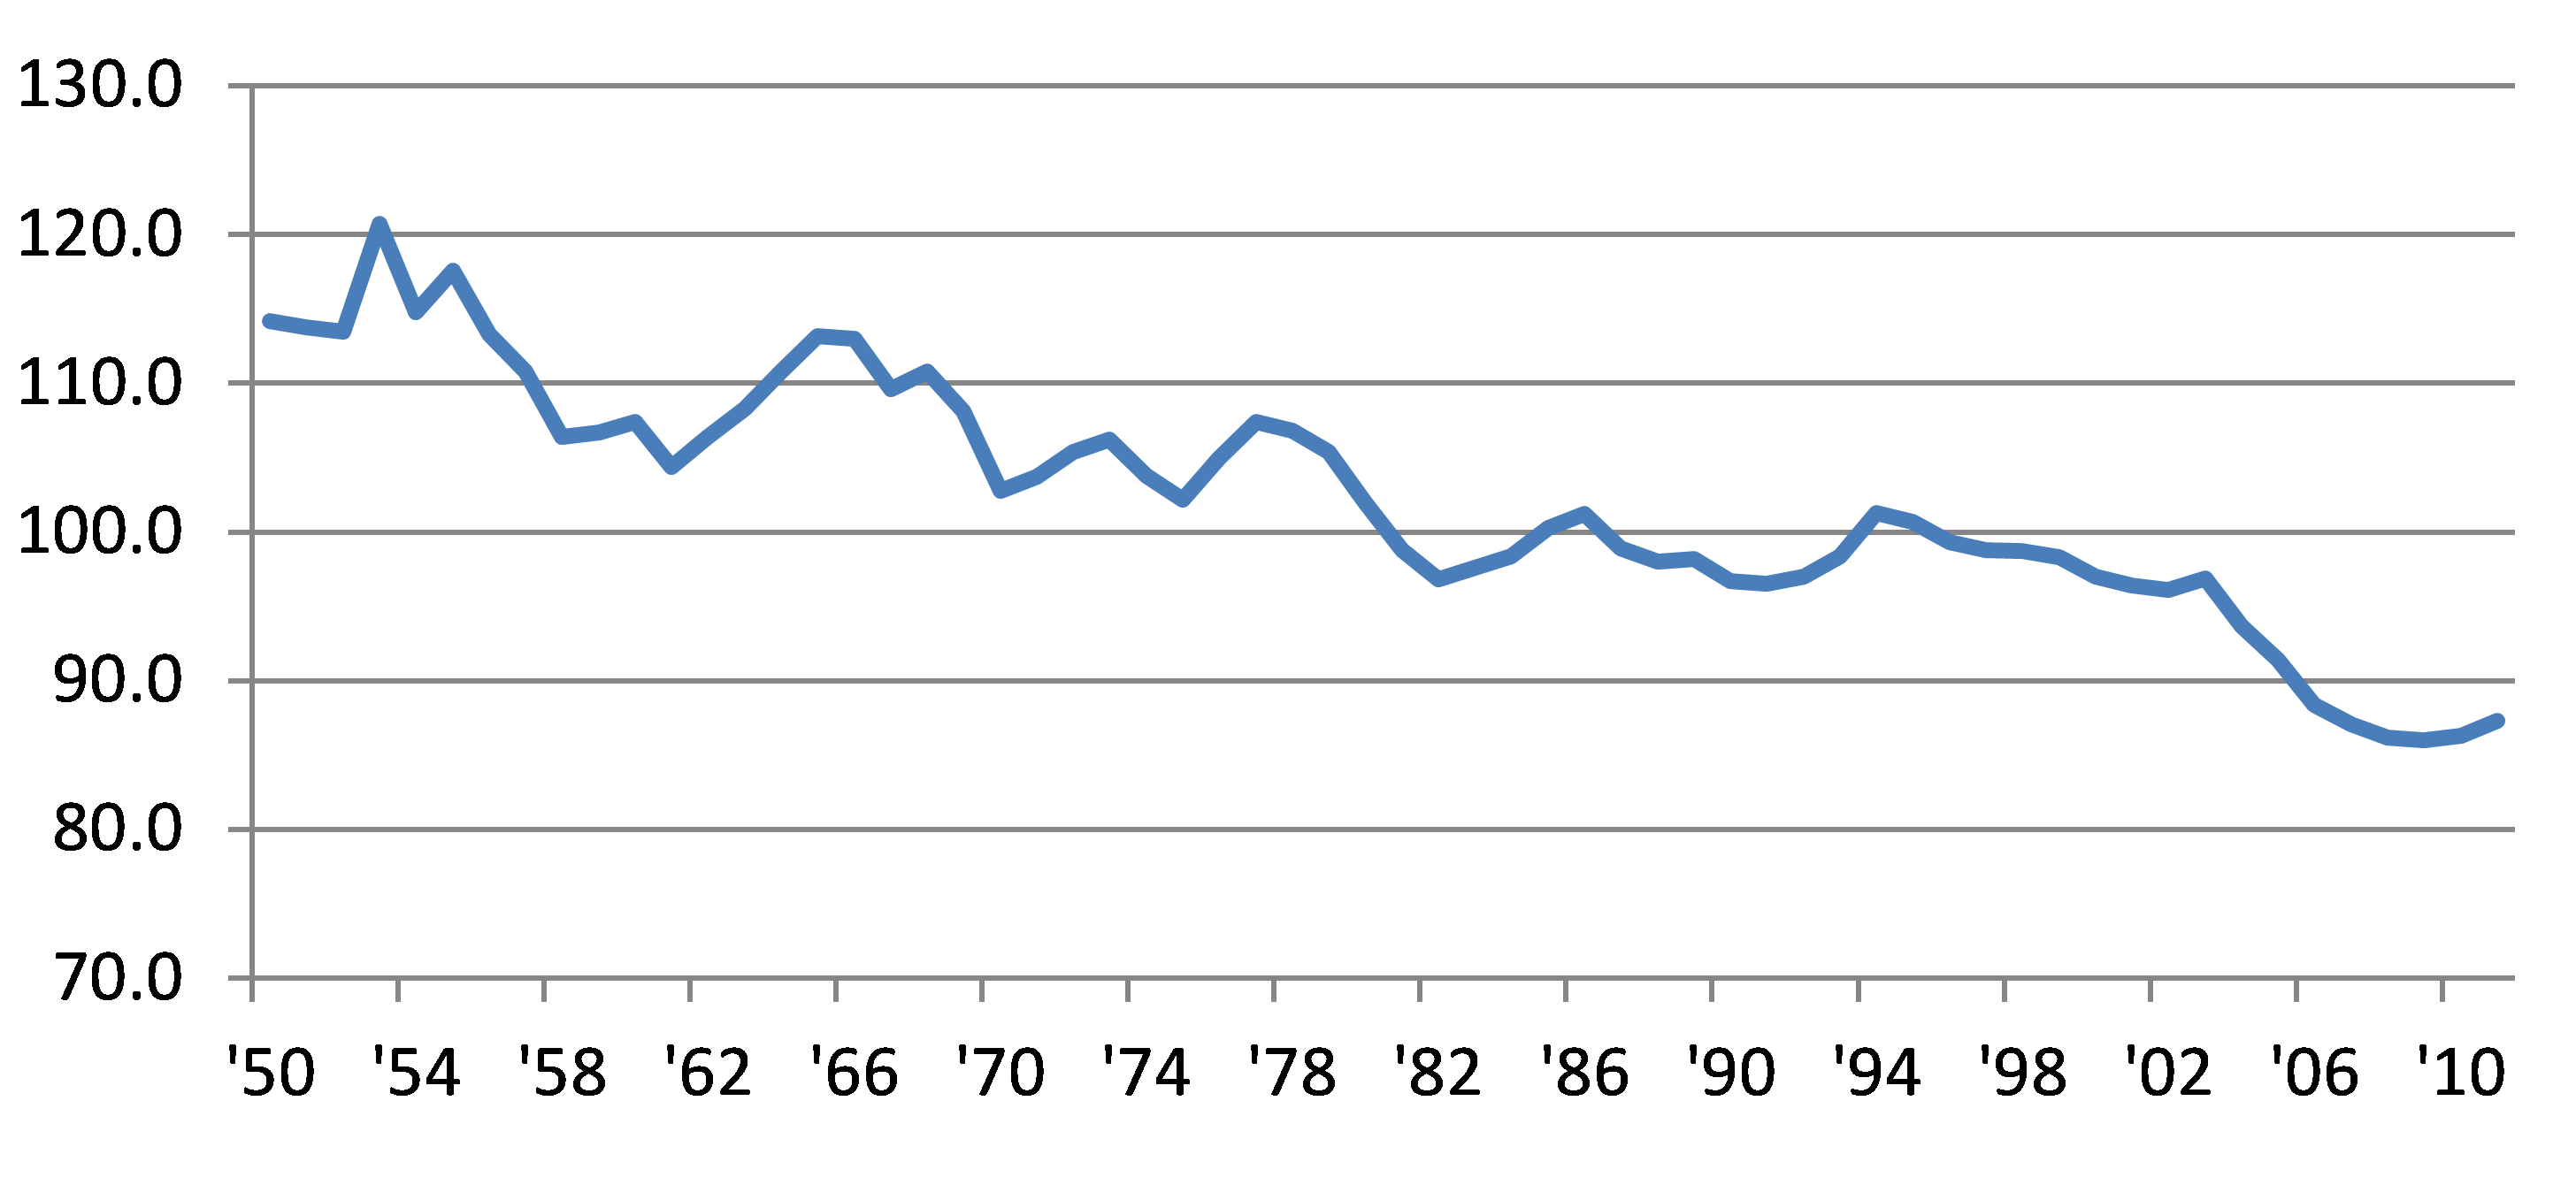
However, a closer look at the data tells a slightly different story. The following chart uses the same data to show Michigan’s per capita income as a percentage of the nation’s. Here we see that Michigan incomes started losing ground as far back as the early 1950s. However, the auto industry continued to be a very attractive industry to many workers. It was a well-established fact for anyone growing up in Michigan that they could make a good living working for one of the automotive manufacturers with not much more than a high school education. According to Bureau of Labor Statistics (BLS) data, just prior to the recession in 2009, the average hourly earnings for Michigan production workers in the motor vehicle parts manufacturing industry were $25.56, which is equivalent to an annual salary of $53,165. According to U.S. census data, in 2009 the average income for all persons regardless of level of education attainment was $42,469. But because of global competition and automation of some of the assembly jobs, many of the higher paying low-skilled automotive jobs began to disappear. This seemed to accelerate the decline in Michigan’s per capita income, compared with the rest of the nation. By 2011, Michigan’s per capita income was down to 87.3% of the national average.
4. Michigan per capita income — Index, U.S. = 100
Taking the broader perspective across all U.S. states, Ballard pointed out that there seems to be a strong positive relationship between income and educational attainment. The following scatter plot shows per capita income by state and the percentage of population with at least a bachelor’s degree.
5. Per capita income and college attainment — for 50 states, 2009

The data in this chart show that higher levels of education seem to lead to higher expected incomes. So even though Michigan was once near the top compared with the rest of the nation in per capita income, by 2009 it had fallen to 31st in per capita income and 36th in educational attainment.
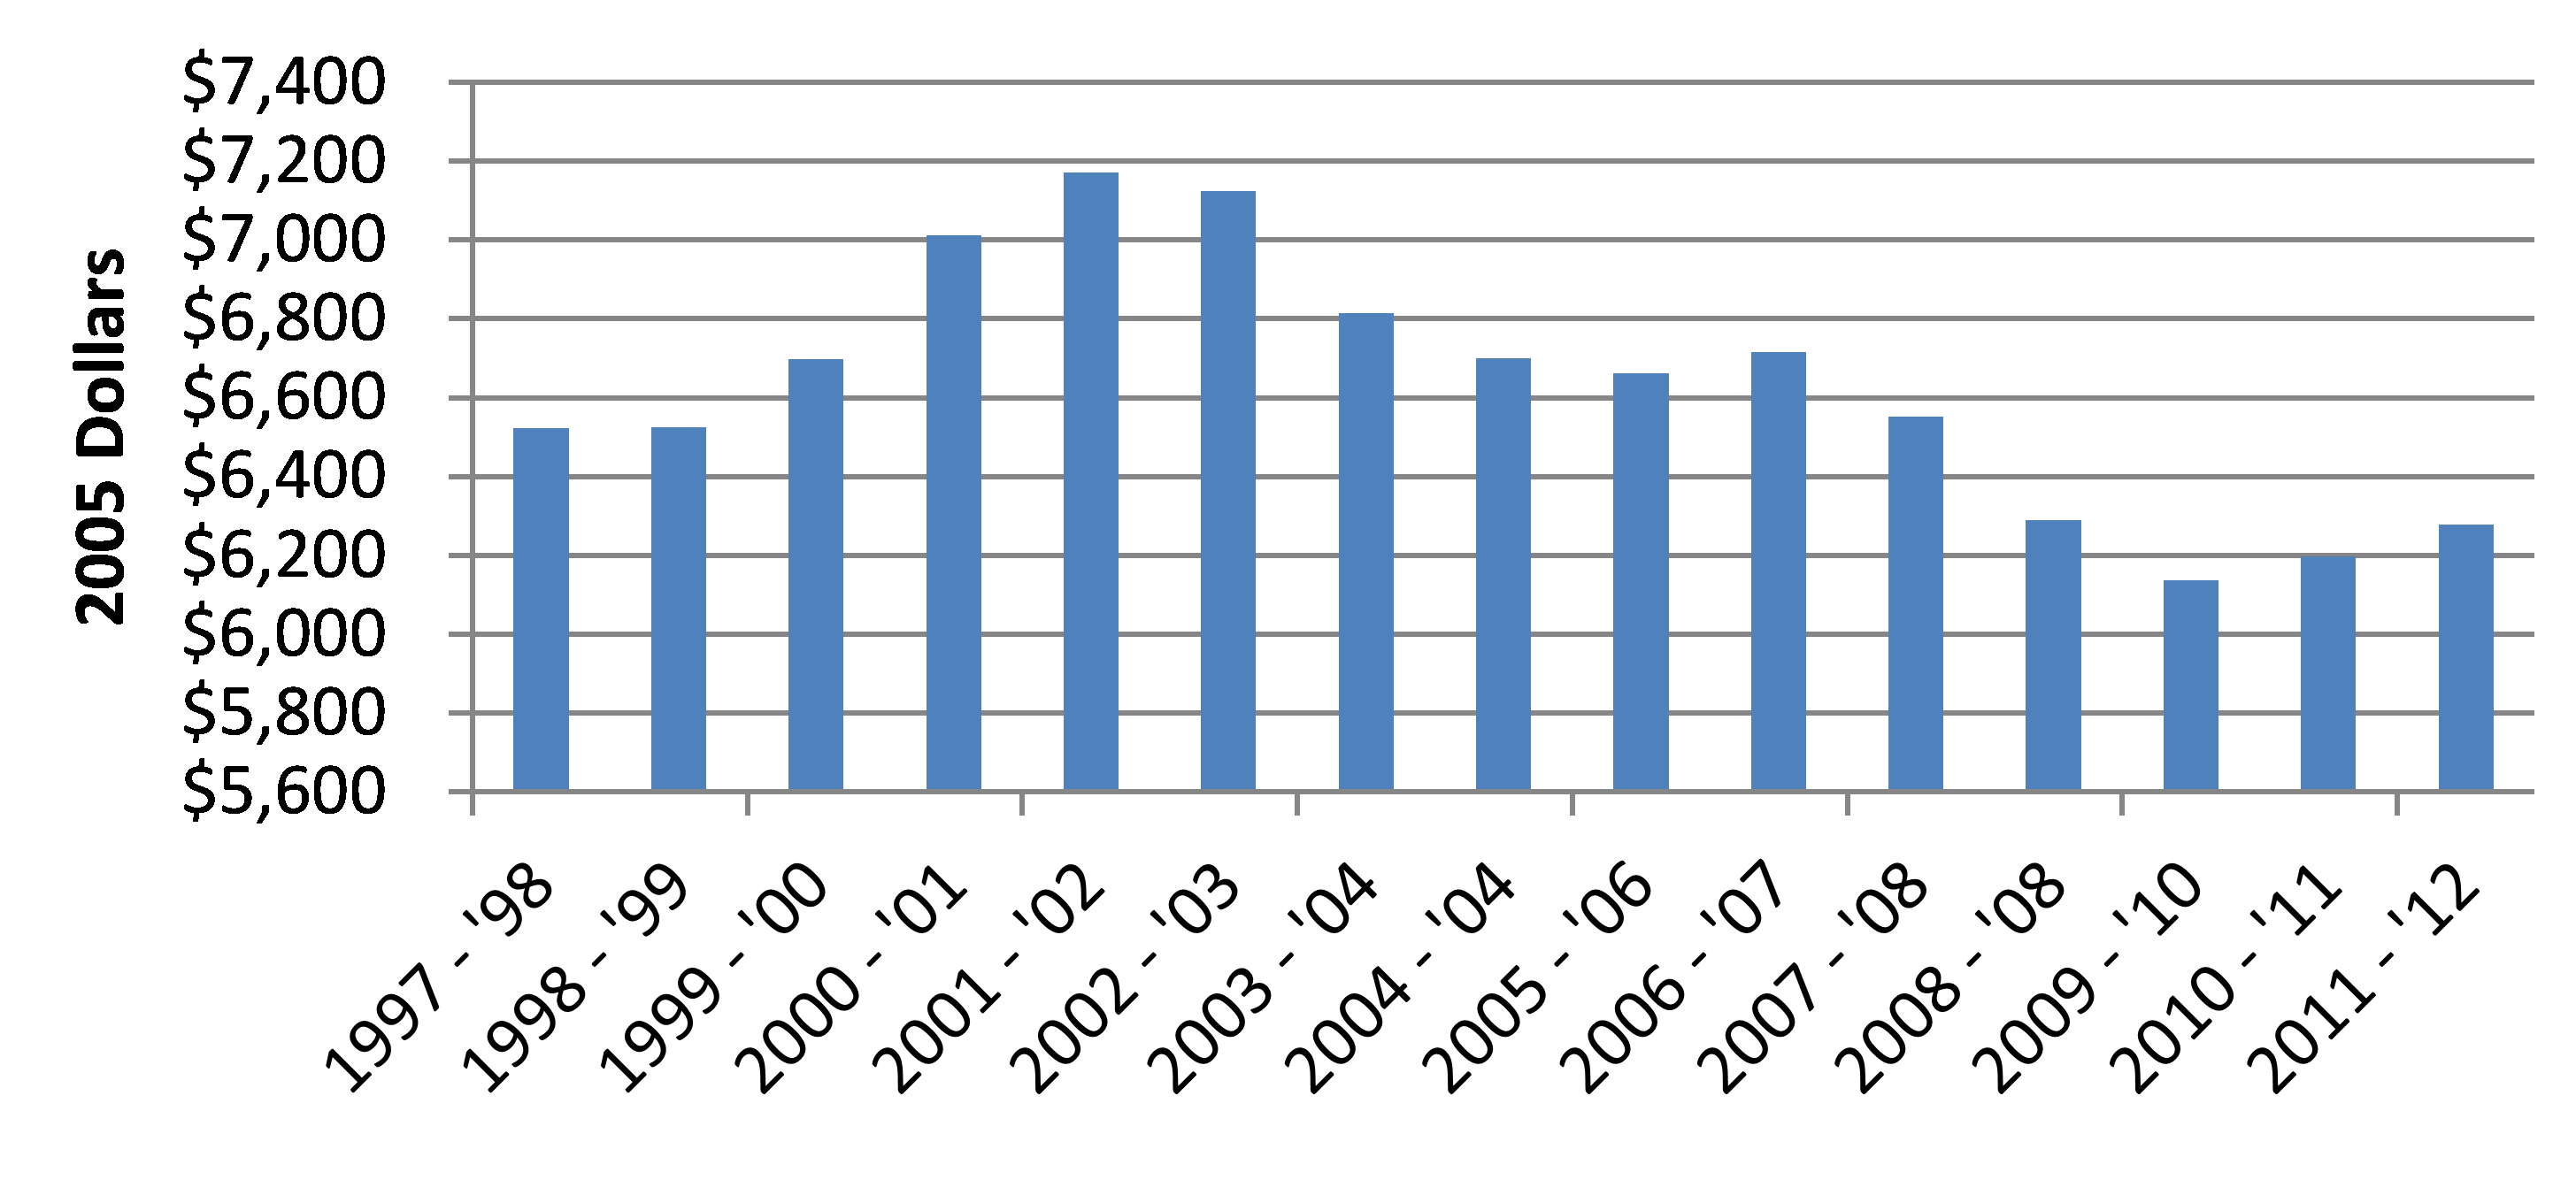
Ballard argued that given the current level of global competitiveness, education has become more important than ever for Michigan’s future. But this realization could not have come at a more difficult time for the state. In 2000, U.S. light vehicle sales peaked at 17.3 million units. By 2009, the effect of the recession reduced that number to just 10.4 million units, the worst light vehicle sales this country had seen since 1982. Because of its dependence on the auto industry, Michigan suffered a devastating impact from this decline. Many auto-related businesses were forced to make major cutbacks, forcing many workers to leave the state in search of employment. This led to drastic cuts in state spending, including spending on education. The chart below shows how inflation-adjusted spending per pupil in grades K through 12 has fallen in Michigan since its peak in 2001.
6. Fiscal year appropriations per pupil — Grades K - 12
In addition to these cuts, since 2003 appropriations for state-funded colleges have been reduced by $637 million, not even accounting for inflation. In the 2012–13 fiscal year state budget, Michigan was forced to cut state appropriations to higher education by 15%. On a somewhat positive note, Ballard noted that, recently, auto sales appear to be on the rebound and Michigan’s economy is doing better. However, he warned that continued diversification of Michigan’s economy is imperative if the state is to avoid repeating some of its past mistakes. This will require more emphasis on education and a more diversified economy throughout the state.


