Digging Out of a Hole – A View from Detroit
Digging out of a hole sounds like an oxymoron, but that seems to be what is happening with this particular economic recovery compared with recoveries from past recessions. Rather than the more rapid growth we would expect from the type of recession the U.S. just experienced, the economy is experiencing very tepid growth. The latest gross state product (GSP) data show just how slowly the recovery is proceeding for the Seventh District. 1
1. Real state product — FRB 7th District (billions chained 2005 dollars, percent change year over year)
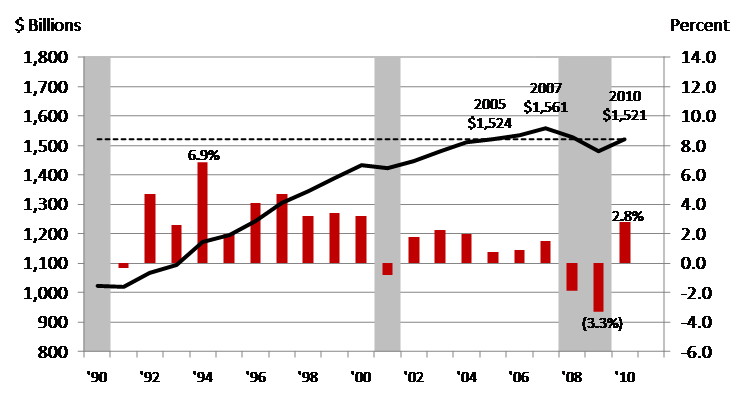
Even though the District is leading the nation during the recovery in its manufacturing and agricultural sectors, as of the end of 2010 its total output is still lower than it was in 2005. The District is making some progress, but the direction of the recovery does look more like tunneling out of a hole than a vertical assent.
To get a sense of how different this recovery is, we can look at past rebounds from recession. For example, on average, three years after the start of the previous two recessions, the region had already experienced expansion of over 10.0%. By 2010, three years after the start of the 2007 recession, total GSP for the District is still 2.6% below its 2007 level. This hole is pretty deep.
It is important to note that the recession was not evenly distributed across all District states. The following chart shows the GSP for each state in the District indexed to calendar year 2000. It can be seen here that Michigan never really recovered from the 2001 recession. In fact, Michigan’s previous GSP peak was eight years earlier back in 2003.
2. Real state product — FRB 7th District (calendar year 2000 = 100)
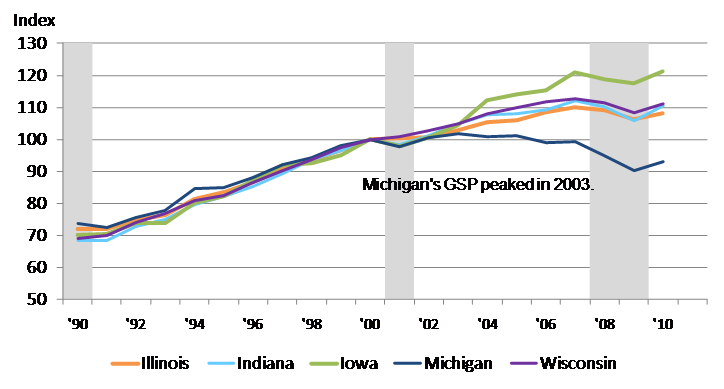
While Wisconsin, Indiana, and Illinois seem to have tracked each other very closely over the past decade, Iowa has shown the strongest growth of all the states in the District. In fact, Iowa has experienced 21.3% growth since 2000. Its growth has been supported by a rise in agricultural commodity prices and the fact that it didn’t experience a housing price bubble, which has allowed the real estate sector to continue to show growth over the last decade. On the other hand, Michigan’s economy, which has been hurt significantly by declines in auto sales, has shown the weakest growth, its 2010 total GSP is still below where it was in 2000.
The next chart compares real state product growth in the District states from 2009 to 2010 with the nation as a whole.
3. Real state product — FRB 7th District (percent change year over year and state rankings)
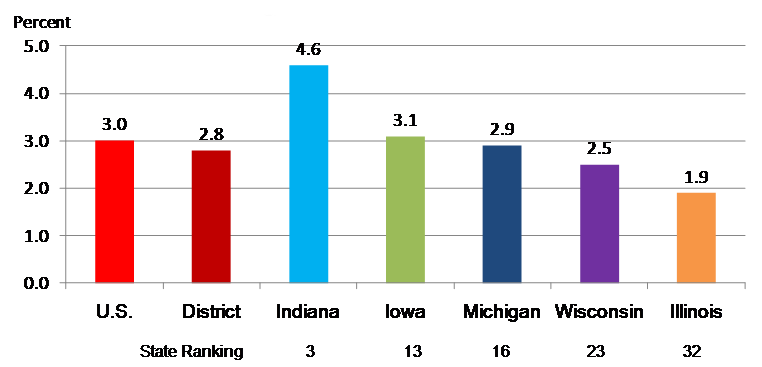
The District grew at 2.8% in 2010, compared with 3.0% for the nation. Two of the five states grew at rates greater than the nation and four out of five states grew faster than more than half the states in the country. Michigan, which has been struggling for the past decade, actually did quite well growing at 2.9% and coming in at 16th place among all the states. Indiana, Iowa, Wisconsin and Illinois placed 3rd, 13th, 23rd, and 32nd, respectively.
In terms of job growth, the region’s economy may be performing slightly better than the nation overall in 2011. Through June 2011, the District had created jobs at a faster pace (0.9%) than the nation as a whole (0.7%), albeit from a much lower trough.
4. Nonfarm payroll employment — 7th District (percent change 2011 - July YTD and state rankings)

Michigan, which lost population in the last census, actually led the District in the first half of this year with job growth of 1.9%, it ranked 4th in the nation in growth of nonfarm payroll jobs. On the other hand, Indiana ranked last with employment down 0.4% in July 2011 on a year-to-date basis.2 Even though Indiana has seen a decline in total nonfarm July 2011 year-to-date, the state has experienced job gains in two sectors, mining and logging (1.5%) and manufacturing (1.2%).
Still, total nonfarm payroll employment in the District remains well below its previous peak. In fact, as can be seen in the following chart, nonfarm payroll employment for the District is still below where it was in 1996. In addition, the nation as a whole has also seen a sharp decline in nonfarm payroll jobs since the start of the latest recession — nonfarm payroll employment for the country is currently about where it was in 2004.
5. Total nonfarm payroll, millions of employees (annual data — 1990-2011 July YTD)
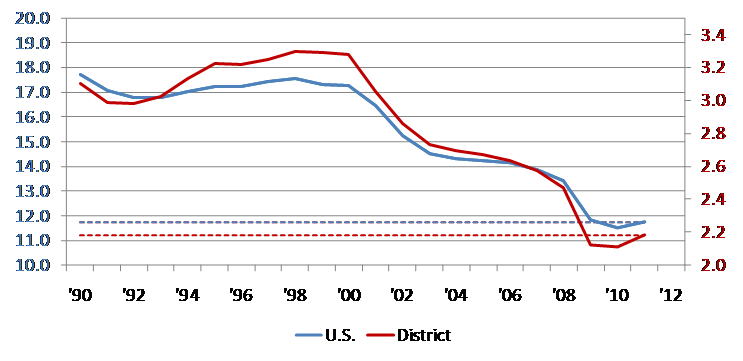
If we take a closer look at manufacturing employment data for the nation and the District, we see an even more distressing picture. Since 1990, the nation and the District have lost about 35% of their manufacturing jobs. This is equivalent to over 6.0 million jobs nationally, of which the District accounts for about 1.1 million. At its peak in 2000, the District accounted for 19.1% of the nation’s manufacturing employment. By July 2011 its share had fallen to about 18.6%. Also at the peak in 2000, the region had 474,000 auto related jobs, which accounted for about 14.4% of the region’s manufacturing employment. As of July 2011, manufacturing employment in the region was 2.2 million jobs, of which 203,600 or 9.3% were in the auto industry.
6. Manufacturing employment, millions of employees (annual data 1990-2011 July YTD)
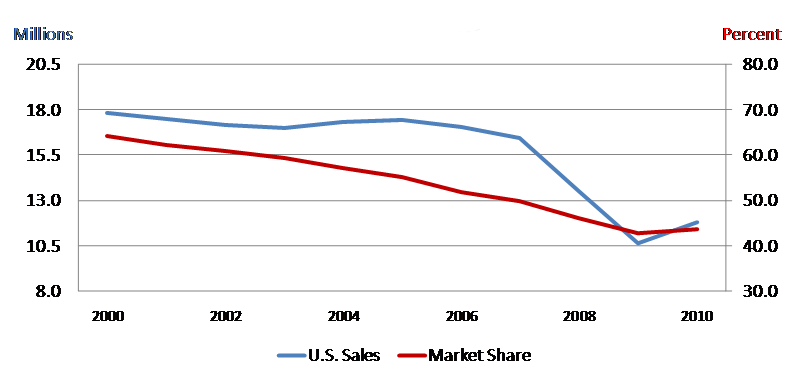
Some of the employment declines have come about from labor-saving productivity improvements, but many are the result of declining U.S. auto sales together with declining market shares of the Michigan-based Detroit 3 auto makers and their suppliers.
7. Total U.S. sales and Detroit 3 share
In the past couple of months total light vehicle sales have been disappointing but, on the bright side, the traditional domestic manufacturers have been doing relatively well. In fact, on a year-over-year basis through June of this year, the Detroit 3 collectively saw sales increase by 15.5% versus an increase of just 7.6% for the industry as a whole. The Japanese manufacturers experienced a decline in sales on a year-over-year basis of 11.6%, largely due to supply disruptions as a result of devastating earthquake in Japan. In addition, some customers may be postponing purchases until the Japanese manufacturers can get their inventories replenished. Thus, absent the impact of the earthquake and related supply disruptions, auto sales overall would have been stronger in recent months.
8. U.S. light vehicle S.A.A.R
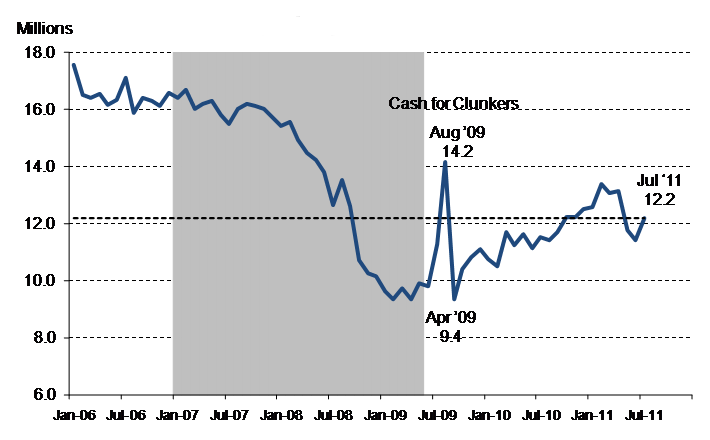
It remains to be seen when auto sales will regain the positive momentum they had shown earlier in the year but despite recent setbacks, the August 2011 Blue Chip consensus for light vehicle sales for 2012 is 13.6 million units. This is a 30.1% increase from the 10.6 million units sold in 2009 and an increase of 1.4 million units from the July SAAR of 12.2 million units. In addition, Ward’s Automotive is projecting that by 2012, vehicle production in the District will be up by 2.3 million units from its low point in 2009. If these projections are correct we would expect to see some more positive gains in manufacturing employment for our region — especially Michigan. Meanwhile, we just have to keep digging.
Footnotes
1 GSP is the equivalent of GDP at the national level – the sum total value of all goods and services.
2 State rankings include the District of Columbia.


