Comparing Detroit’s Commuting Patterns with Other Cities’
According to the U.S. Census Bureau, the average one-way commute time for U.S. workers increased by almost three minutes between 1990 and 2000. However, since 2000, this commute time has fluctuated between 25 and 26 minutes, even with the numbers of drivers continuing to increase. Why hasn’t the average commute time increased further? For one, U.S. roadways have also expanded since 2000—which likely helped ease some traffic congestion. Moreover, changes in the mode of transportation—such as the greater use of public transportation and carpooling—may also have helped to relieve congestion. Other possible explanations are that workers relocated closer to jobs or that jobs relocated closer to workers. In this blog entry, I examine the commuting patterns of city of Detroit and compare them with those of other cities in Michigan and across the Midwest; I also look at Detroit’s commuting patterns in comparison with those of other Rust Belt cities and similar industrial cities in different parts of the country. I present these comparisons in the hope that they will lend some insight into the ongoing and forthcoming challenges Detroit faces, including those related to improving its transportation infrastructure and broadening its economic base. Such efforts are important to Detroit as it attempts to rival cities that have turned themselves around at least to some degree (e.g., Pittsburgh and Baltimore).
The city of Detroit typifies U.S. suburban and exurban sprawl, with some job holders in the area commuting as long as 75 minutes one way from Jackson and Lansing, Michigan, regularly.1 By way of explanation, some analysts have attributed Detroit’s current commuting situation to the presence of the domestic auto industry headquarters and the absence of a suitable regional public transportation network. Indeed, the lack of a coordinated regional transit network—with the exception of a (somewhat unreliable) bus system—makes it difficult for Detroit’s job holders and residents to move inside and outside the city to their places of employment. The commuting conditions for Detroit workers and residents look even more challenging when compared with those of other major cities. The U.S. Census Bureau’s On The Map tool helps researchers analyze the commuting patterns of states, metropolitan areas, cities, and other places. I use this tool to generate the tables that follow. Table 1 presents where the jobs of Detroit residents employed in 2011 were located.
Table 1. Locations of jobs of city of Detroit residents employed in 2011
| Job Count | Share | |
| Detroit, MI | 68,973 | 37.7% |
| Southfield, MI | 11,010 | 6.0% |
| Lansing, MI | 10,003 | 5.5% |
| Dearborn, MI | 7,670 | 4.2% |
| Livonia, MI | 5,558 | 3.0% |
| Troy, MI | 5,330 | 2.9% |
| Warren, MI | 5,250 | 2.9% |
| Farmington Hills, MI | 3,522 | 1.9% |
| Romulus, MI | 2,344 | 1.3% |
| Royal Oak, MI | 1,963 | 1.1% |
| All Other Locations | 61,446 | 33.6% |
Focusing first on the central city of Detroit, we can see that 37.7% of the job holders who lived in the city of Detroit also worked there in 2011 according to the work destination report, meaning that the remaining 62.3% of Detroiters who were employed that year commuted into Detroit’s suburbs (or farther afield) for work. The main pattern that can be discerned from the table is that if one draws arcs connecting the suburbs around the city of Detroit according to the degree to which Detroiters were employed there in 2011, the primary “ring” formed would contain Southfield, Livonia, and Dearborn and the secondary ring formed (a bit farther out from Detroit) would include Farmington Hills, Royal Oak, and Warren (see the map below).
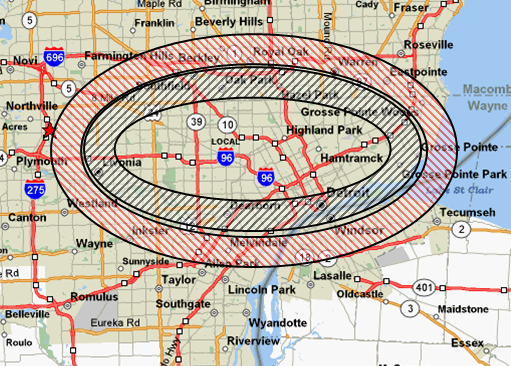
Table 2. Location of residence of workers employed in the city of Detroit in 2011
| Worker Count | Share | |
| Detroit, MI | 68,973 | 28.3% |
| Warren, MI | 7,299 | 3.0% |
| Southfield, MI | 7,097 | 2.9% |
| Dearborn, MI | 5,603 | 2.3% |
| Sterling Heights, MI | 5,375 | 2.2% |
| Farmington Hills, MI | 5,083 | 2.1% |
| St. Clair Shores, MI | 4,716 | 1.9% |
| Livonia, MI | 4,318 | 1.8% |
| Royal Oak, MI | 4,134 | 1.7% |
| Dearborn Heights, MI | 3,293 | 1.3% |
| All Other Locations | 128,088 | 52.5% |
Taking a different approach, we can examine where workers reside in the Detroit metro region. Table 2 presents information on where people who worked in the city of Detroit in 2011 lived. In 2011, 28.3% of the jobs in Detroit were occupied by workers who also lived there, meaning that 71.7% of workers employed in Detroit lived outside of the city. This 71.7% figure has most likely increased since 2011 because of the ongoing movements of people and businesses into Detroit’s Downtown and Midtown neighborhoods from outside the city.
How do these findings for the city of Detroit compare with those of other Michigan cities? Table 3 shows (employed) city residents by the share of them who work outside of their city of residence. As a rule of thumb, we might expect that larger cities to have lower shares of their residents working outside the city boundaries. But that does not necessarily hold true in Michigan. For instance, the largest city, Detroit, had 40% of its (employed) residents working within its own boundaries in 2011, leaving 60% of them working outside the city. In contrast, the much smaller Michigan city of Ann Arbor had almost 60% of its (employed) residents with jobs based within its city limits as of 2011.
Table 3. Percentage of working city residents who are not employed where they live
| Selected Michigan cities, 2002 vs. 2011 | ||
| Year | 2002 | 2011 |
| Detroit | 60% | 62% |
| Ann Arbor | 43% | 41% |
| Flint | 69% | 72% |
| Grand Rapids | 60% | 61% |
| Lansing | 65% | 73% |
This finding is not all that surprising if we look more closely at Ann Arbor’s economic makeup. Many people are drawn to both live and work in Ann Arbor (rather than just live there) because it hosts the University of Michigan, Google, and Ann Arbor SPARK (an organization that assists local businesses and entrepreneurs) and features several attractive amenities (such a bustling downtown).
The shares of residents who were not employed where they lived largely held steady for the major cities of Michigan between 2002 and 2011. Detroit, Ann Arbor, Flint, and Grand Rapids only saw small changes in their shares, while Michigan’s capital city, Lansing, experienced a larger decline in its share, possibly because of the shrinking of state government, which forced labor force participants to look for job opportunities outside the city limits.
Table 4 presents the percentage of Michigan cities’ work forces commuting into these cities from outside their boundaries. The table shows that larger shares of workers with jobs in major Michigan cities commuted from outside the city limits in 2011 than in 2002. Urban business districts often offer more opportunities for high-skilled workers, and the Michigan cities compared below are no exception. In recent years, Detroit’s Downtown area has seen an influx of large businesses, including Quicken Loans, Blue Cross & Blue Shield, and Chrysler’s executive office, coming from the surrounding suburban areas; and several small businesses have established themselves in Detroit’s Midtown area. In addition, Ann Arbor has seen several venture capitalists and entrepreneurs, along with Google, locate their operations there, providing economic growth on top of that delivered by its mainstay, the flagship campus of the University of Michigan. Grand Rapids’ growing reputation as a conference destination has brought more economic activity to its downtown. Flint’s University of Michigan campus has expanded its downtown presence. And as the state capital, Lansing will always be a commuting destination.
Table 4. Percentage of city work force who do not live where they are employed
| Selected Michigan cities, 2002 vs. 2011 | ||
| Year | 2002 | 2011 |
| Detroit | 58% | 72% |
| Ann Arbor | 72% | 78% |
| Flint | 78% | 83% |
| Grand Rapids | 73% | 77% |
| Lansing | 81% | 86% |
In the Michigan cities compared in Tables 3 and 4, the majority of each city’s own working residents were commuting outside of the city for work in 2011 (with the exception of Ann Arbor), while the majority of city-based employers had employees who lived outside of the city that year. These trends are in stark contrast with those of the mid-twentieth century—when city residents could find work easily inside their respective cities, often at one of the many manufacturing facilities. Nowadays, given the loss of manufacturing jobs and the deterioration of city residents’ job skills, residents must often look outside the city limits to find job opportunities and employers must be able to draw workers from outside the city in which they’re based.
For Detroit, Lansing, and Flint, Table 4’s results for both 2002 and 2011 most likely reflect people wanting to live outside the city because of a combination of negative housing conditions, poor public service delivery, low school quality, and overall low quality of life. But in Ann Arbor and Grand Rapids—two cities with more positive reputations—the results from Table 4 may reflect people having gained employment in these two cities but deciding to commute there from their residences outside the respective city limits.
Table 5. Percentage of working city residents who are not employed where they live
| Selected Seventh District cities, 2002 vs. 2011 | |||
| Year | 2002 | 2011 | |
| Detroit, MI | 60% | 62% | |
| Chicago, IL | 37% | 36% | |
| Des Moines, IA | 40% | 50% | |
| Indianapolis, IN | 27% | 33% | |
| Milwaukee, WI | 47% | 47% | |
So, how does Michigan’s story compare with those of other major cities in the Seventh District? Of the major Seventh District cities featured in Table 5, only Chicago and Milwaukee have extensive mass transit systems (something in addition to buses). Seeing that more Indianapolis residents worked within the city in both 2002 and 2011 may be surprising, but the city encompasses most of Marion County, which has a large surface area. Over the past few years, Des Moines has seen an increase in commuter traffic from the city to its suburbs, particularly West Des Moines, as they become more popular for businesses and residents. The 10 percentage point increase in (employed) city residents not working where they live for Des Moines between 2002 and 2011 is likely reflected in this increase in commuter traffic. This percentage did not change as dramatically for the other Seventh District cities studied.
According to Table 6, 46% of people who worked in the city of Chicago in 2011 did not live there. Indianapolis’s suburbs such as Brownsburg, Zionsville, and Fishers have seen population increases over the past few years, which may explain why a higher share of its city work force lived outside of the city limits in 2011 than in 2002. All of the Seventh District’s major cities have the infrastructure to handle more inbound traffic from their suburbs—namely, extensive freeways systems—so the commuting patterns shown in Table 6 should not be all that surprising.
Table 6. Percentage of city work force who do not live where they are employed
| Selected Seventh District cities, 2002 vs. 2011 | |||
| Year | 2002 | 2011 | |
| Detroit, MI | 58% | 72% | |
| Chicago, IL | 42% | 46% | |
| Des Moines, IA | 56% | 66% | |
| Indianapolis, IN | 49% | 55% | |
| Milwaukee, WI | 53% | 57% | |
Tables 7 and 8 compare Detroit with other cities that are looking to redefine (or have already redefined) themselves as places where high-skilled workers will want to not only work but live. Before going over the results of the tables, let me provide a little background for each city. Pittsburgh is arguably the U.S. city most discussed as a model of economic transformation—it went from being a city reliant on steel manufacturing to one that is strongly associated with the higher education and health care industries. Through this transformation, Pittsburgh has also achieved a high quality of life for its residents. Cleveland has begun its efforts to mirror Pittsburgh’s downtown revival by implementing a rapid bus transit system; the hope is that this system will connect its University Circle neighborhood—a center of innovation and a place with young demographics—with other parts of the city. Birmingham has been referred to as the “Pittsburgh of the South” on account of the steel industry’s presence there. Despite the presence of some regional banks and universities, Alabama’s Jefferson County, whose county seat is Birmingham, is currently involved in bankruptcy proceedings. Baltimore famously made over its downtown with a new baseball stadium and a new football stadium, attracting people, especially young professionals, back to its Inner Harbor area. Buffalo is attracting young people back by developing residential and commercial areas around its downtown medical campuses.
Table 7 shows that shares of (employed) residents who were not working where they lived held fairly steady for the cities sampled between 2002 and 2011. In 2011, Pittsburgh remained the only city in the sample that saw a majority of its residents with jobs not commuting outside of the city. The other cities listed in Table 7 saw more of their respective employed residents leave the city limits to go to work in 2011. As these cities became more decentralized in the last quarter of the twentieth century, suburban job clusters were created that remain popular places in which to work and live.2 Detroit’s and Cleveland’s freeways are now lined with business centers, industrial parks, and suburban skyscrapers; such developments led to the creation of school districts that remain among the best in Michigan and Ohio, respectively.
Table 7. Percentage of working city residents who are not employed where they live
| Selected decentralized manufacturing cities, 2002 vs. 2011 | |||
| Year | 2002 | 2011 | |
| Detroit, MI | 60% | 62% | |
| Pittsburgh, PA | 42% | 44% | |
| Cleveland, OH | 53% | 53% | |
| Birmingham, AL | 46% | 53% | |
| Baltimore, MD | 52% | 54% | |
| Buffalo, NY | 50% | 55% | |
While each of these cities is seeing more of its work force commute from the suburbs (or farther afield), the recent pace of out-migration from Detroit to its suburbs becomes more evident in Table 8. Of the cities in Table 8, only Detroit and Birmingham have mass transit systems limited to traditional buses. Pittsburgh and Cleveland have recently expanded their mass transit systems, allowing more workers to commute into the city using light rail and rapid buses. The numbers in Table 8 may reflect the effect of years of population migration from the central cities to their respective suburbs.
Table 8. Percentage of city work force who do not live where they are employed
| Selected decentralized manufacturing cities, 2002 vs. 2011 | |||
| Year | 2002 | 2011 | |
| Detroit, MI | 58% | 72% | |
| Pittsburgh, PA | 71% | 75% | |
| Cleveland, OH | 68% | 75% | |
| Birmingham, AL | 75% | 78% | |
| Baltimore, MD | 59% | 66% | |
| Buffalo, NY | 63% | 70% | |
Conclusion
Detroit exhibits commuting inflow/outflow ratios that somewhat resemble those of other Seventh District and Rust Belt cities. Detroit’s ratios differ from other cities’ ratios mostly likely because of the following factors. The jobs found in the city of Detroit are more suitable for members of a high-skilled work force, who mostly live outside the city’s boundaries. Meanwhile, the population residing in the city of Detroit is mainly made up of low-skilled workers who must look outside the city limits for gainful employment. In all likelihood, Detroit residents will have a more difficult time finding gainful employment than residents of other decentralized manufacturing cities because of Detroit’s large geographical size and unreliable public transportation system.
If the city of Detroit were to see an increase in the percentage of its population both living and working within its boundaries, this would most likely come about because the city had diversified its economy and because it had become a more attractive place for young people to begin their careers—key achievements made by many other Rust Belt cities that have transformed themselves in recent years.
Footnotes
1 This estimate is based on my personal experience and my talks with other Michigan residents who commute to Detroit. Also, according to the U.S. Census Bureau’s OnTheMap tool, almost 700 people travel from Grand Rapids, Michigan, to Detroit for work—a one-way commute of two-and-a-half to three hours.
2 Decentralized manufacturing cities indicate cities where an urban population and the manufacturing industry have been largely redistributed to suburban areas.


