2013 Michigan Personal Income
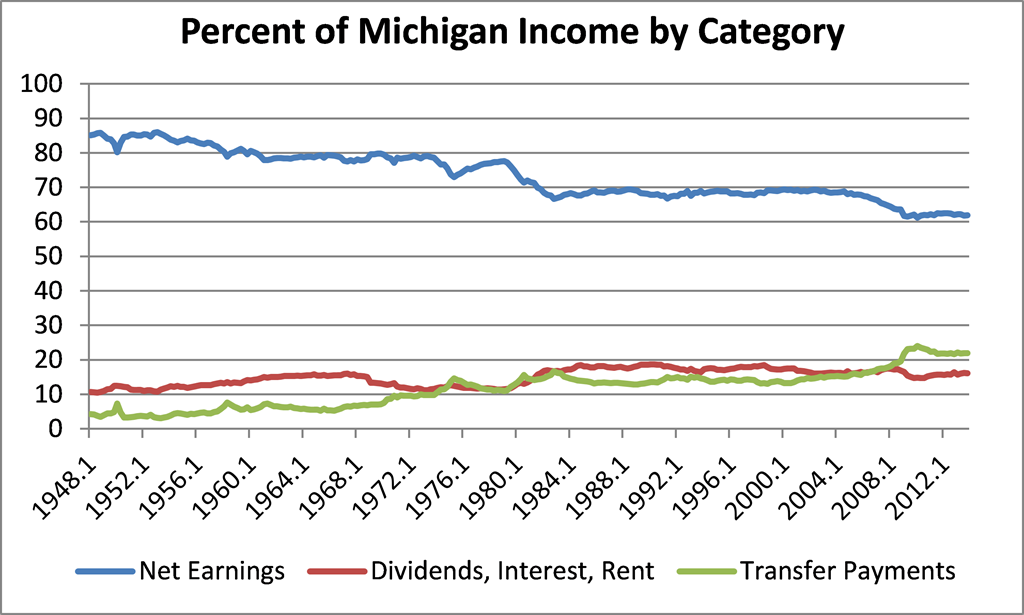
Income received by state residents remains an important and widely followed measure of economic progress.1 Personal income is income received from all sources (net of contributions to government social insurance programs, such as Social Security and Medicare).2 State personal income can be broken down into three categories: 1) net earnings by place of residence (e.g., wages and salaries)3; 2) dividends, interest, and rent; and 3) transfer payments (e.g., Social Security payments). As chart 1 shows, income received by Michiganders used to mainly come from net earnings, but the other two categories, especially transfer payments, have constituted a larger share of income in recent years, particularly after the Great Recession (which started at the very end of 2007 and concluded in mid-2009)4. After 2011 (when Michigan’s economic recovery started to accelerate), there has been little change in the composition of Michigan personal income.
Chart 1: Breakdown of Michigan personal income
Personal income growth in Michigan slowed for a second straight year in 2013: Personal income increased 3.5% in 2012 and 2.5% in 2013 after rising 5.5% in 2011.5 When deflated by the Detroit area Consumer Price Index (CPI), Michigan personal income grew 1.0% in 2013, decelerating from its 1.5% growth rate in the previous year. Michigan’s real disposable personal income growth also slowed in 2013: Real disposable income grew a scant 0.1% last year, compared with 1.1% in 2012.6
Michigan’s economy and its personal income reflected national trends in 2013: Somewhat lower growth in take-home pay for employees last year relative to 2012 and the resolution of the so-called fiscal cliff in January 2013 were largely responsible for the slowdown in personal income growth.7 With the exceptions of construction, finance and real estate, and health care, private nonfarm sectors saw slower growth in work earnings in 2013 than in 2012. When weighted by sector, manufacturing was the nonfarm sector that made the largest contribution (0.52 percentage points) to personal income growth in 2013. The government sector was the nonfarm sector that made the smallest contribution (–0.25 percentage points) to personal income growth last year; this occurred mainly because of changes in personal income growth for workers in state and local governments. In addition, changes to fiscal policies contributed to slower personal income growth in 2013. Specifically, the reinstitution of the federal payroll tax rate of 6.2% for personal contributions to Social Security (from 4.2%), as well as higher capital gains and dividend tax liabilities relative to 2012, helped temper personal income growth in 2013.
With respect to personal income growth, Michigan was in the middle of the pack among Seventh Federal Reserve District states in 2013, as table 1 shows; it was also close to the national value. Since 2010, both personal income growth and disposable personal income growth in Michigan were lower than the respective national values.8 With regard to disposable income, this trend may partly reflect fiscal policy changes that occurred in Michigan. Since 2010, Michigan has revised its tax code in multiple ways, including the application of state income taxes to retiree pensions, which has dampened disposable income growth.9
Table 1: Personal Income Growth, Seventh District and United States
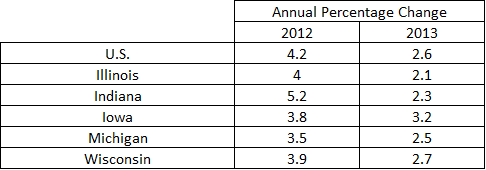
Table 2 shows Michigan comparing more favorably to the United States in terms of per capita personal income growth in 2013; but Michigan still ranks in the middle of the Seventh District by this measure.
During most of the 2000s, Michigan’s economic growth stagnated, and it fell into a one-state recession between 2003 and 2009. During the recession, per capita personal income growth slowed. In 2000 (when indexed), U.S. and Michigan per capita personal income were virtually equal. Over the period 2000–07 (before the Great Recession began), U.S. per capita personal income increased 31.2%, while Michigan per capita personal income increased 18.6%. However, over the period 2010–13, per capita personal income (as well as per capita disposable income) increased at a higher rate in Michigan than in the nation as whole.10 Michigan’s higher per capita income growth rates may be in part due to changes in its household employment and labor force participation rates. Both rates have been increasing more rapidly as of late.
Table 2: Per Capita Personal Income Growth, Seventh District and United States
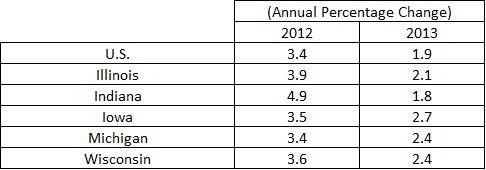
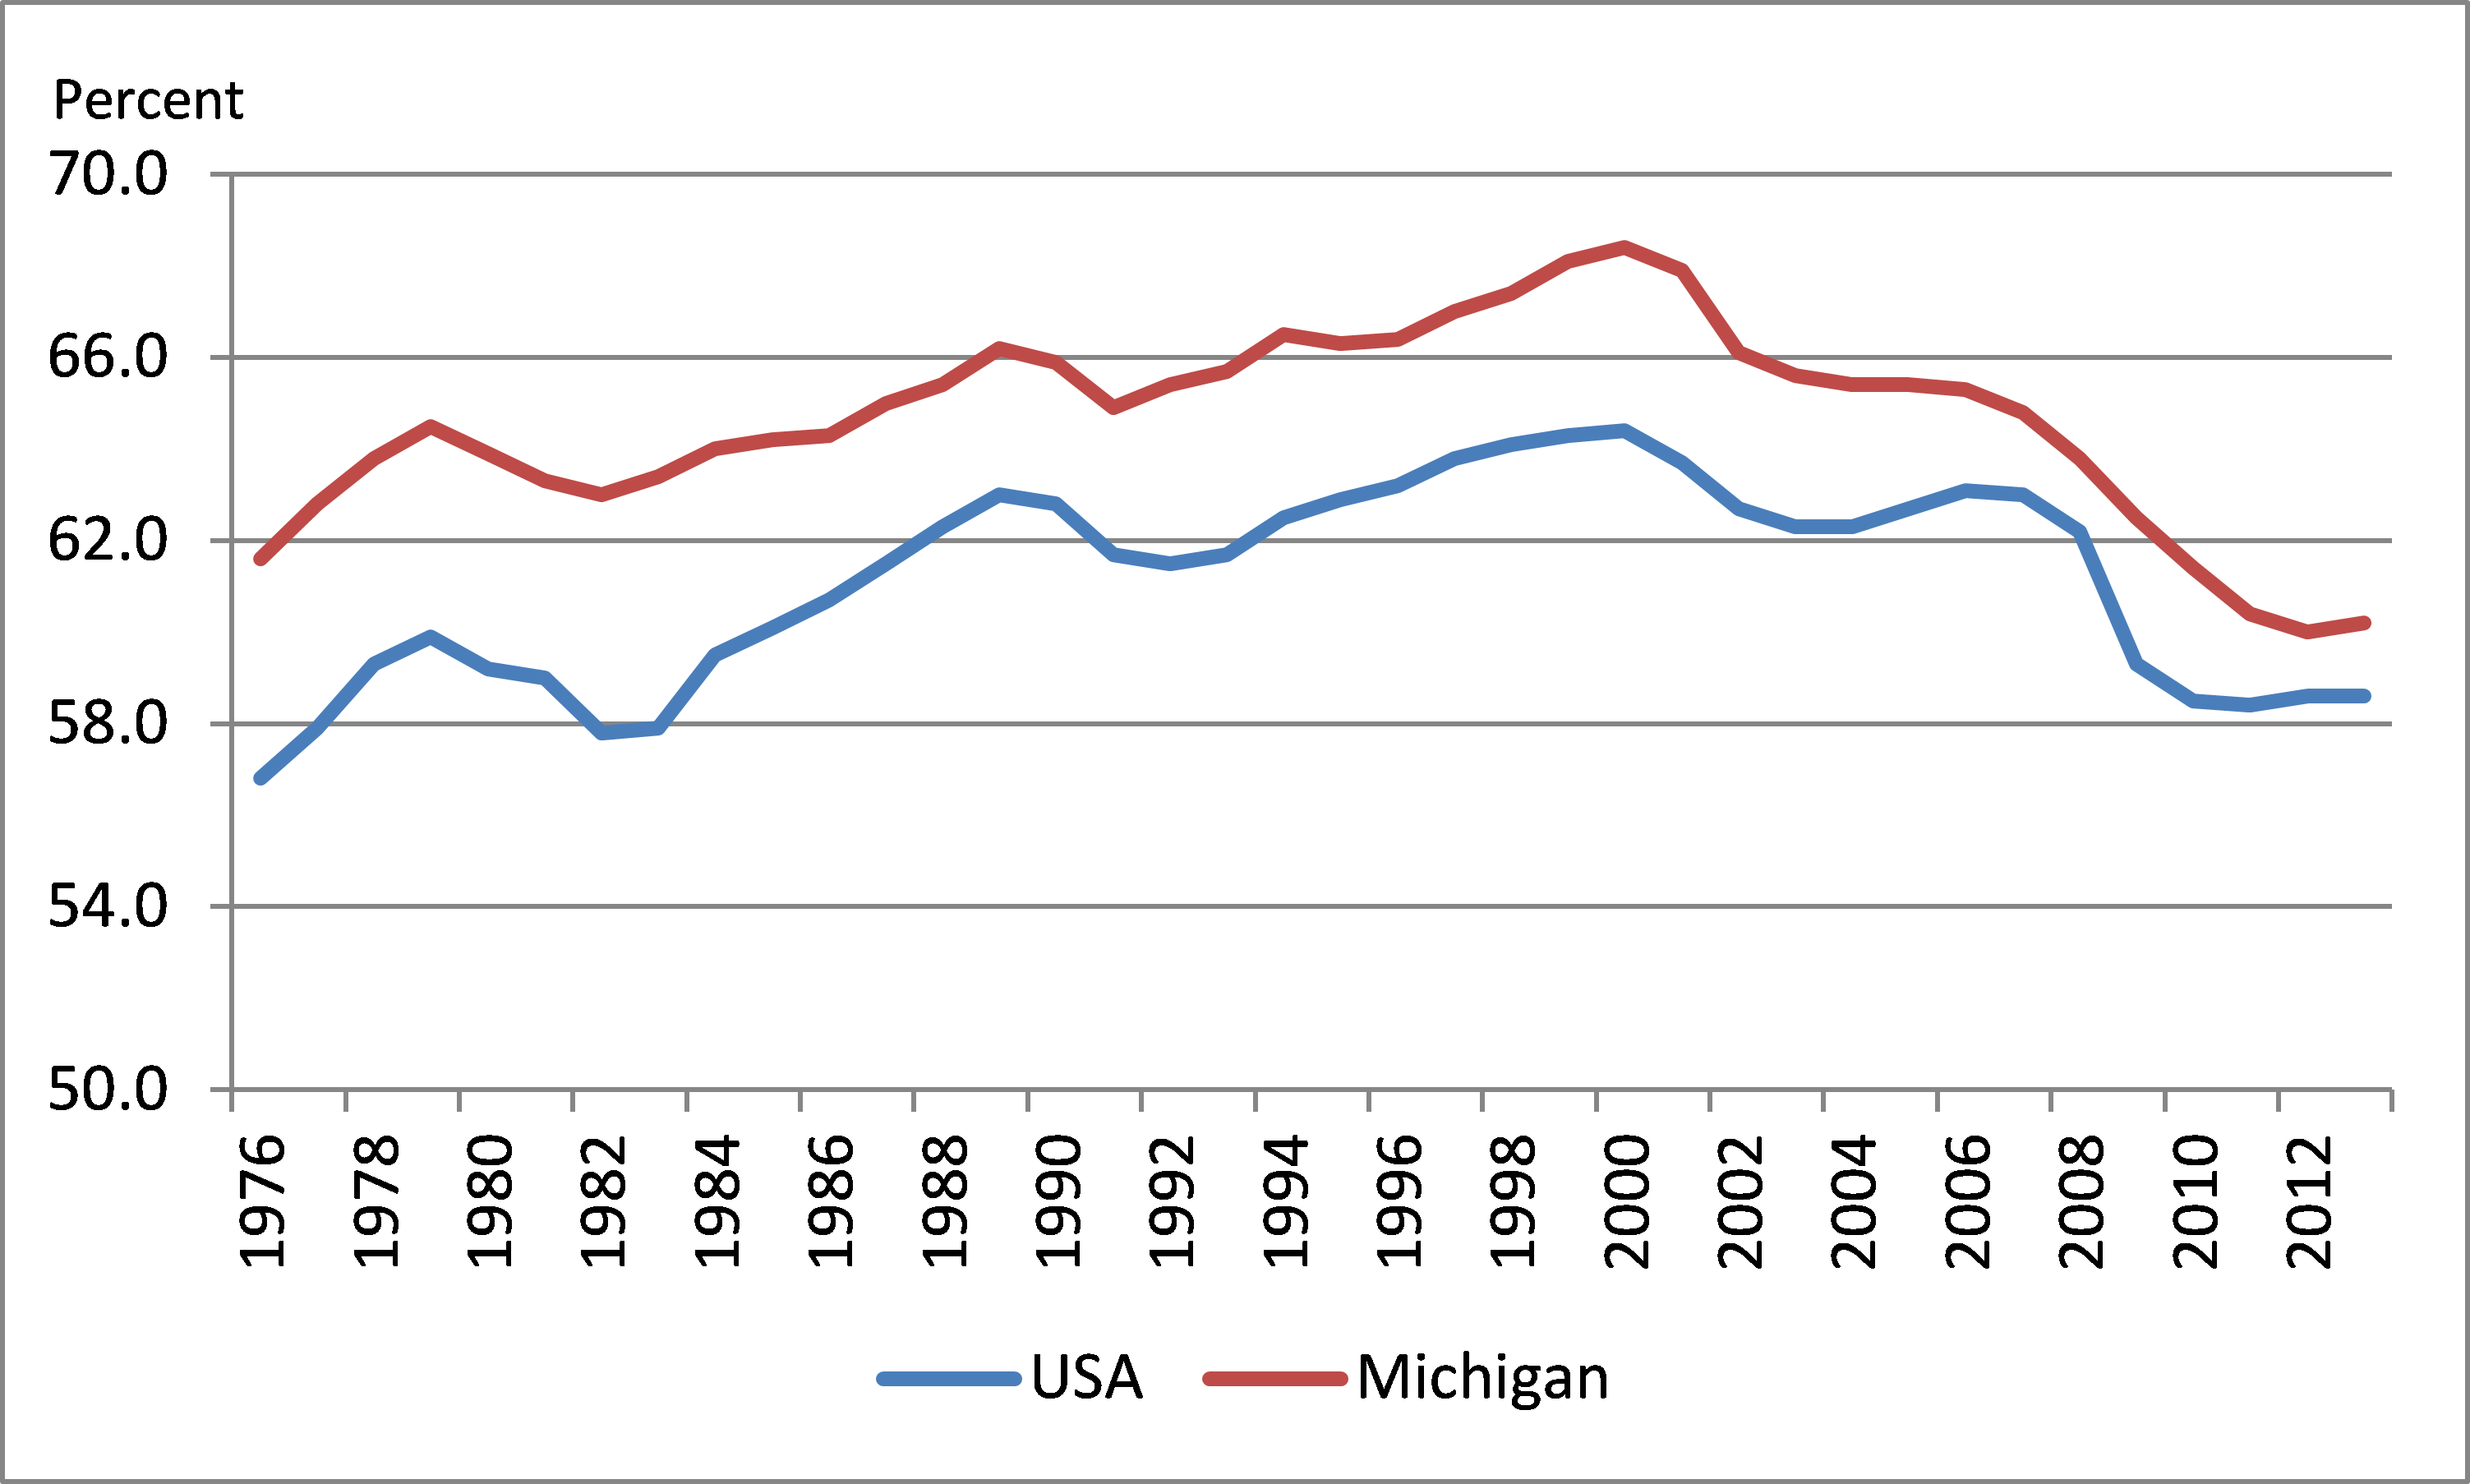
Chart 2 shows what percentage of the working-age population in the United States and Michigan was employed from 1976 through 2013. The ratios of employment to working-age population in the nation and Michigan fell during the Great Recession and slightly rebounded in the last couple of years. But Michigan’s ratio of employment to working-age population fell more sharply over the past decade (despite the state having lost population) and is now below its all-time low. After losing population during the 2000s, Michigan’s population grew an estimated 0.1% since 2010.11 Meanwhile, the U.S. population has grown an estimated 0.8%.
Chart 2: Employment-to-Working-Age-Population Ratio: United States and Michigan
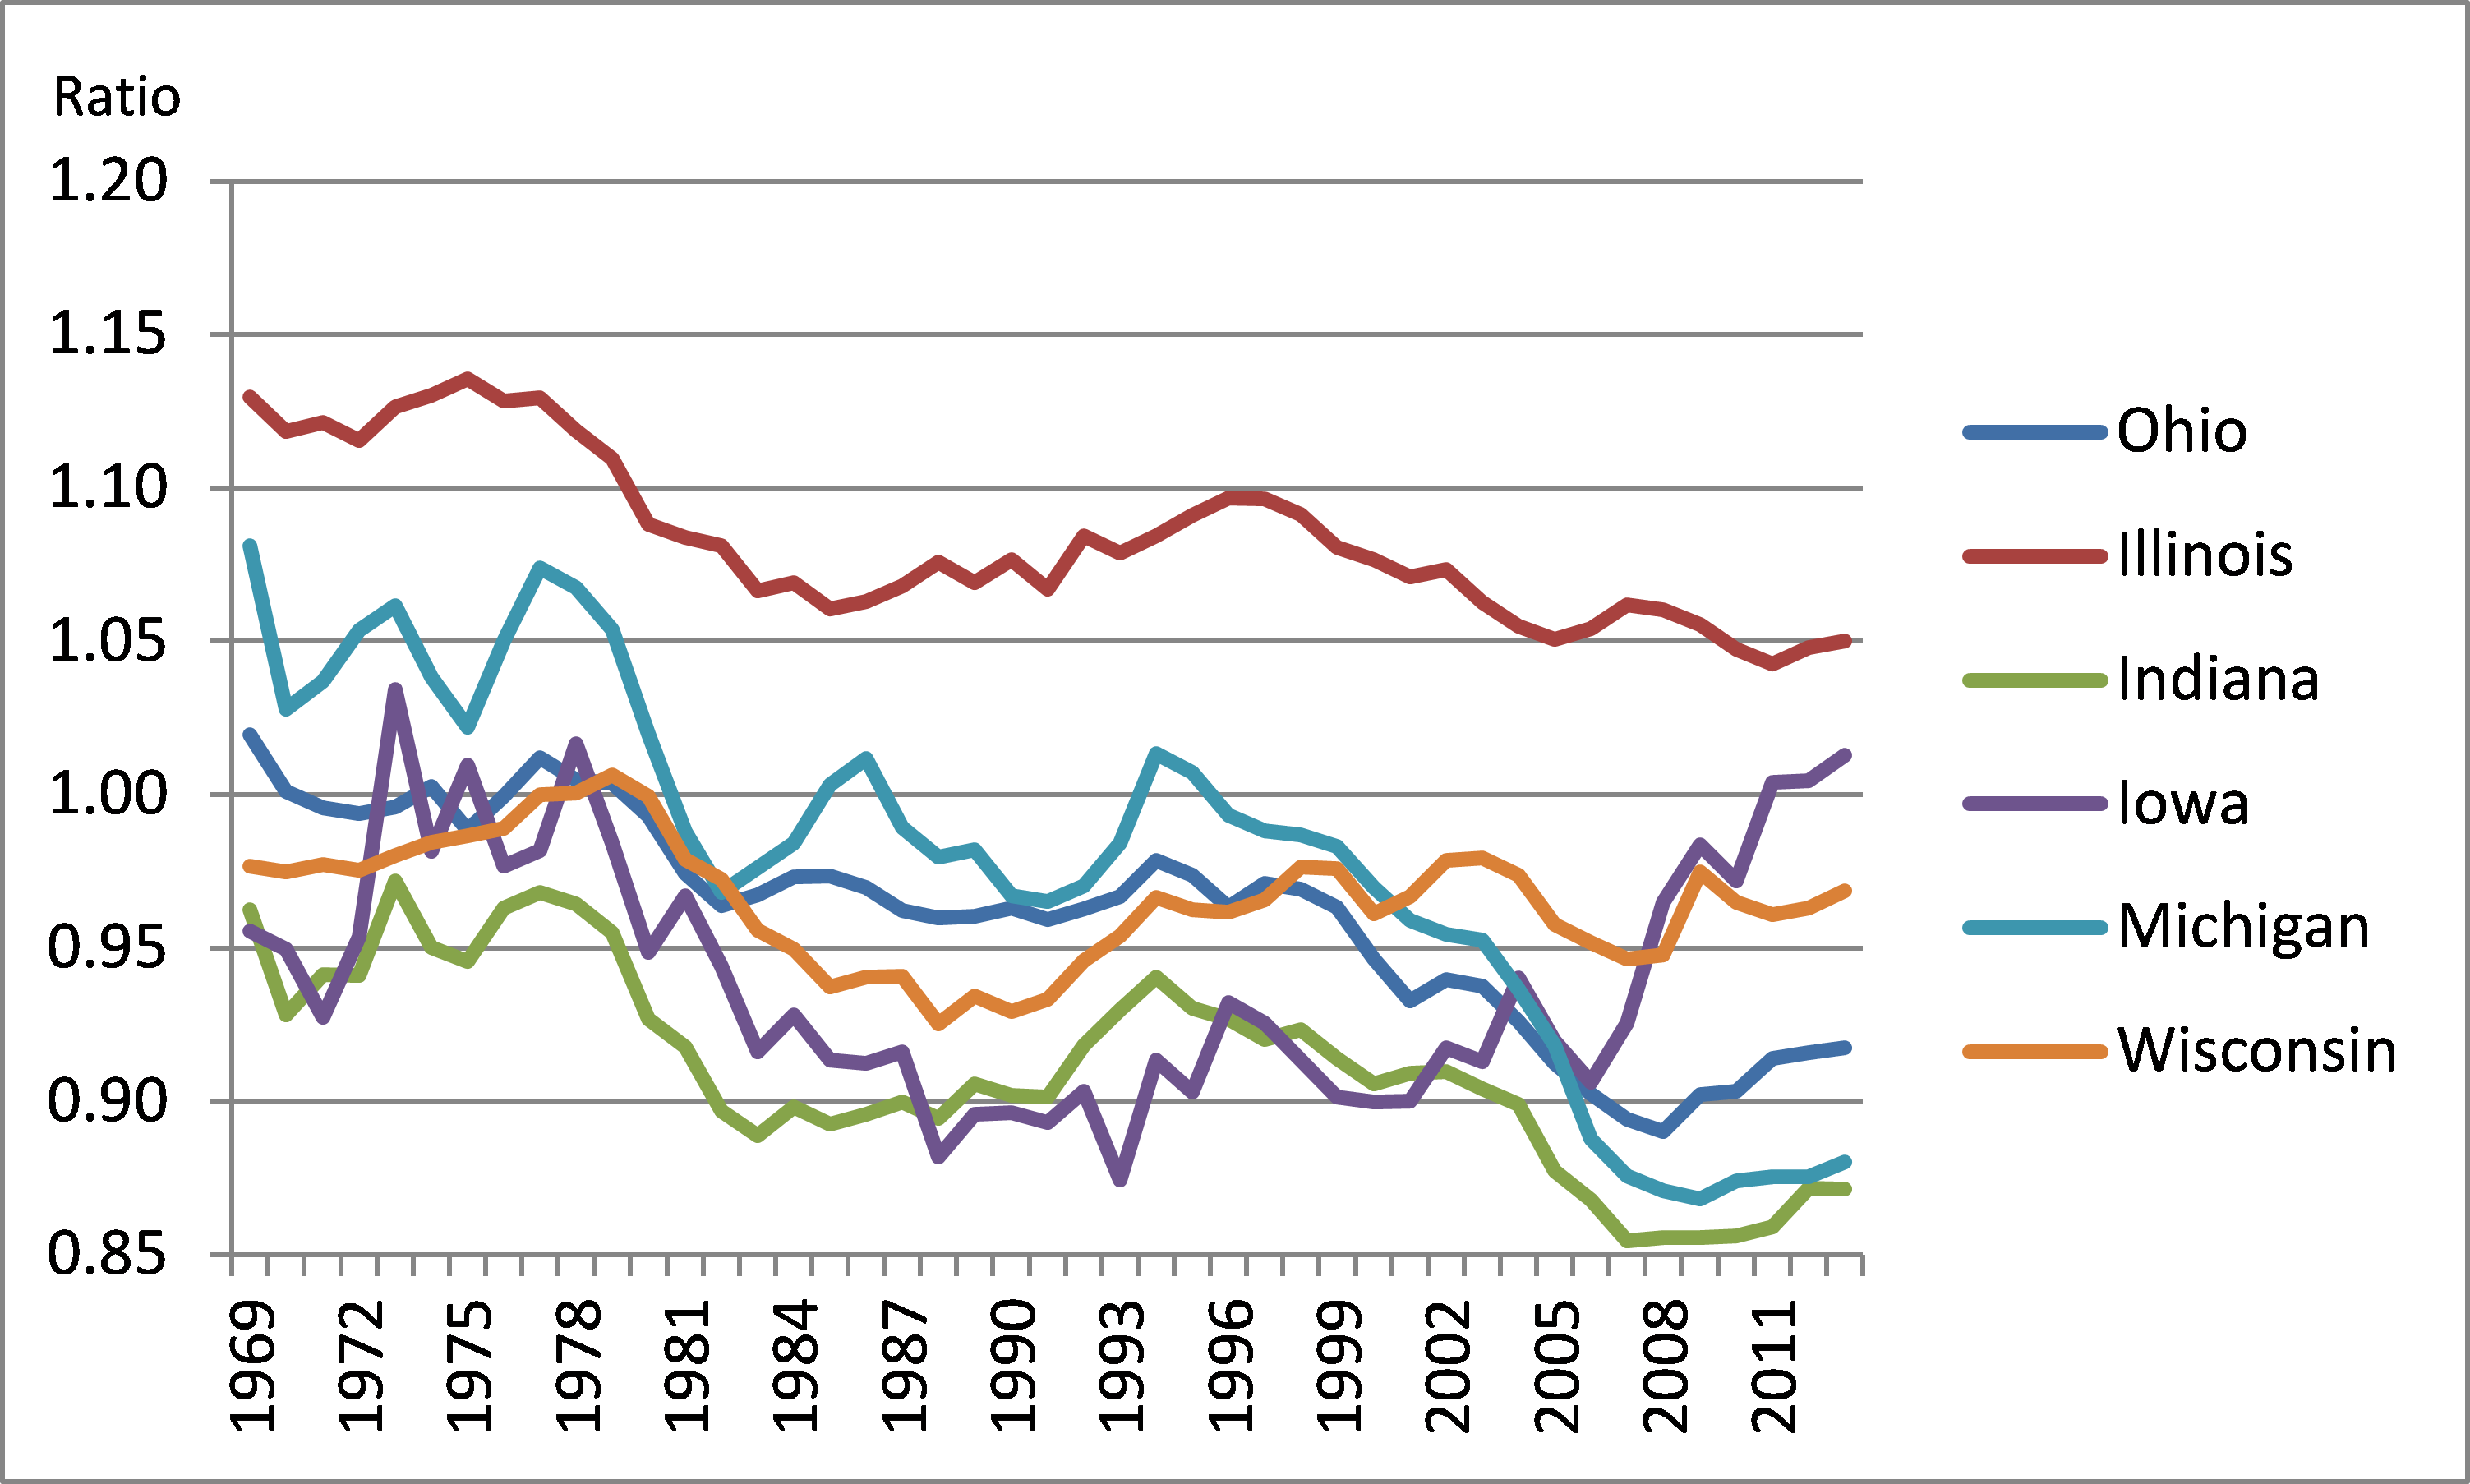
When looking at changes in per capita personal income over the past 45 years, one can see how much the United States and the Seventh District have outpaced Michigan. Until 2001, only Illinois was higher than Michigan in terms of its per capita personal income relative to the nation’s (see chart 3). Michigan’s one-state recession during the 2000s becomes evident in chart 3, when its relative measure of per capita personal income diverges from those of other Seventh District states (except Indiana’s). During the 2000s, the income disparity between Michigan and the rest of the country grew quite a bit. This may have been due in part to “brain drain” from Michigan. Research from the Cleveland Fed has found that a state’s knowledge stock—which is composed of the number of patents issued and the number of high school and college graduates—is the main factor explaining a state’s relative per capita personal income over long periods of time.12 Since the end of the Great Recession, it appears Michigan’s per capita personal income growth is at least equal to, if not slightly greater than, those of the Seventh District states and the nation as a whole, but this growth hasn’t resulted in a return to parity with most of them as chart 3 shows.
Chart 3: Per Capita Personal Income Relative to the United States’: Michigan and Other Seventh District States
As mentioned before, transfer payments have made up a large share of Michigan personal income growth lately. Indeed, transfer payments have played an important role in lifting income levels in Michigan in recent years. But that has come with a price: Michigan’s Unemployment Insurance Trust Fund has fallen into the red. Consequently, Michigan has taken on loans from the federal government and suffered reductions in Federal Unemployment Trust Act (FUTA) tax credits.13 In addition, Michigan employers are in the process of paying off revenue bonds (issued to pay off Unemployment Insurance Trust Fund liabilities); the bonds are held by the federal government. Such liabilities likely reflect future drains on personal income to Michigan residents as the trust fund is replenished from payroll taxes. In response to stress on the trust fund, the state made other changes to its unemployment insurance program, including cutting unemployment benefits to 20 weeks from 26 weeks in 2011.14 Because employers are paying off revenue bonds, Michiganders face not only the loss of potential income but also potential income growth.
Conclusion
Michigan’s one-state recession in the 2000s lowered employment and employment participation, thereby slowing its per capita personal income growth. In regard to state per capita personal income growth relative to that of the nation’s, Michigan has now reached a point where it has clearly fallen behind most of its Seventh District neighbors. As the national economy continues to recover from the Great Recession, we can ask whether Michigan has now returned to personal income growth rates of the past for the foreseeable future. The answer is yes, but this may not be good enough. Despite the noteworthy amount of positive economic news coming from Michigan since the end of the recession (including the auto industry’s resurgence), its personal income growth has, at best, matched the long-term trend for personal income growth in the United States. At this pace, the Michigan economy is vulnerable in losing further ground during the next national downturn.
Footnotes
1 Variations in personal income growth between states can stem from differences in the fortunes of the local industries that are sharply concentrated within each. For example, while analyzing fluctuations in payroll by industry sector, I note that manufacturing is to Michigan as mining is to Montana or as retail trade is to Nevada.
2 Personal income is typically not adjusted for inflation.
3 Net earnings by place of residence = Earnings by place of work – Personal contributions for government social insurance + Adjustment to convert earnings from a place-of-work basis to a place-of-residence basis.
4 Another reason transfer payments now constitute a higher percentage of personal income is new retirees receiving Social Security.
5 State personal income growth figures for the year’s previous quarters are normally revised with each new quarterly data release from the U.S. Bureau of Economic Analysis (BEA). Benchmark revisions for personal income are usually done shortly after with other BEA benchmark revisions.
6 Real disposable personal income is after-tax, inflation-adjusted income.
7 The fiscal cliff was a combination of expiring tax cuts and across-the-board government spending cuts that were scheduled to become effective on the final day of 2012. More information is available here.
8 In 2010–13, annualized personal income growth for the United States and Michigan was 4.3% and 3.8%, respectively. Over the same period, annualized disposable income growth for the United States and Michigan was 3.4% and 2.9%, respectively.
9 More information is available online.
10 In 2010–13, annualized per capita income growth for Michigan and the United States was 3.8% and 3.5%, respectively. Over the same period, annualized per capita disposable income growth for Michigan and the United States was 2.9% and 2.7%, respectively.
11 Since 1978, there is a positive, yet somewhat weak, correlation (0.35) between Michigan real gross state product (GSP) growth and population growth.
12 More information available online.
13 More information available online.
14 Ibid.


