Michigan Home Price Update
A recently released home price index1 suggests that the trend of climbing Michigan home prices continues. According to the latest FHFA Home Price Index (HPI) release looking at updated home transactions through the third quarter of 2014, home prices continued to grow at a faster rate in Michigan than in the U.S. and Seventh District2.
Chart 1: Year-over-year Percentage Change in FHFA All-Transaction HPI: Michigan, U.S., Seventh District3, 2007-present
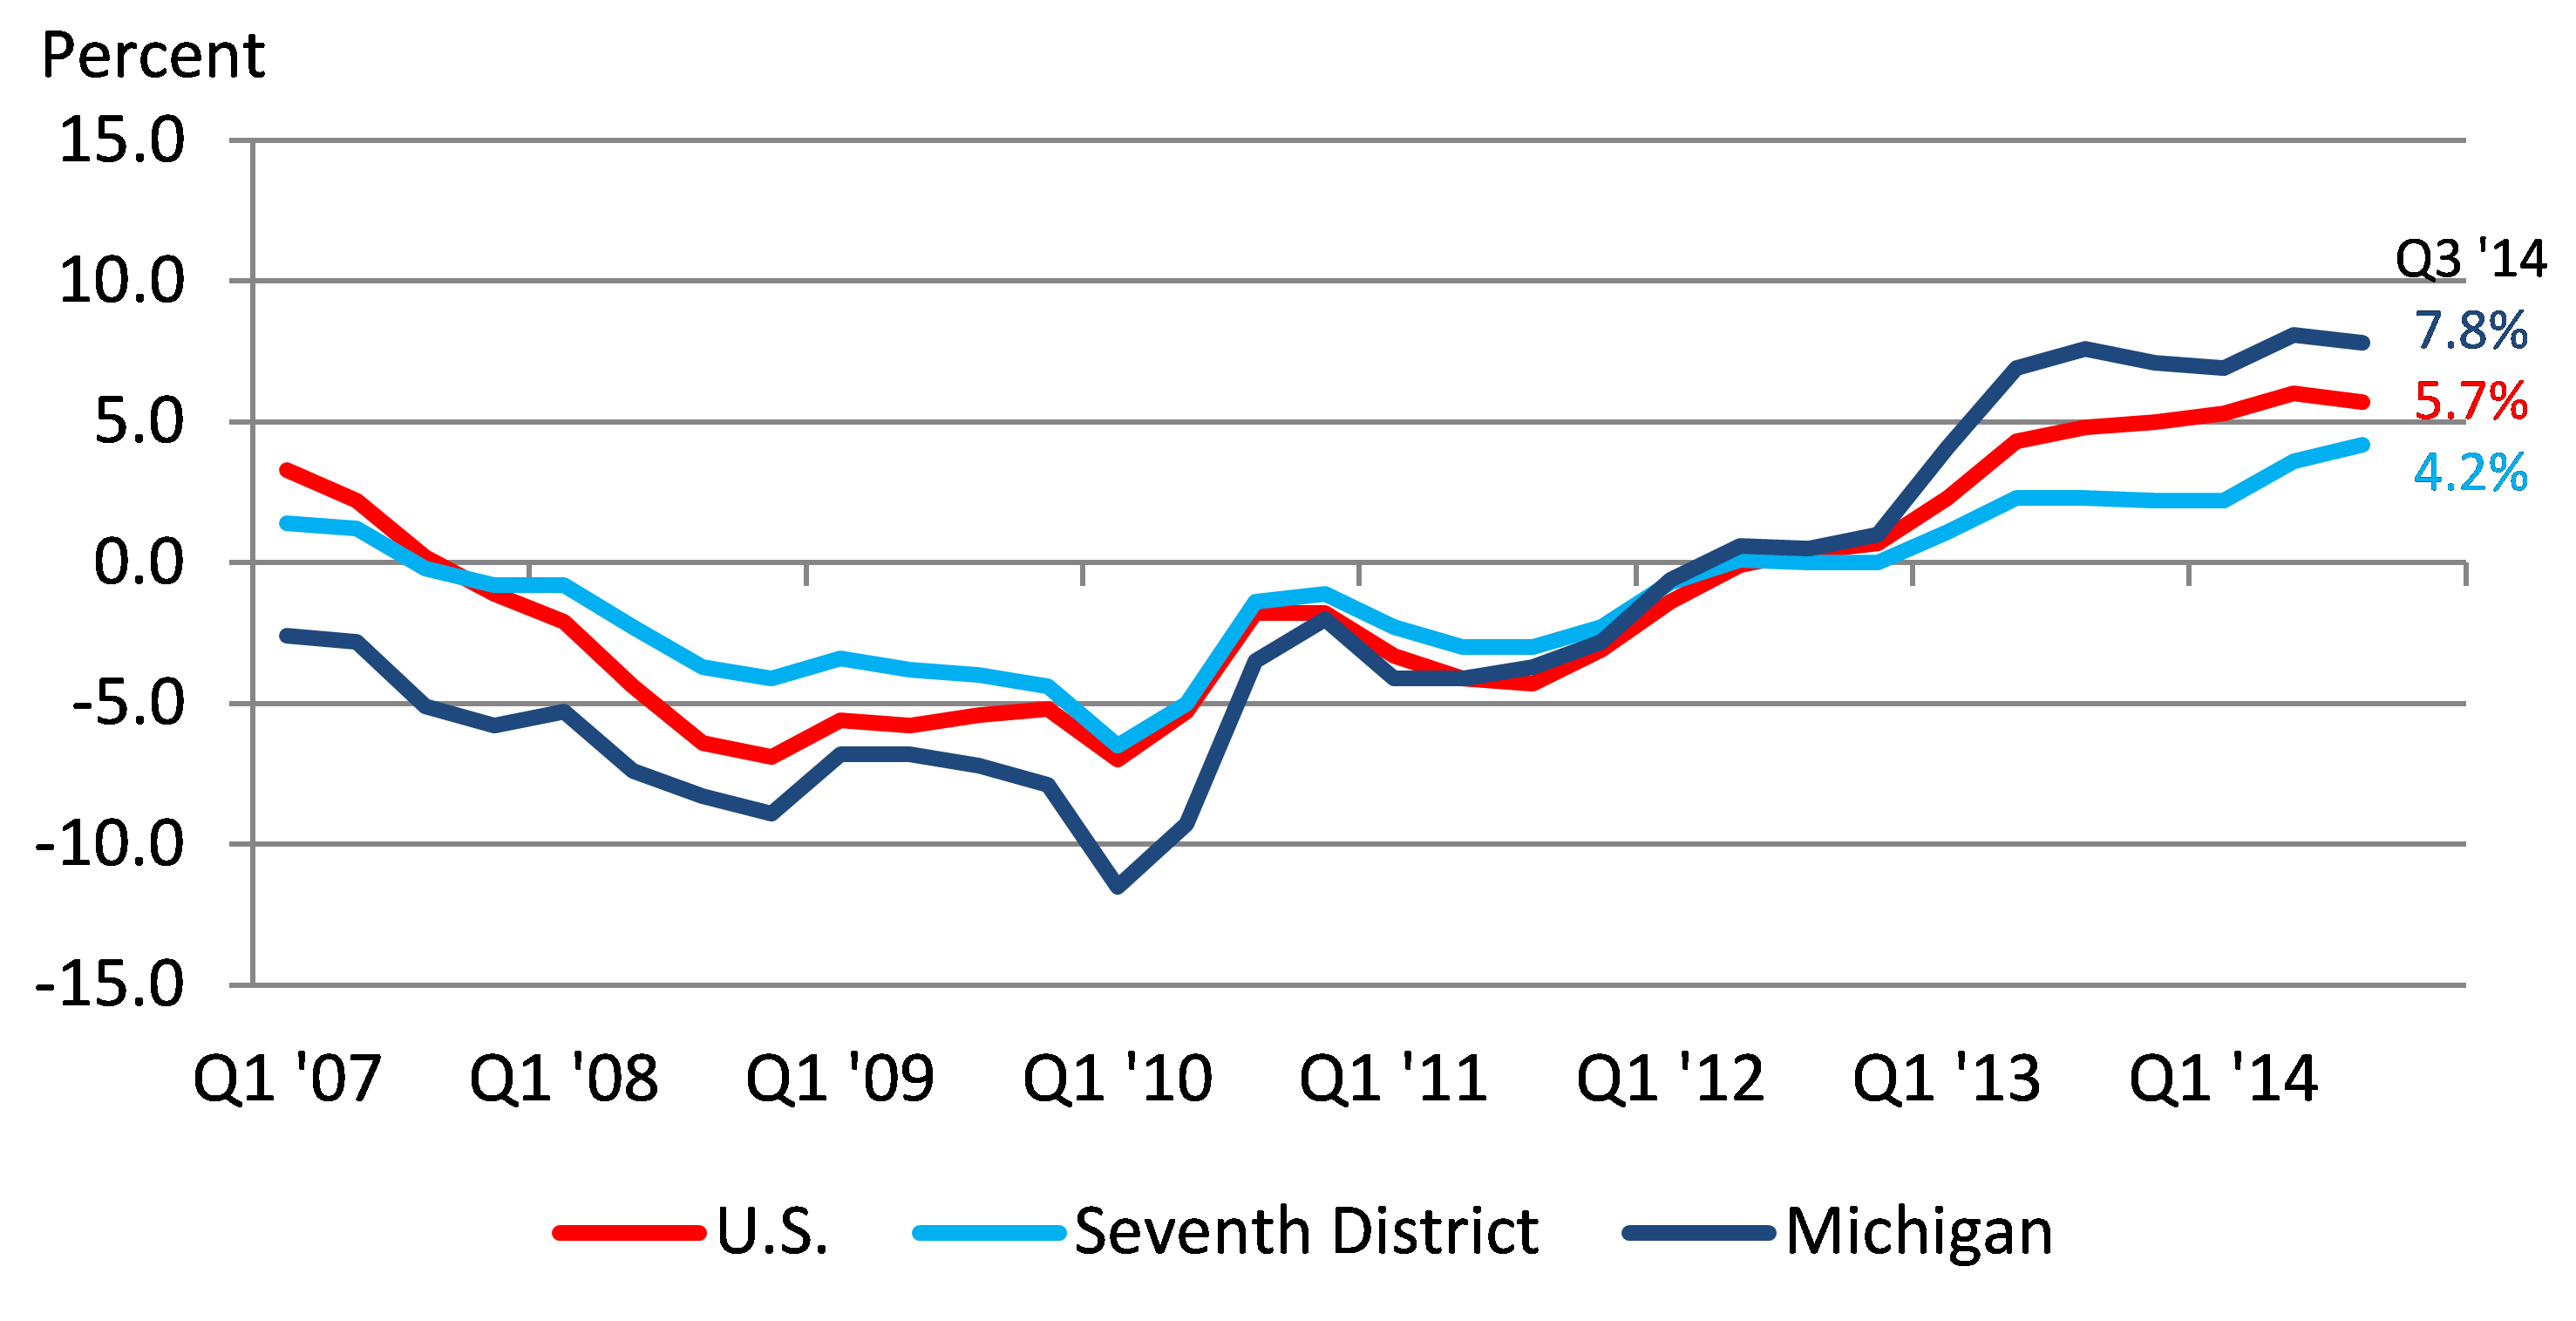
Chart 1 shows that Michigan home values are about 8% higher than last year. Home values also appear to have appreciated at a slightly faster rate in 2014 than last year. The same holds true in the U.S., with home values about 6% higher than last year. However, as was the case in Michigan, the national rate of home value appreciation appears to have slowed slightly between the second and third quarters of this year. In the Seventh District, home values are about 4% higher than last year and have continued to appreciate at a faster rate than last year.
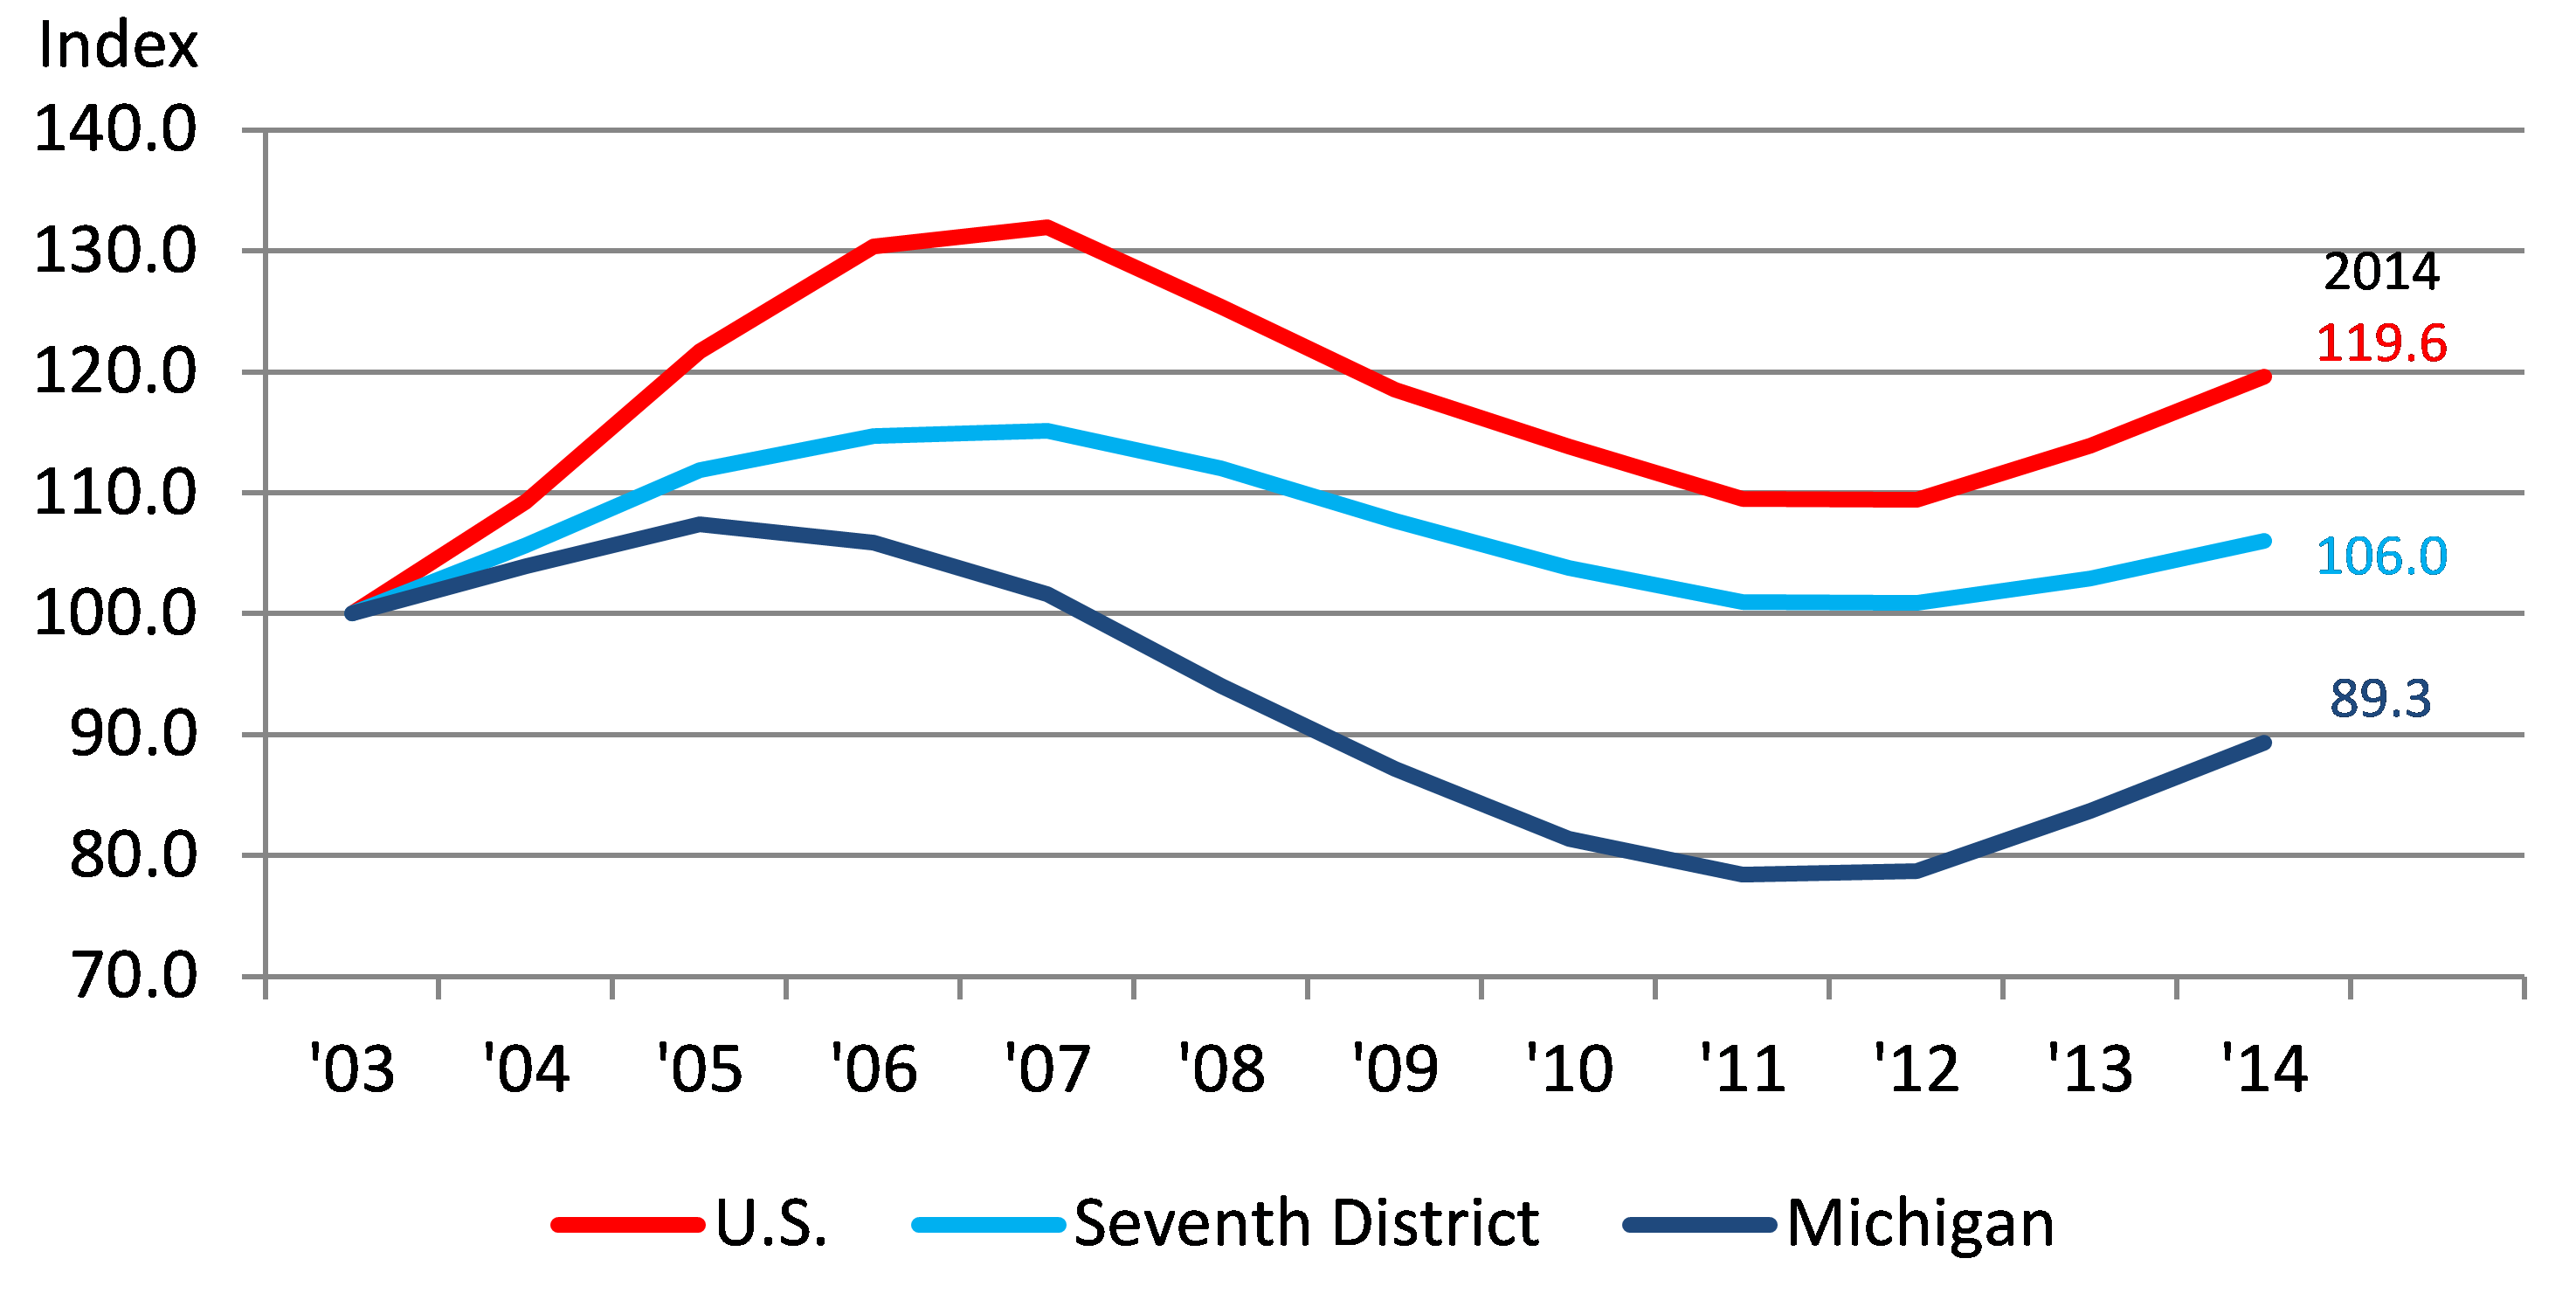
As chart 1 shows, home values in the U.S., Seventh District, and Michigan have increased year-over-year since 2012. However, not all regions have attained pre-recession HPI levels. Based on the most recent HPI data, U.S. home values overall are 8.5% below their pre-recession HPI peak, while prices in the Seventh District are 7.0% below their pre-recession HPI peak. Michigan’s gap between current and pre-recession HPI levels is 15.2%4. Chart 2 shows the larger gap Michigan faces relative to the U.S. and Seventh District. On the positive side, those who have purchased homes in Michigan following the financial crisis could stand to realize significant gains in home value if Michigan home prices ever return to their previous peak.
Chart 2: Annual FHFA All-Transaction HPI Index levels, 2003=100: Michigan, U.S., Seventh District5, 2003-present6
Footnotes
1 The Federal Housing Finance Agency (FHFA) publishes an all-transaction House Price Index (HPI), based on transactions involving conforming, conventional mortgages purchased or securitized by Fannie Mae or Freddie Mac. The HPI is a weighted sales index that tracks average price changes on sales or refinancing of mortgages purchased or securitized by Fannie Mae or Freddie Mac since January 1975. The all-transaction HPI, published quarterly, includes prices from appraisal data obtained from Fannie Mae or Freddie Mac. It examines national, state, and metropolitan statistical area (MSA) data that is not seasonally adjusted.
2 The Seventh Federal Reserve District comprises all of Iowa and most of Illinois, Indiana, Michigan, and Wisconsin.
3 The Seventh District HPI was calculated by averaging each member state’s respective HPI.
4 Michigan’s all-transaction HPI peak came in the third quarter of 2005, while the U.S. and Midwest both hit their peak levels in the first quarter of 2007.
5 The Seventh District HPI was calculated by averaging the member states’ HPIs.
6 The annual averages were calculated by averaging the regions’ quarterly levels.


