The Impact of the Changing Structure of Employment on Wages in Michigan
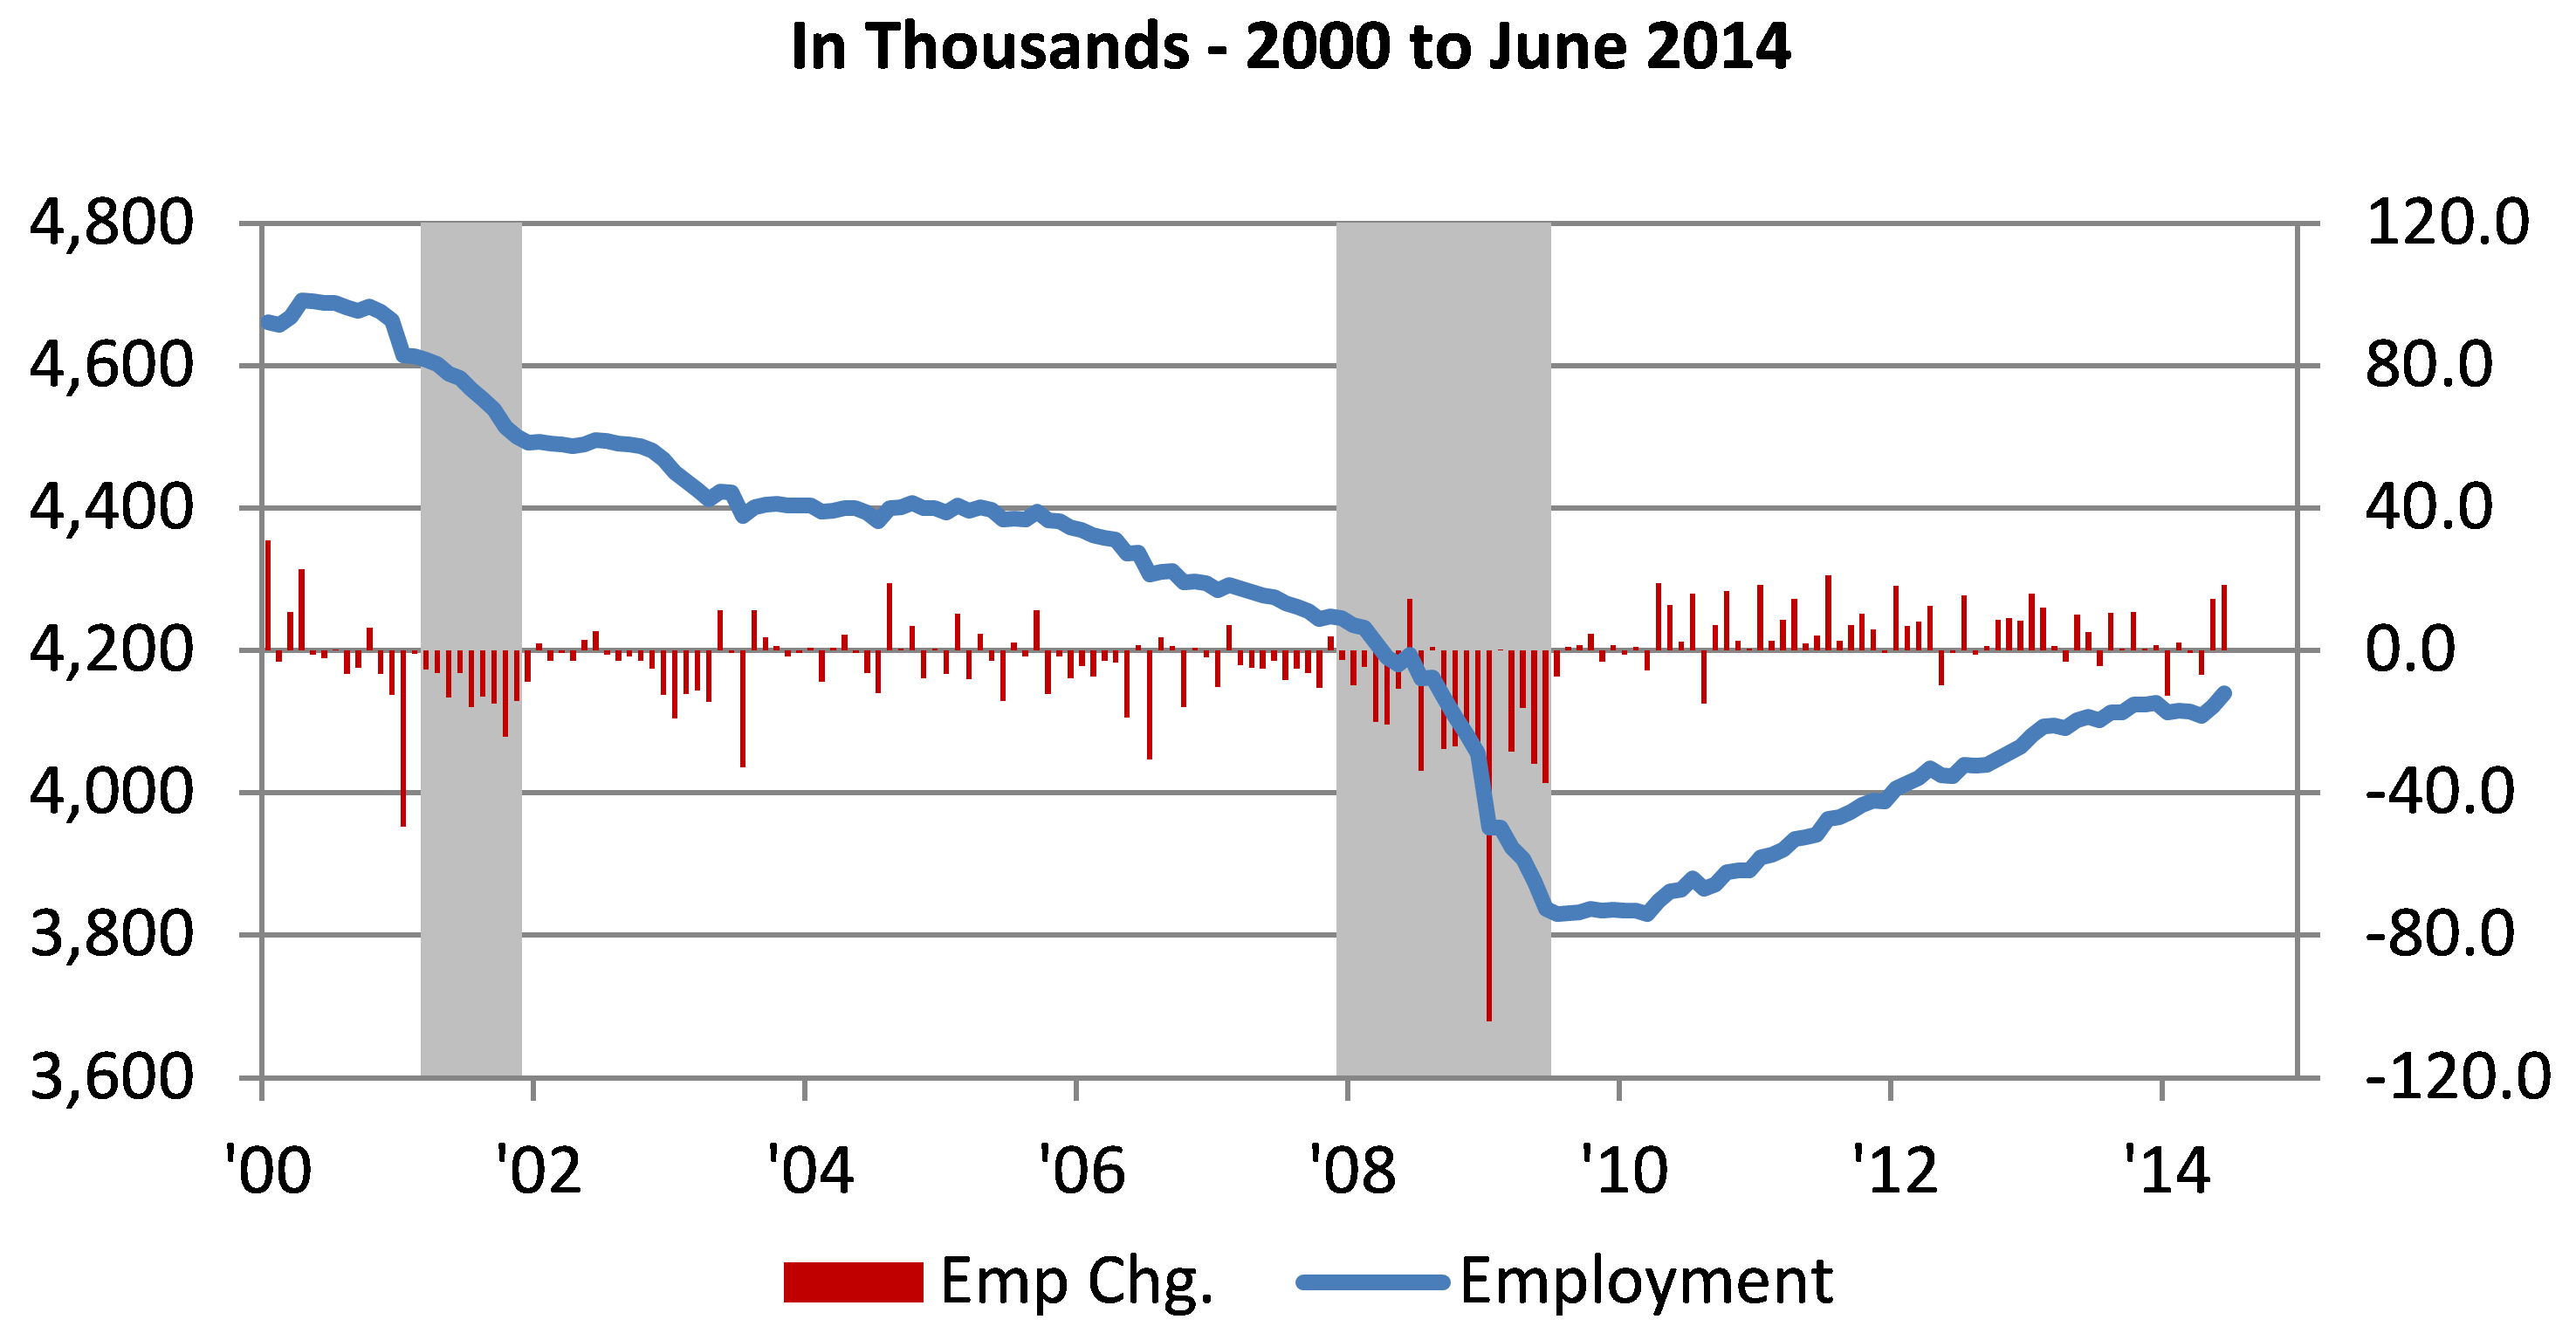
As of June 2014, total nonfarm employment for the U.S. is reported to be greater than its January 2008 peak by 430,000 jobs. In contrast, according to the most recent data from the U.S. Department of Labor’s Bureau of Labor Statistics, Michigan nonfarm employment as of June 2014 is still down by 550,800 jobs or 11.7% from its previous peak of April 2000 (Chart 1). In addition, since the start of the last recession, Michigan nonfarm employment is still down 105,300 jobs or 2.5%.
Chart 1. Michigan Nonfarm employment
It is important to note that since bottoming in 2010, Michigan’s job growth has outperformed the nation’s on a percentage basis, growing by 8.1% versus 7.0% for the nation. However, Michigan’s job growth since 2010 has been concentrated in nontraditional industry sectors, leading to a significant change in Michigan’s employment structure. In addition to this change in employment structure by industry, Michigan’s average weekly wage, once higher than the nation’s, has fallen below the national average (Chart 2). At $844 per week, Michigan’s average real wage in 2013 is about equal to what it was in 1999, with much of the lack of wage growth being attributed to the change in employment structure by industry sector and associated wages. This blog explores the change in Michigan’s employment structure and its impact on Michigan’s average weekly wage over the past 15 years.
Chart 2. Real average weekly wage
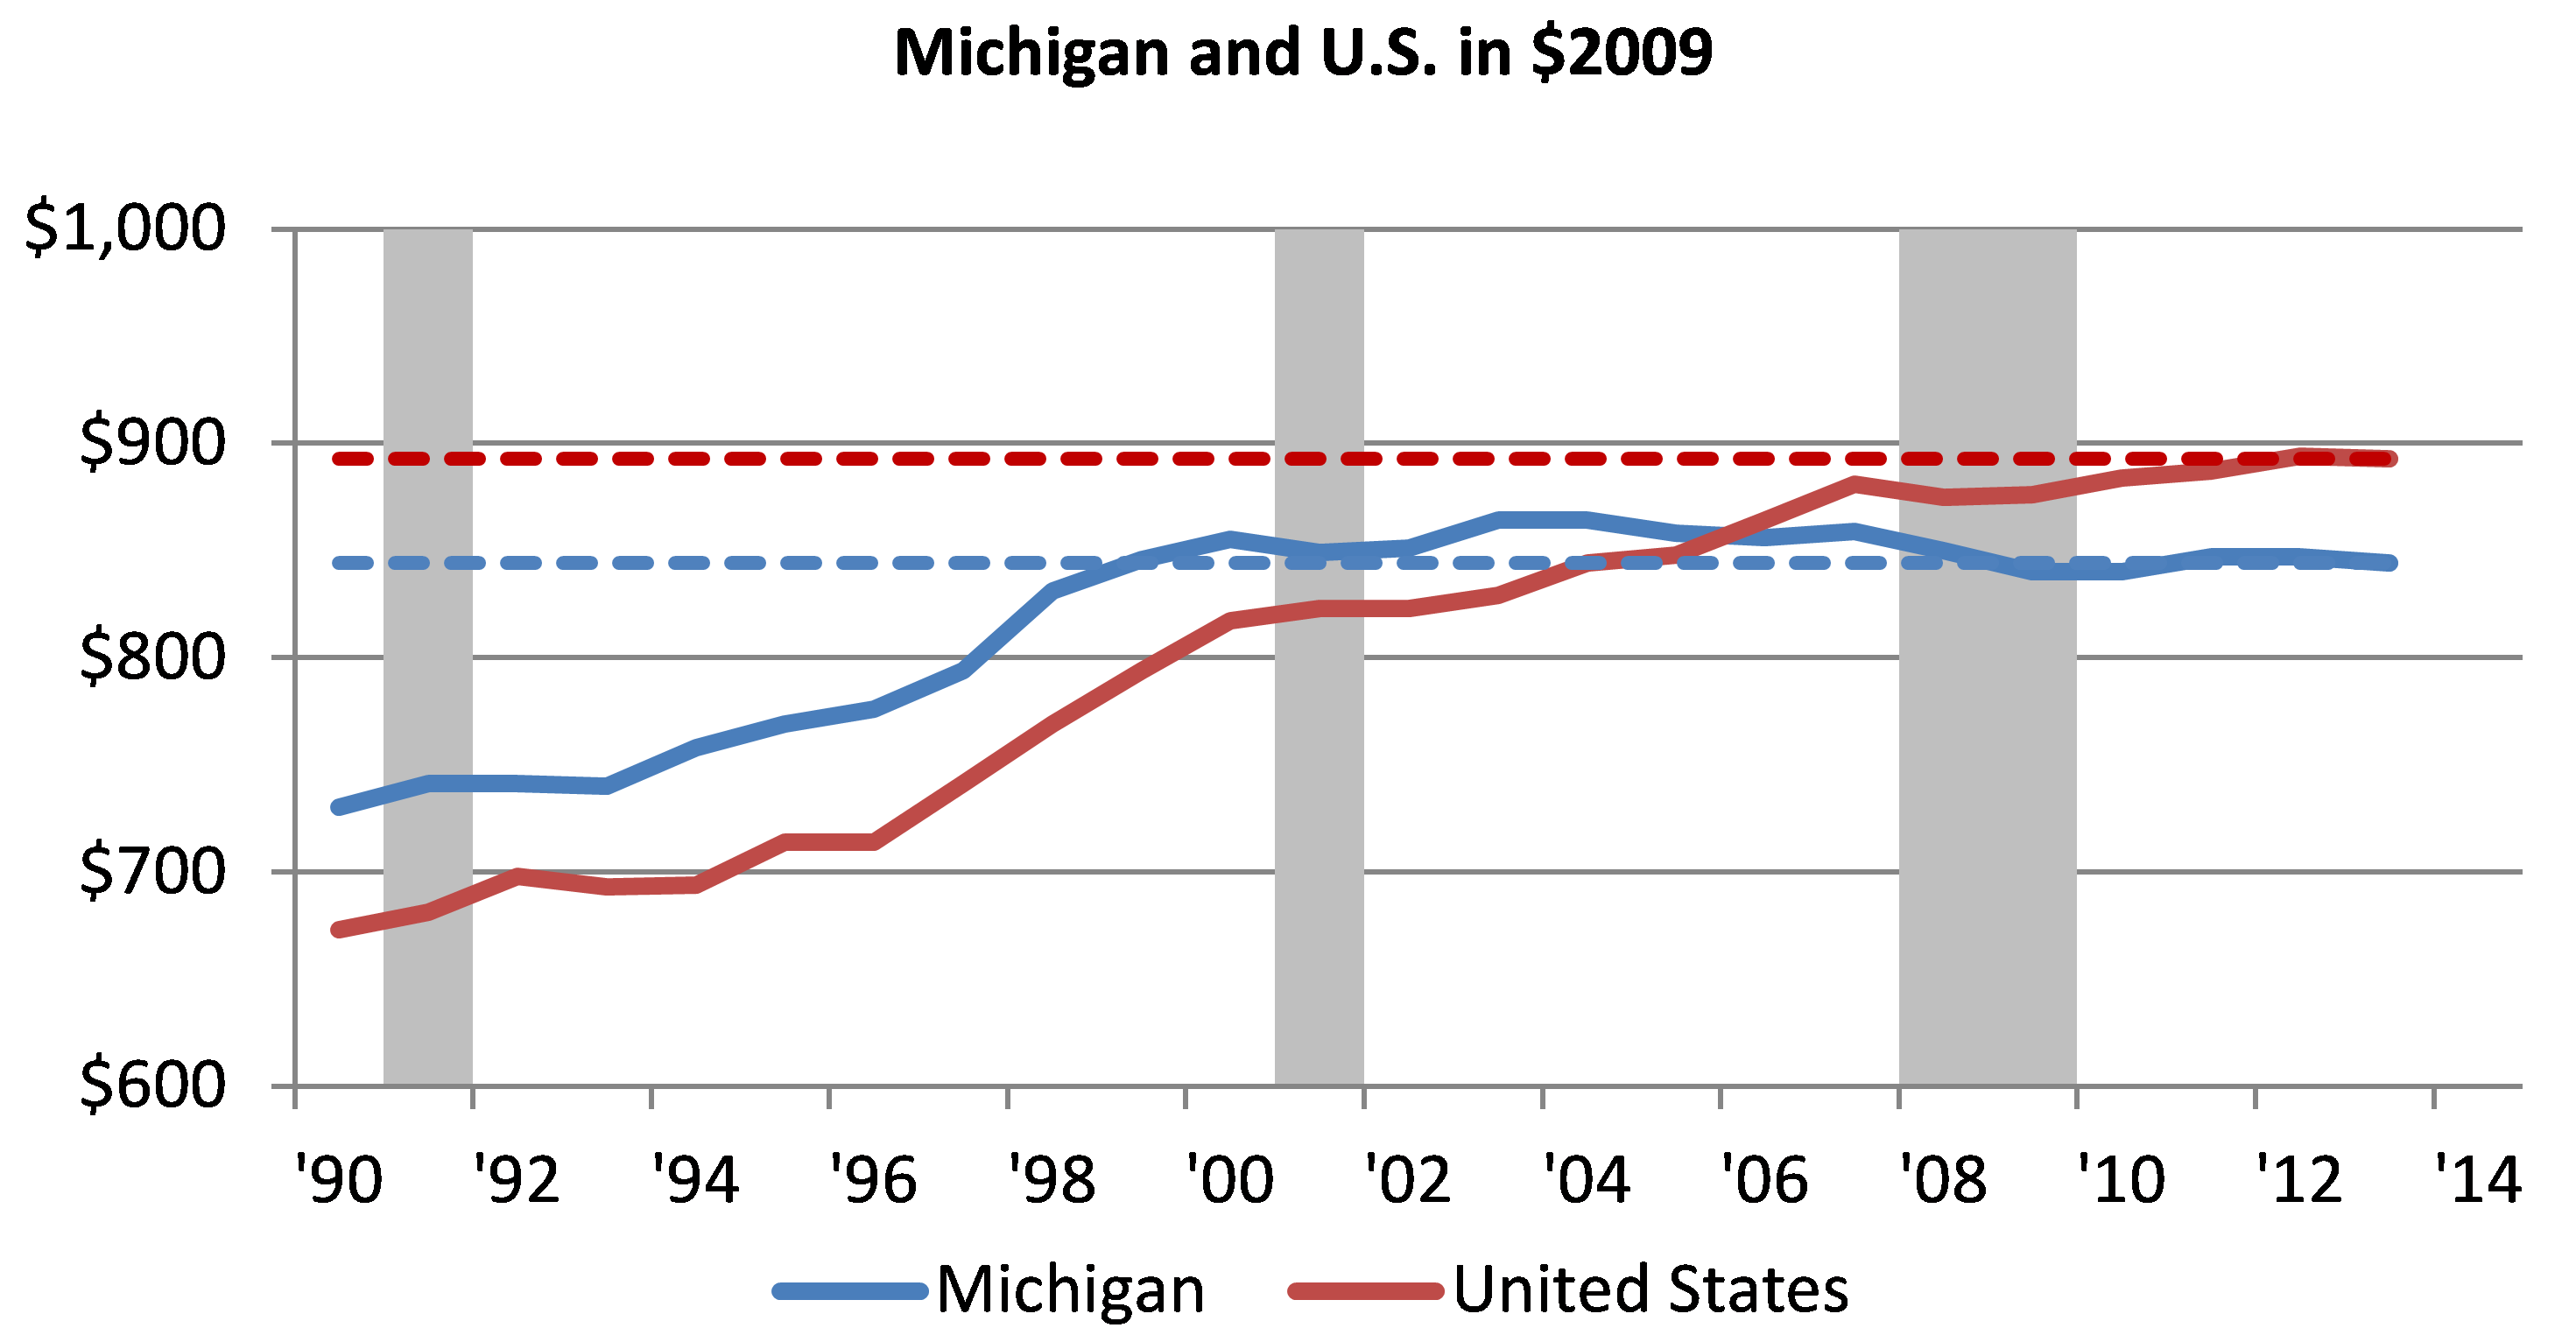
Although job growth in Michigan has outperformed that of the nation as a whole since 2010, according to the data in Chart 2 wages in Michigan haven’t kept pace. In fact, Michigan’s positive wage gap disappeared in 2006 and has continued to turn more negative since then. Michigan’s strong job growth since 2010 started from a much lower base than any of the other states. Total U.S. nonfarm employment reached an all-time peak of 134.4 million jobs in January 2008 then fell by 6.3% to 129.7 million jobs by February 2010. However, Michigan’s employment difficulties started almost eight years earlier, just prior to the 2001 recession. Michigan’s nonfarm employment peaked in April 2000 at 4.7 million jobs, before starting to trend downward and finally leveling off in 2010. During the almost ten years of employment decline, Michigan nonfarm employment fell by 18.4 % or 861.6 thousand jobs, the biggest loss of any state in the nation. In addition, as of June 2014, Michigan’s nonfarm employment remains 11.7% below its previous peak, which gives Michigan the distinction of having the largest employment gap, defined here as current employment below a previous peak, of any state in the country. In fact, the next largest employment gap is only about half that of Michigan at 5.9% for both Nevada and Ohio.
Chart 3 shows the current percentage change in Michigan’s total nonfarm employment by major industry sector since 2000, when Michigan’s employment started its gradual decline. The two sectors that have performed the best for Michigan since the start of the recovery are leisure and hospitality and education and health services. It should be noted here that education and health services employment did not fall noticeably during the 2008 recession and, therefore, it is the only sector in Michigan that has actually sustained a positive trend of job creation since the 1990s.
Chart 3. Michigan employment by sector
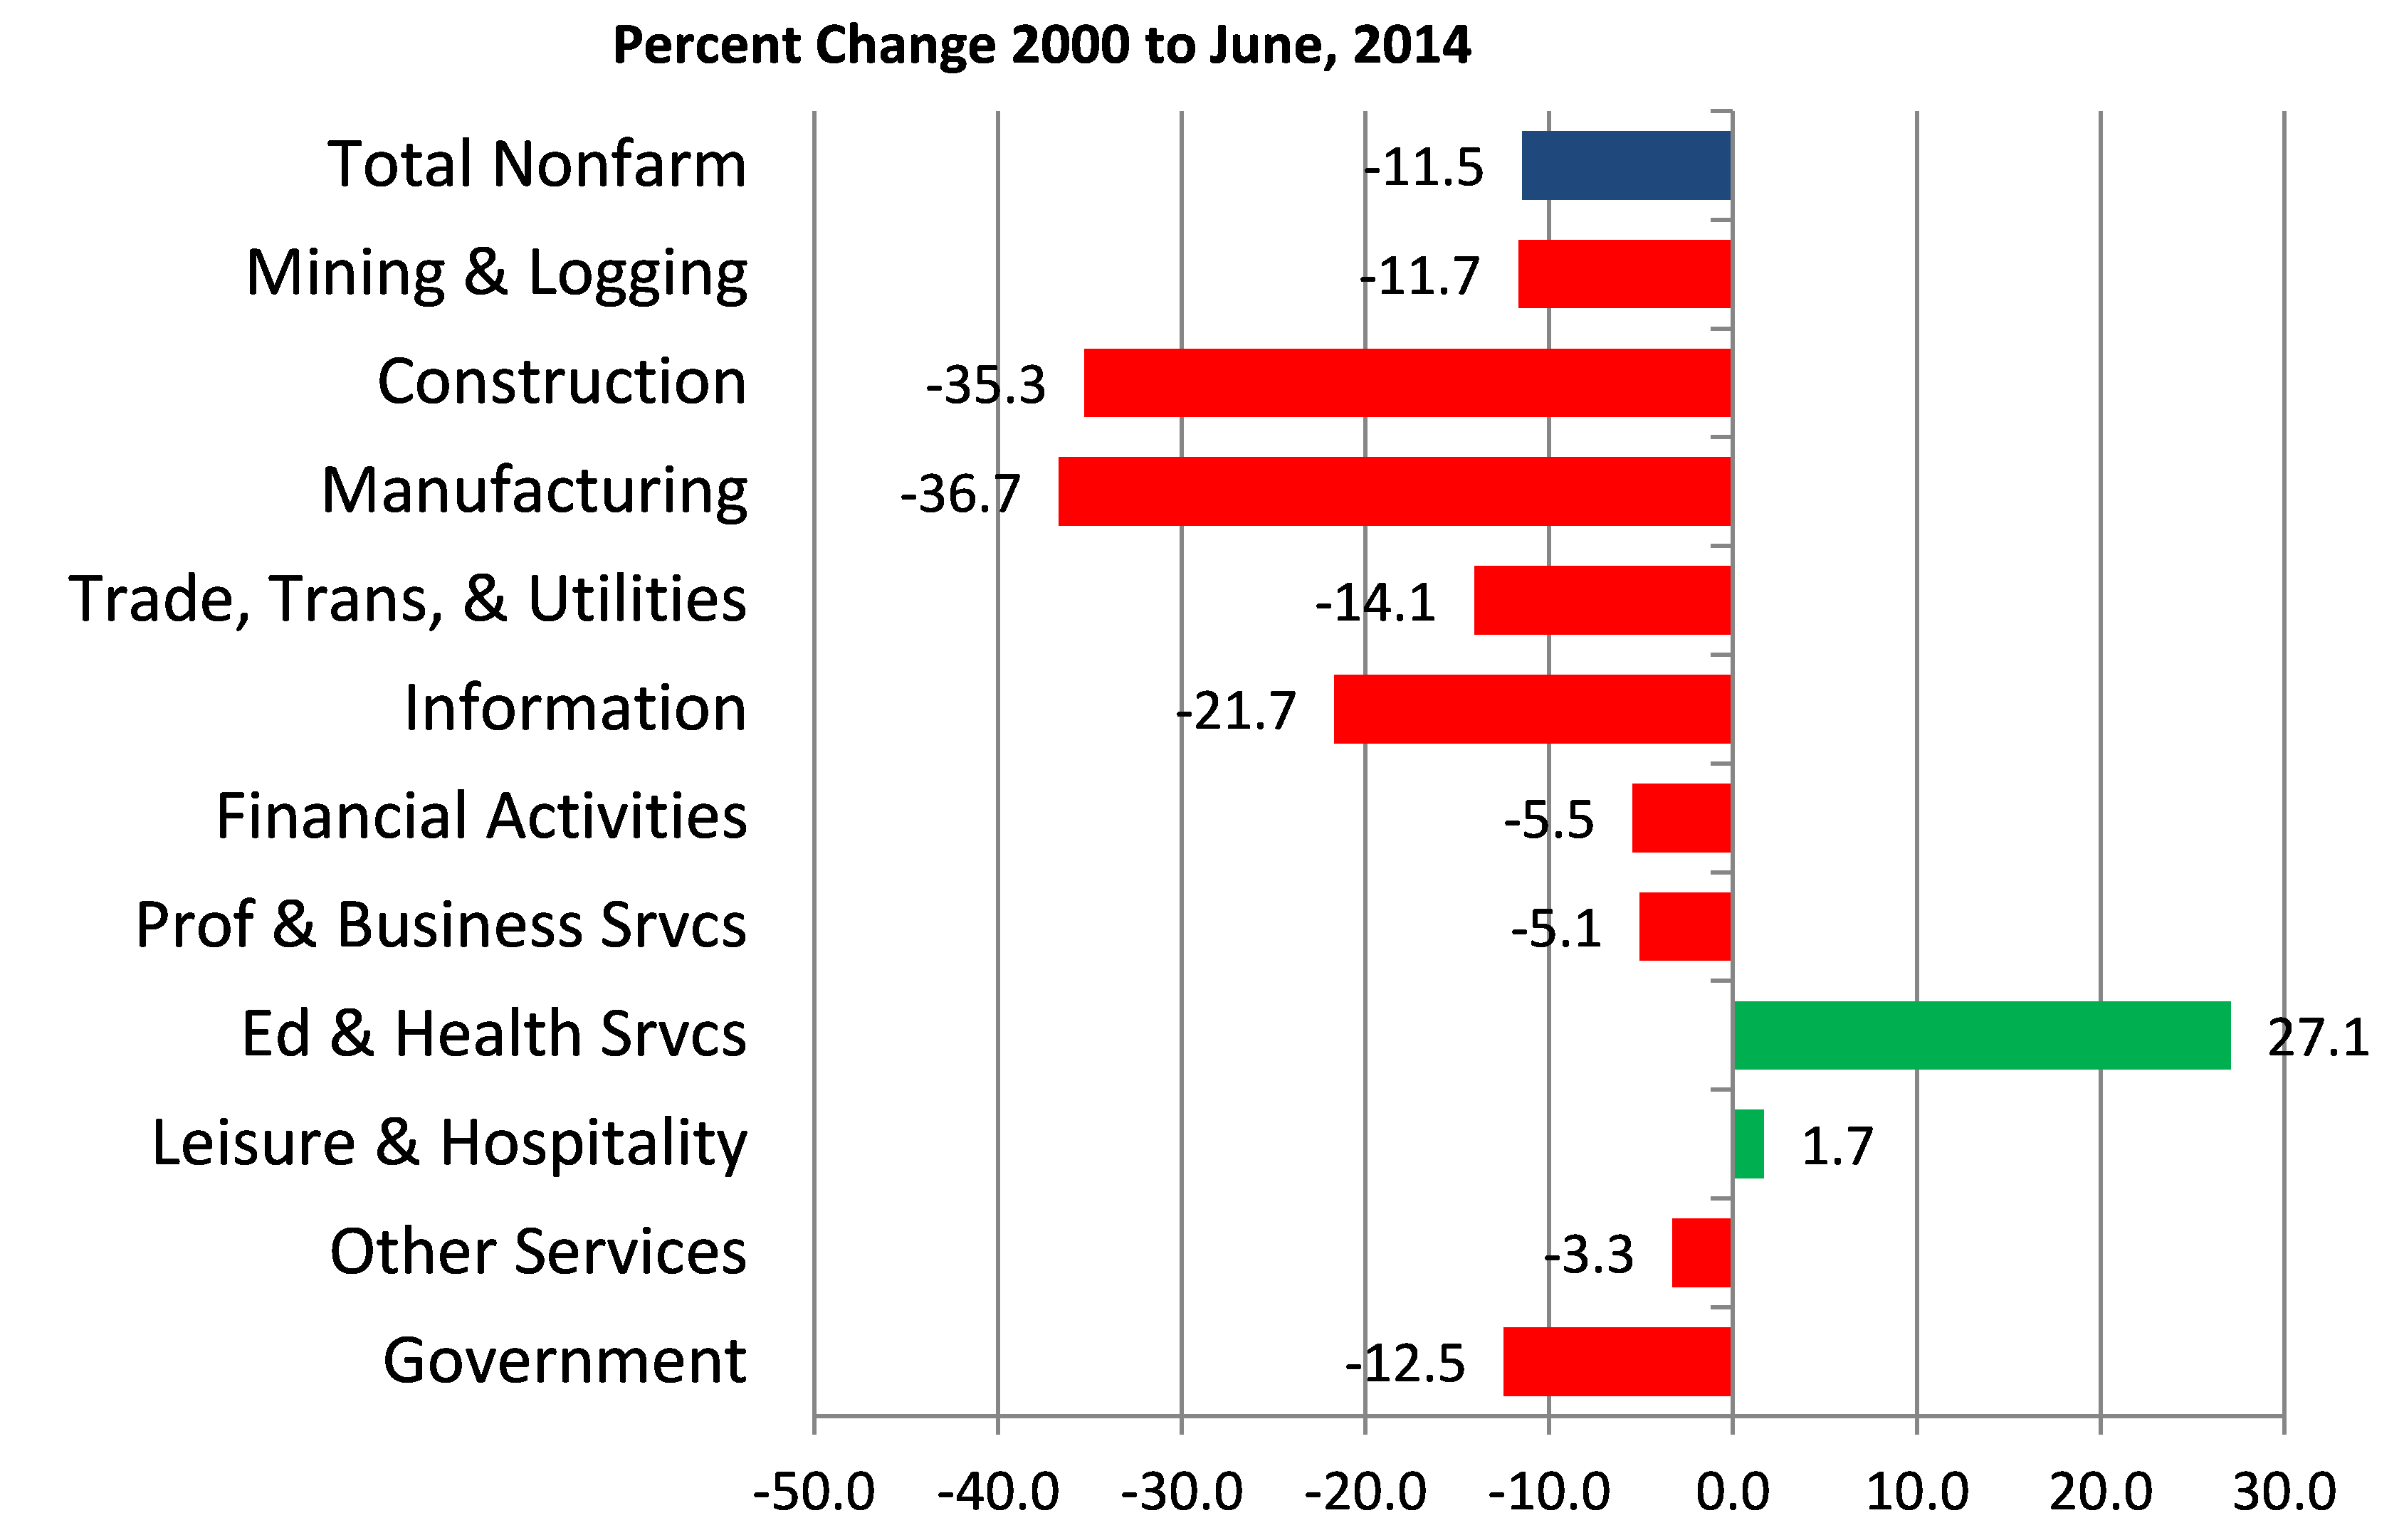
The sectors that lost the most employment on a percentage basis were manufacturing followed closely by construction. Michigan still has one of the nation’s highest employment concentrations in manufacturing jobs but of the top manufacturing states by employment in 2000, Michigan ranks third in job loss behind only California and Ohio. While the U.S. has seen employment numbers exceed their previous peak for every sector except two (information and government), Michigan hasn’t experienced the same fortunate results.
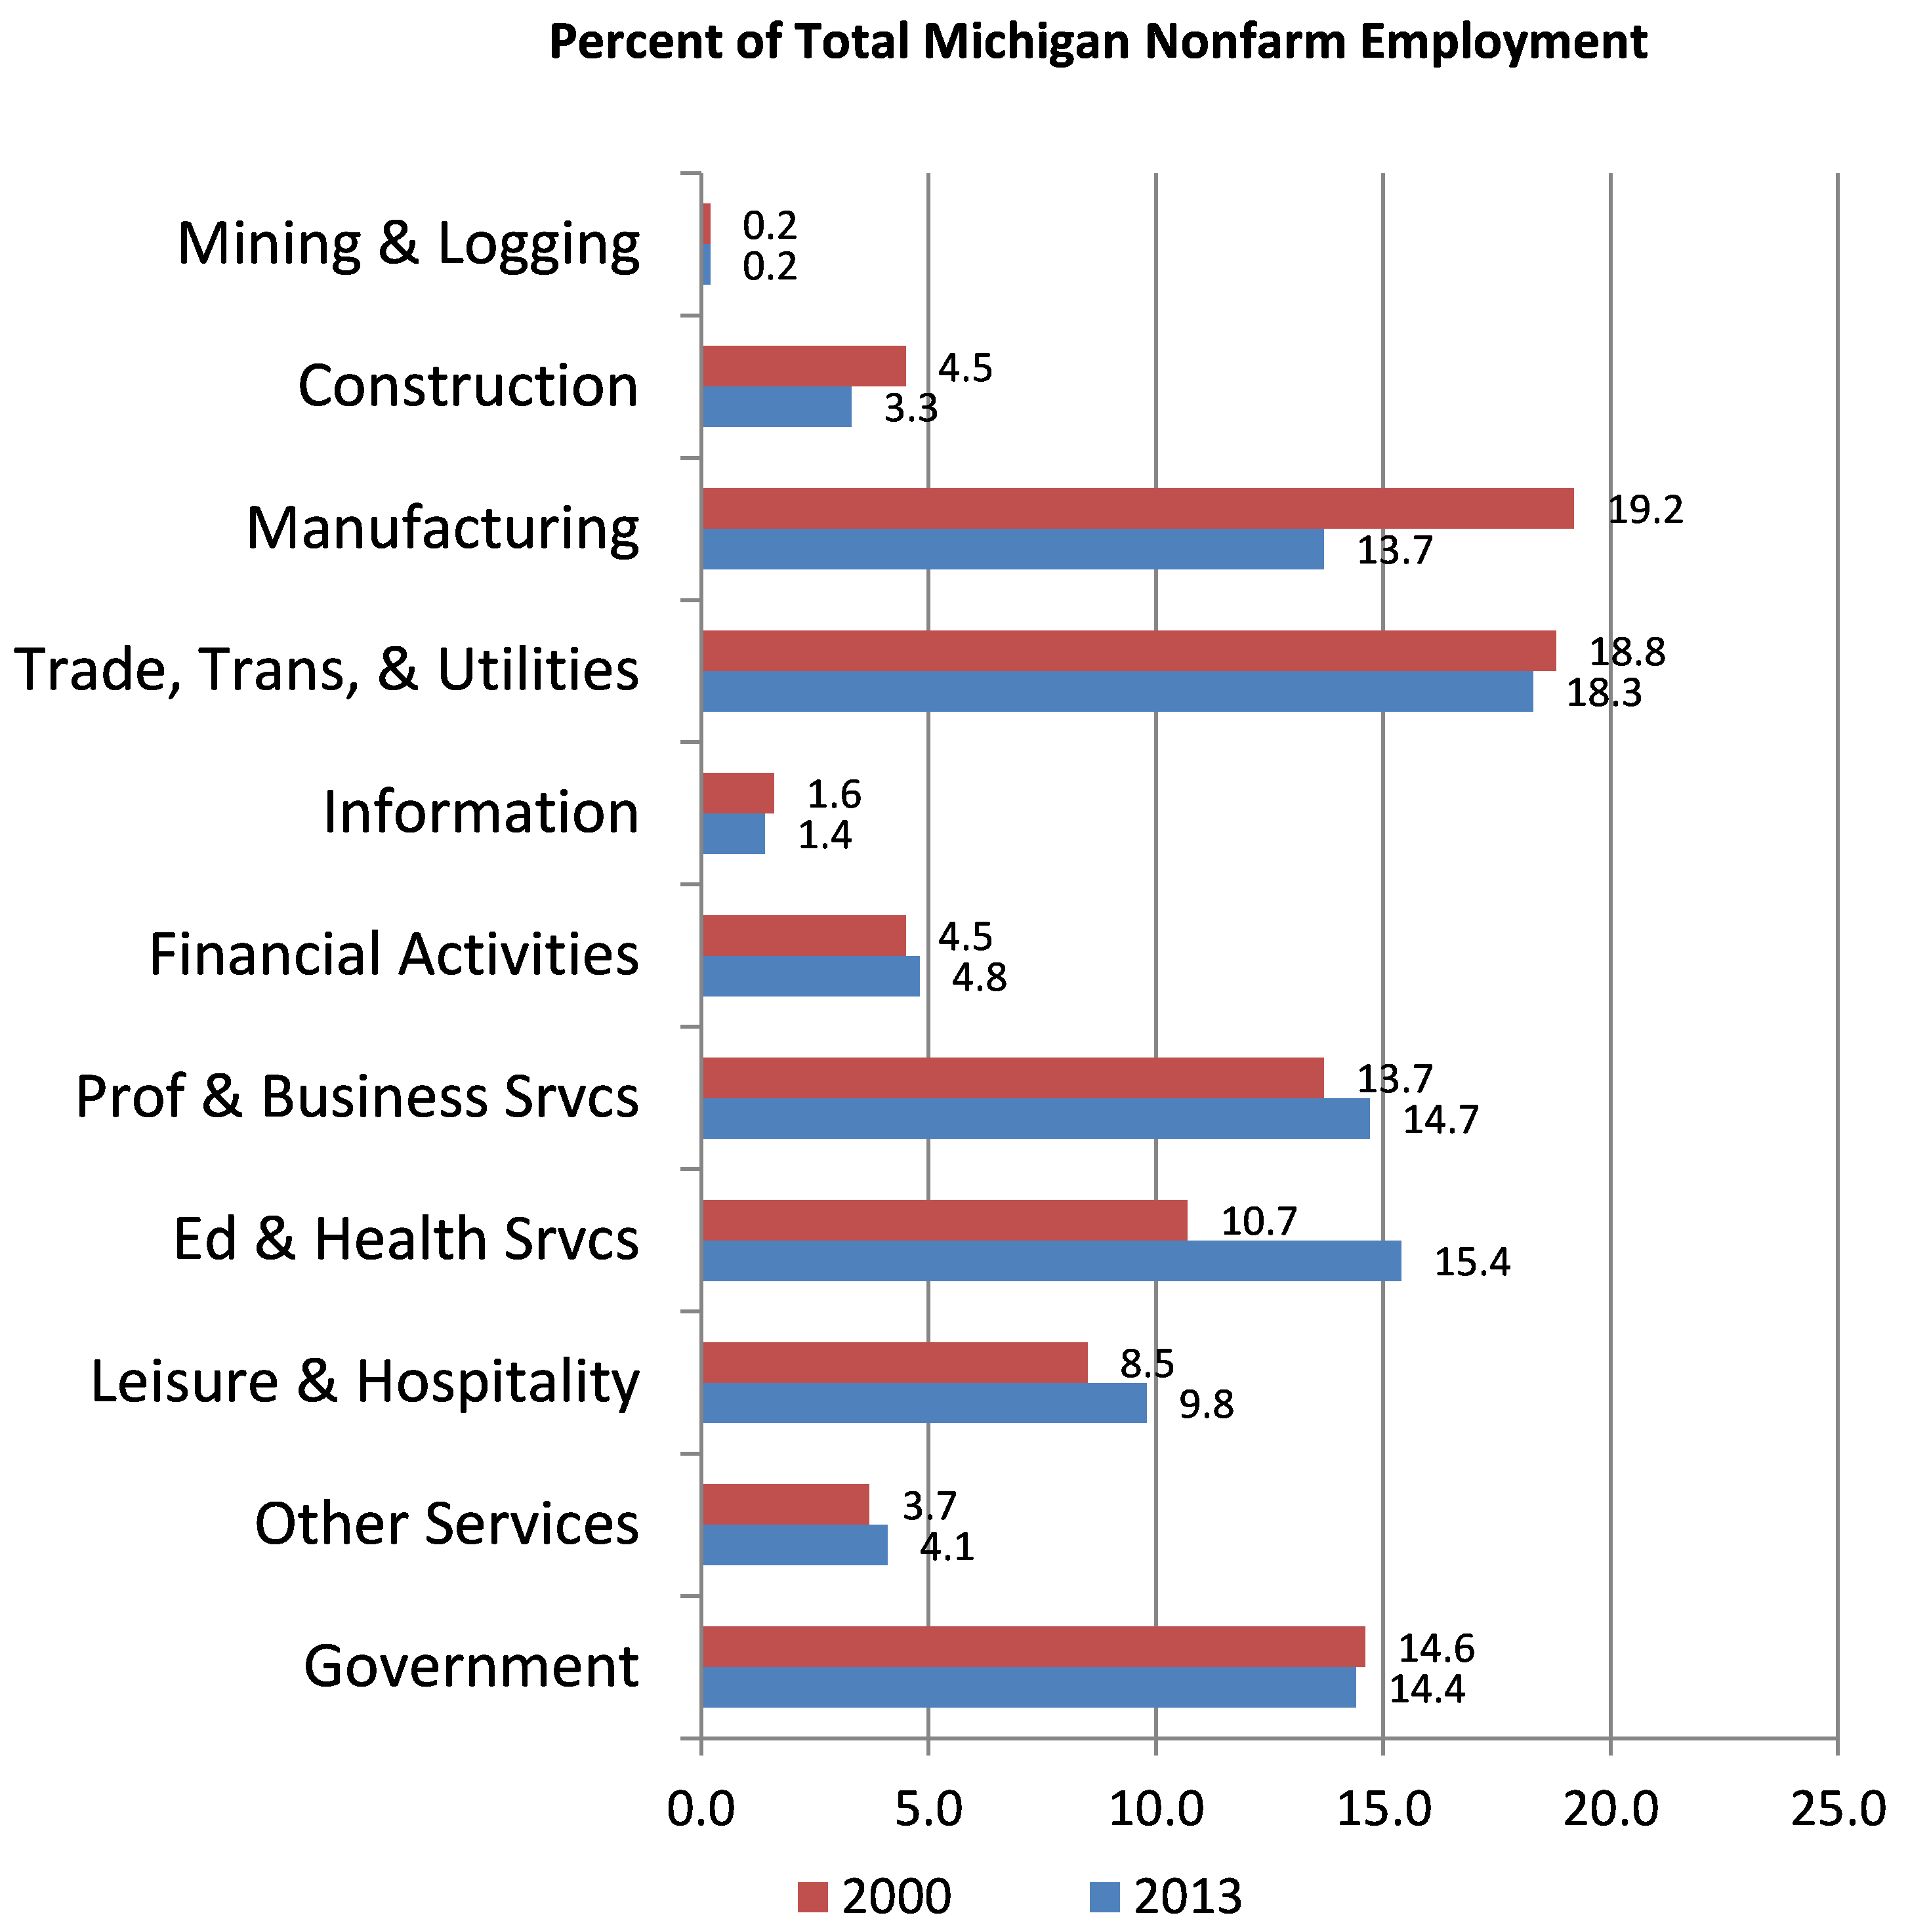
What happened to manufacturing jobs in Michigan has been well documented. Throughout the decade of the 1990s, manufacturing employment in Michigan averaged about 20.2% of total nonfarm employment. A large percentage of those jobs were tied to the automotive industry. By 2009, manufacturing employment as a share of total nonfarm employment in Michigan had fallen to just 12.0% from 19.2% in calendar year 2000. This equates to a loss of over 433,000 manufacturing jobs in less than a decade, the equivalent of almost 23,000 jobs per year. By 2013, Michigan had recoved some of the manufacturing jobs that were lost during the recession, but manufacturing’s share of total nonfarn employment of 13.7% remained well below its share in calendar year 2000 (Chart 4). These events surrounding the loss of many automotive manufacturing jobs also explain some of the job losses in other sectors. Construction, for example, is closely tied to investment, and in Michigan much of that investment is related to the automoble industry—not only business investment on plant and equipment but also residential investment on housing and durable goods for automotive workers, some of whom lost their jobs or left the state during the recession.
Chart 4. Michigan employment by sector
During this time frame, Michigan’s total share of U.S. nonfarm employment fell from 3.5% in 2000 to 3.0% in 2013 (Chart 5). The decline was felt in every sector except information. Even though the infromation sector was able to gain share relative to the U.S.—going from 2.0% in 2000 to 2.1% in 2013—it actually lost share in Michigan, falling from 1.6% in 2000 to 1.4% in 2013.
Chart 5. Michigan employment by sector

Although there were some industry sectors that added share as a percentage of Michigan employment between 2000 and 2013, including education and health services (10.7% to 15.4%), leisure and hospitality (8.5% to 9.8%), professional and business services (13.7% to 14.7%), other services (3.7% to 4.1%), and financial activities (4.5% to 4.8%), some of these share gains can be traced back to lower overall employment. Only two of these sectors, education and health services and leisure and hospitality, have added enough employment to surpass their 2000 employment levels.
At the same time that Michigan employment was declining, so were average weekly wages. Chart 6 below shows Michigan’s average weekly wages divided by the average weekly wage for the U.S. by sector in calendar years 2000 and 2013, or the wage permium Michigan workers were earning.1
Chart 6. Michigan to U.S. wage ratio
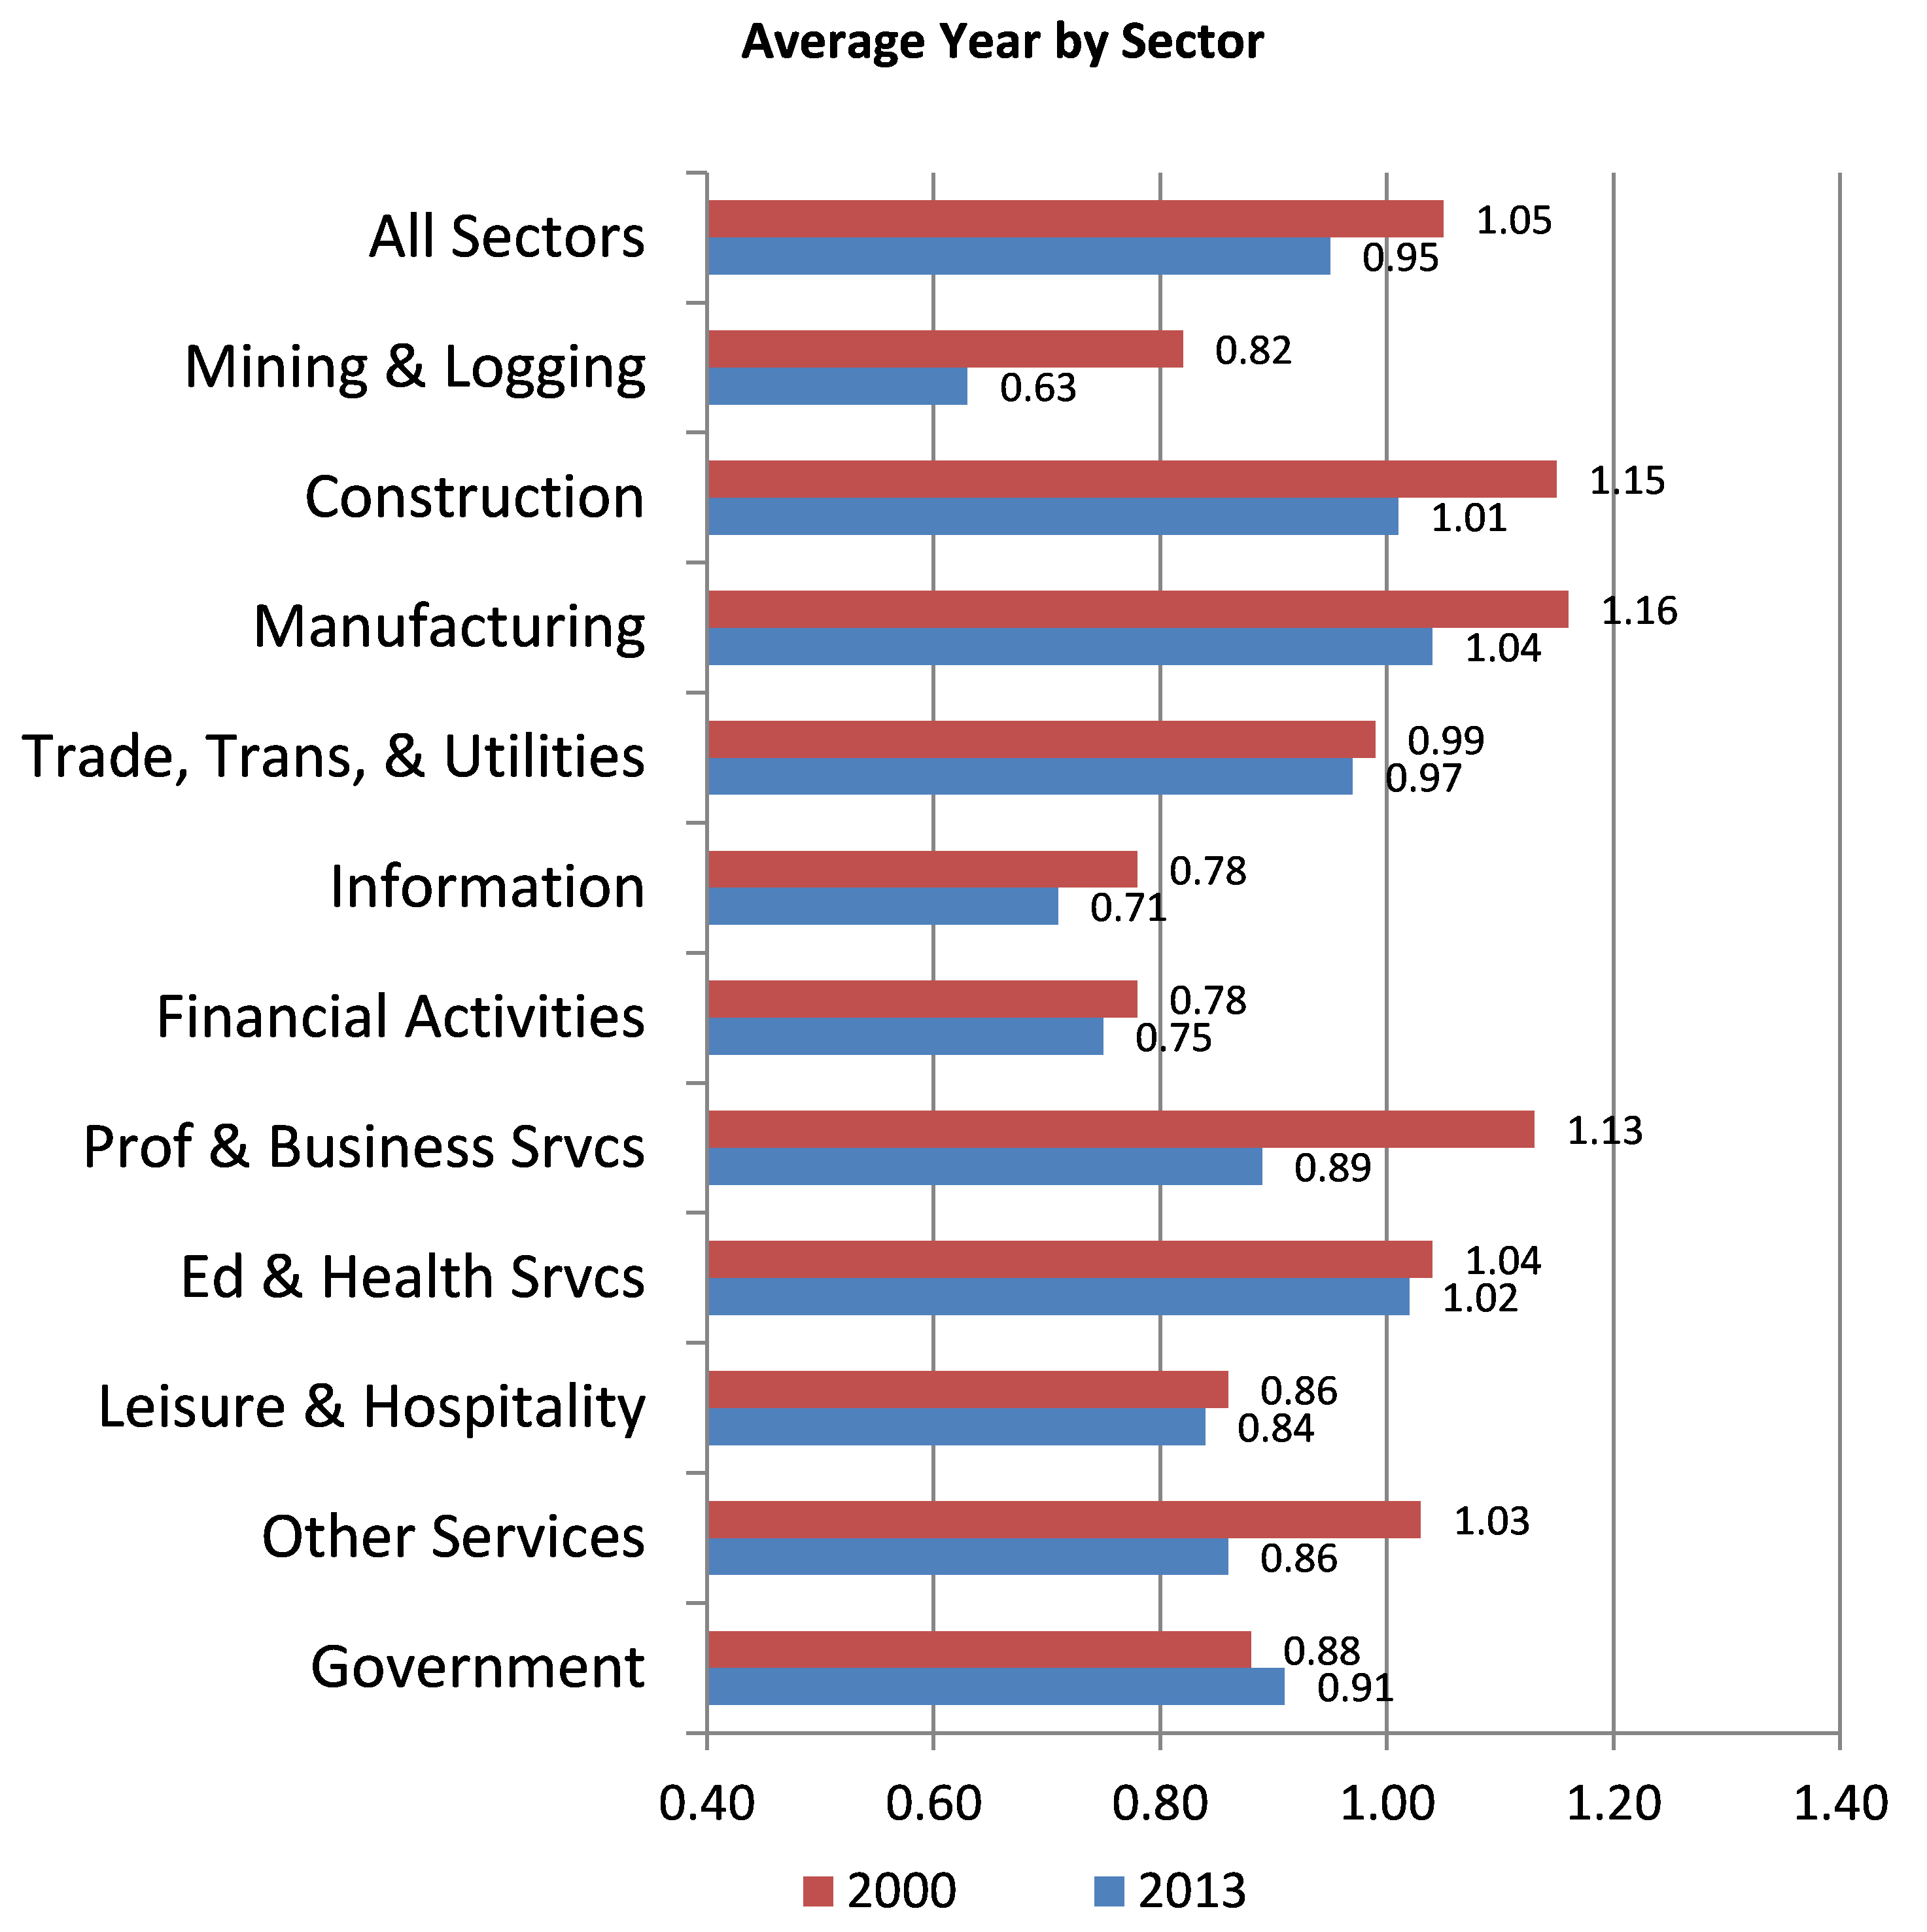
Based on the latest data from the U.S. Department of Labor’s Quarterly Census of Employment and Wages (QCEW), in calendar year 2000 Michigan’s manufacturing workers earned an average premium of 16% relative to manufacturing workers elsewhere in the country, and Michigan’s construction workers earned a premium of 15%. While workers in the manufacturing and construction industries still earn more than the national averages, their wage premiums have been reduced significantly. In addition, the ratios between wages in Michigan and the U.S. have fallen in every sector except government. As noted earlier, the manufacturing and construction sectors also had the highest percentage decline in employment since calendar year 2000 and continue to remain well below their calendar year 2000 employment levels. While Michigan workers earned a 5% premium in 2000, that premium had been entirely reversed by 2013, when Michigan workers earned about 5.0% less than the national average.
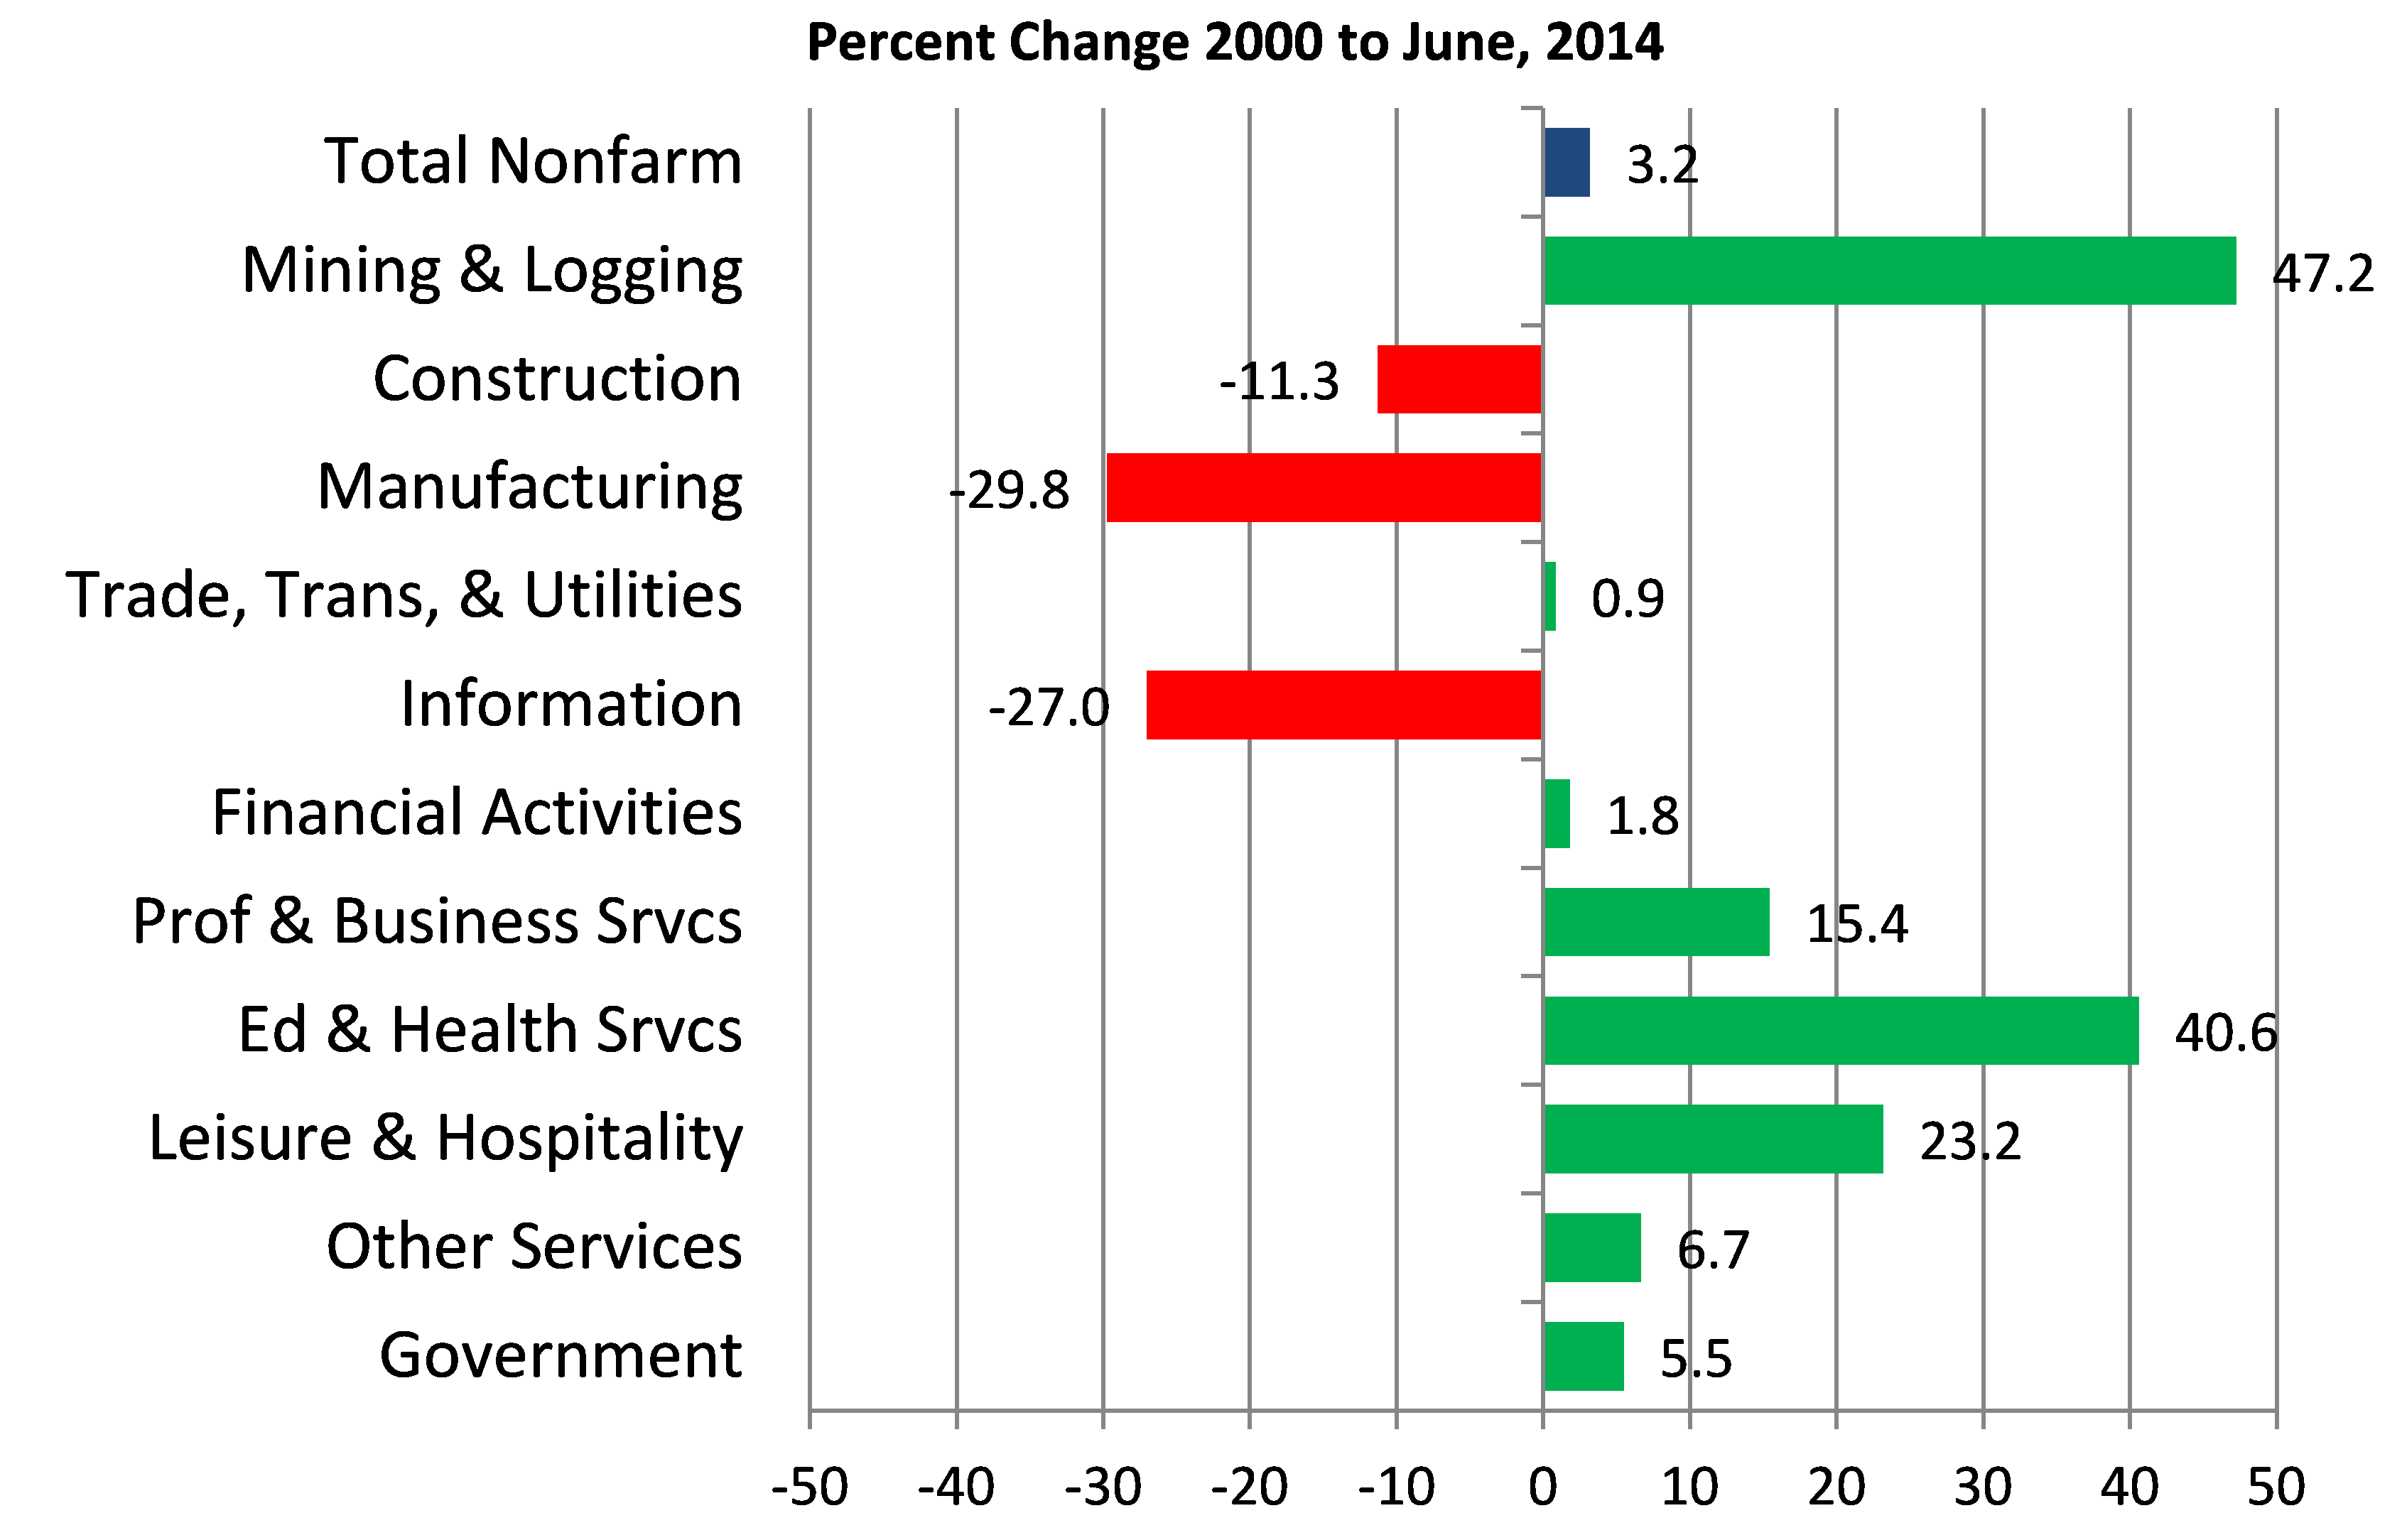
Since 2000, the structure of Michigan’s employment and average wages has changed considerably. Although Michigan has made some employment gains recently, total nonfarm employment still remains below its previous peak. But how much different might Michigan’s total employment look if we could go back to the way things were in 2000? To answer this question, I constructed a scenario in which Michigan maintained the same percentage of national employment by sector as it had in 2000. Chart 7 below shows the results of this scenario in percent change by sector from average year 2000 to June, 2004. This shows that Michigan’s total employment would be 3.2% higher than it is today and 0.2% higher than its previous peak, with the largest percentage gains coming in the mining and logging, education and health services, and leisure and hospitality sectors. However, Michigan would still have suffered significant employment declines in the manufacturing, information, and construction sectors.
Chart 7. Michigan employment by sector scenario
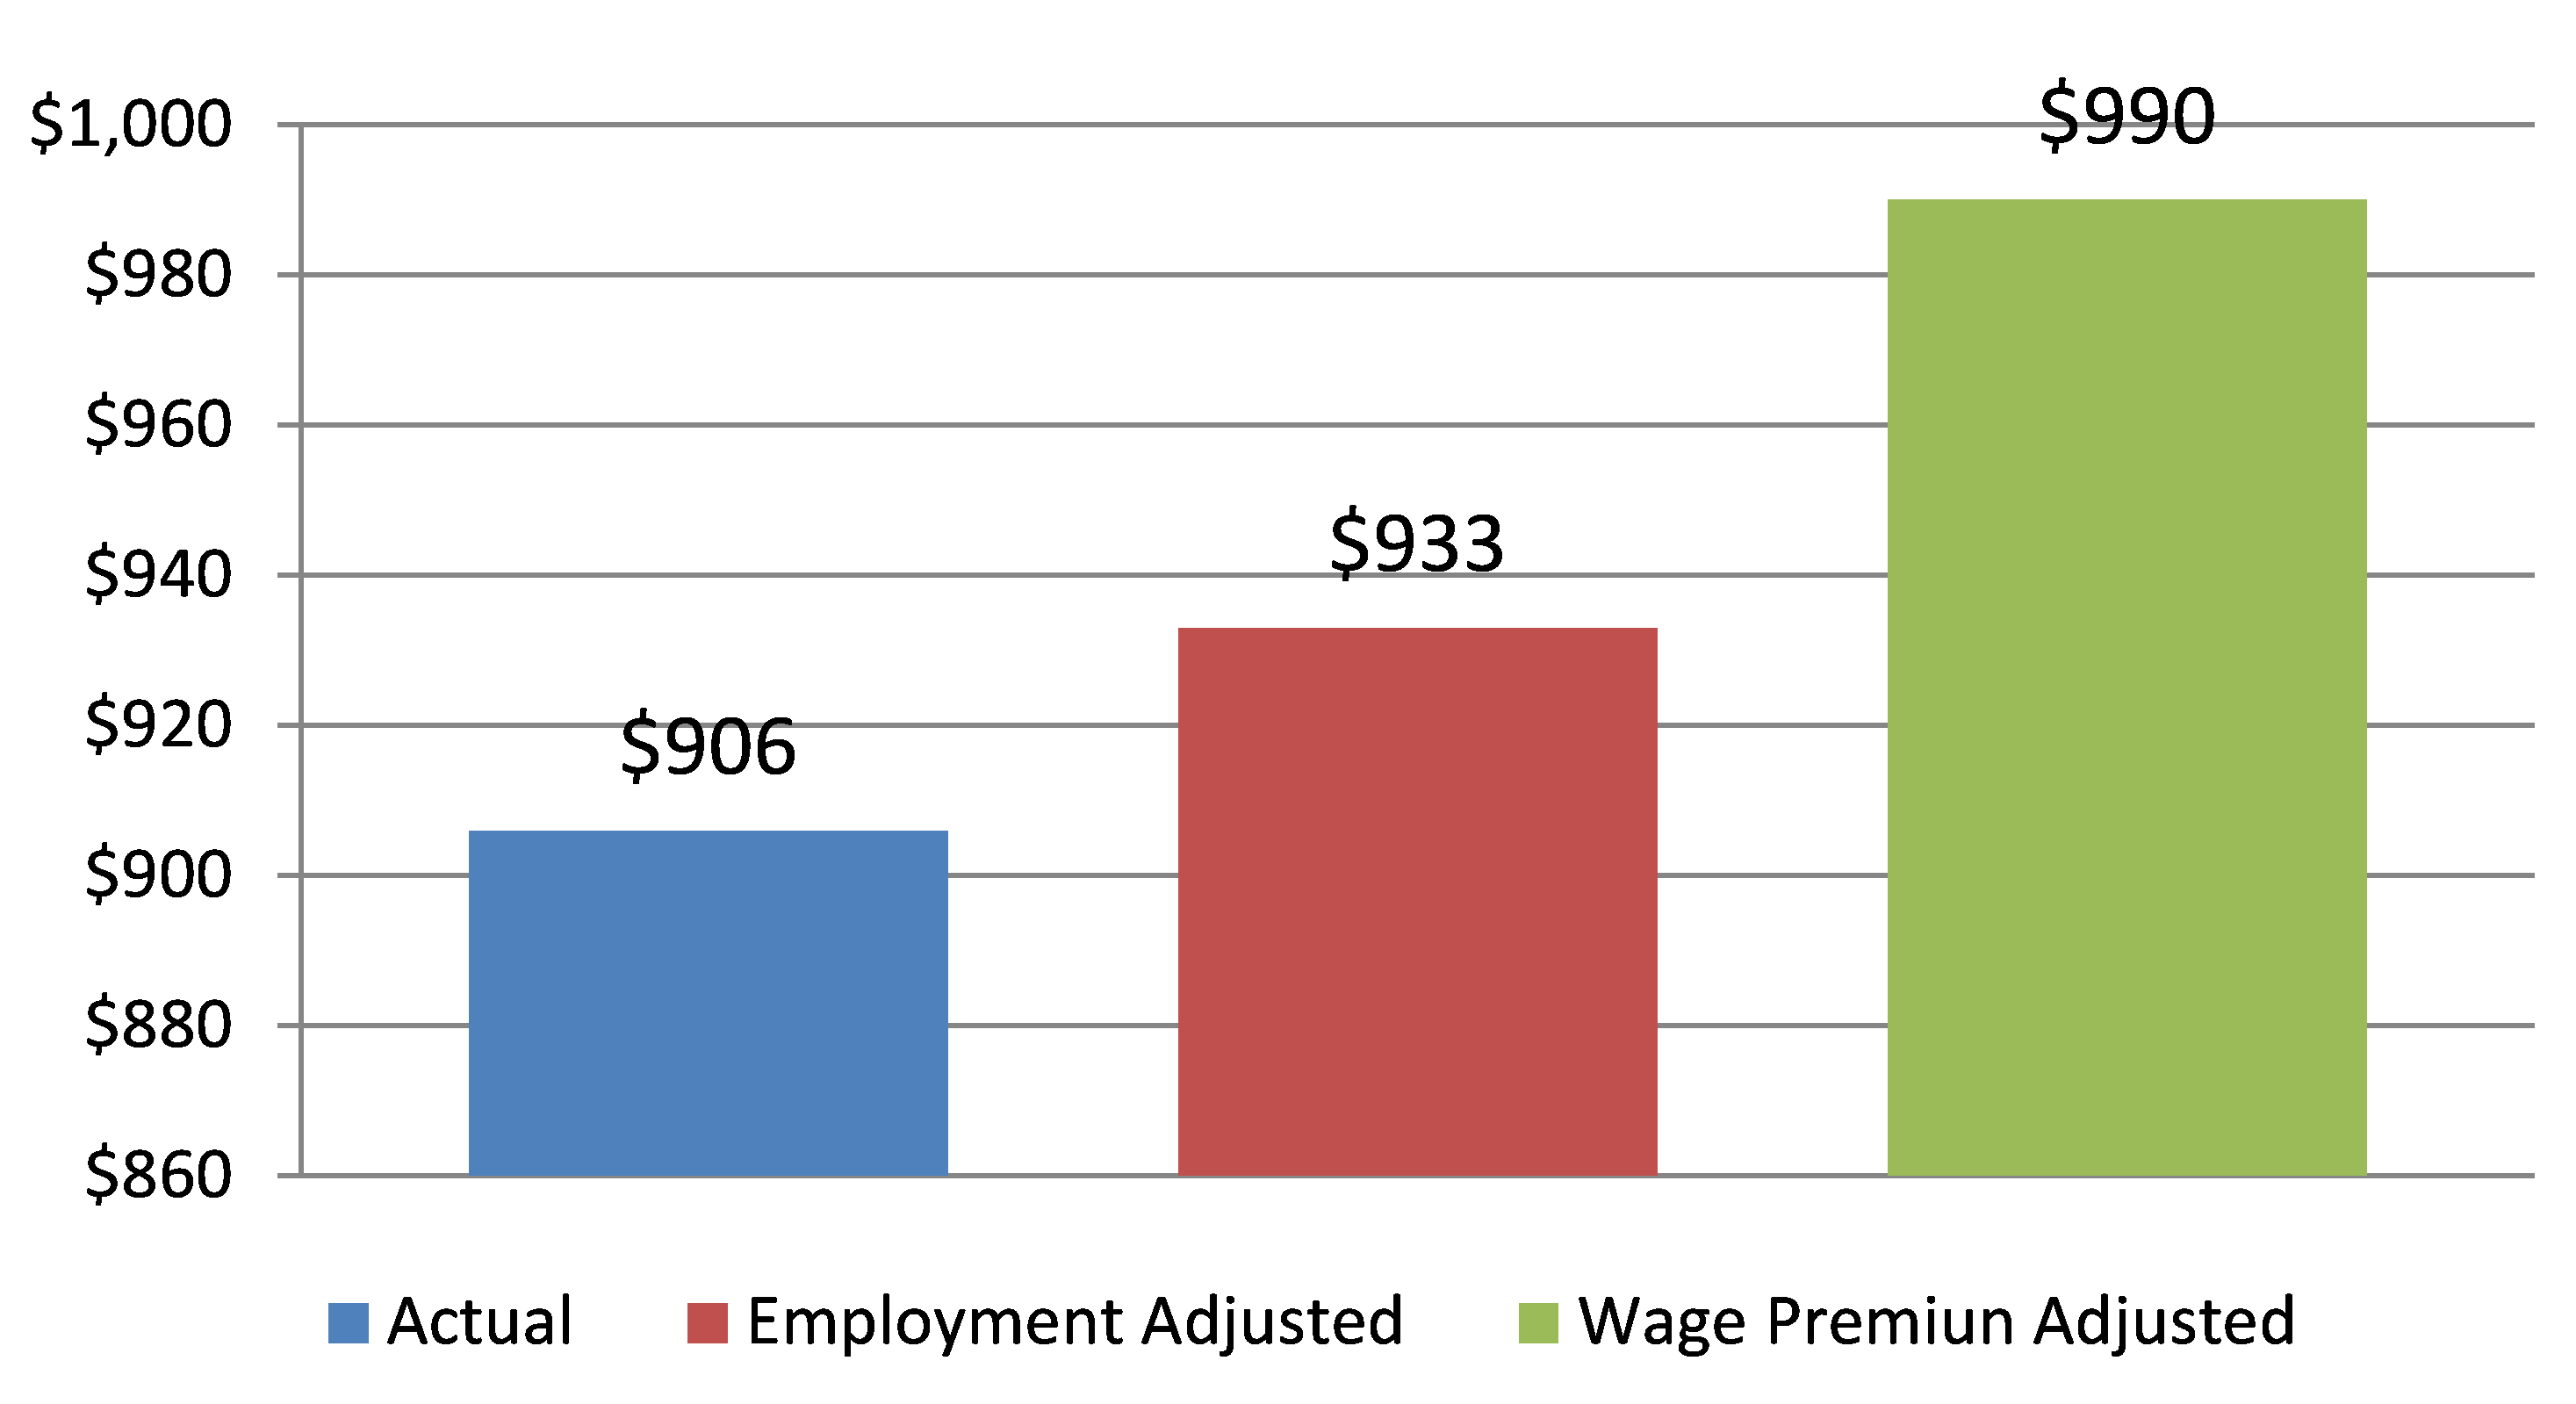
To look at what impact Michigan’s changing employment structure has had on wages, I constructed two different scenarios. In the first wage scenario, I held Michigan’s current wage by sector constant but changed the employment shares by sector to what they were in 2000 to match what I did in the employment scenario above. In the second scenario, I held the employment shares by sector equal to what they were in 2013 but I changed the average weekly wage ratios to what they were in 2000. For each of these two wage scenarios, I then calculated Michigan’s weighted average weekly wage for all the sectors. Chart 8 shows the results of these two scenarios compared with the 2013 average weekly wage in Michigan. The first wage scenario implies that if Michigan had the same employment structure by sector that it had in 2000, the total average weekly wage would have increased by 3.0% to $933 a week. Even with this increase, Michigan’s average weekly wage would still be below the national average of $958 per week by 2.6%. In the second wage scenario, the average weekly wage in Michigan increases by 9.3% to $990 per week. This scenario places Michigan’s average weekly wages above the national average but by only 3.3% versus the 5.0% premium that existed in 2000.
Chart 8. Michigan average weekly wage for 2013
In summary, while Michigan’s employment has made significant improvement during this economic recovery, there is still a lot of work that needs to be done. Without question, one of the most positive events pertaining to Michigan employment and wages has been the steady and long-lasting growth in the education and health services sector. The education and health sector has not only helped to offset some of the jobs lost in manufacturing and construction, but also the sector’s higher than national average weekly wage has been an added bonus to the state. Other sectors that could provide added help to Michigan’s employment structure and wage picture going forward include the manufacturing and construction sectors. Given that these two sectors still command a small wage premium, any improvement in either of these sectors would surely help total average wages for the state. However, going back to the way it was in 2000 doesn’t seem to be the remedy.
Even if Michigan could go back in time by 14 years, its employment and wage situation wouldn’t be that much different than it is today. Although total nonfarm employment would be higher today if Michigan had the same percentages of U.S. employment by sector as it did in 2000, it would only be higher by 3.2%. That would equate to an average job growth of just 0.2% per year over a 14-year span. We also saw that total average weekly wages for Michigan would seem to look considerably better if Michigan still enjoyed the same wage premiums it had in 2000, but the changes in the structure of employment by sector that have taken place would diminish some of the total wage premium. What isn’t apparent at first glance is how much more important the structural change in employment was to total wages in Michigan. Table 1 shows an estimate of total weekly wages in Michigan by multiplying total nonfarm employment by the average weekly wage for 2013 for each of the two wage scenarios discussed above. What this shows is that if Michigan maintained the same percentage of national employment by sector in June, 2014 as it had in 2000, together with the average weekly wage this assumption implies, Michigan’s total weekly wages would be greater than if the state held the same wage premiums today as it did in 2000. So even if Michigan had the same wage premiums as in 2000 and the higher weekly wage this scenario implies, total weekly wages for the state would not be as great as if the employment structure were the same today as it was in 2000.
Table 1
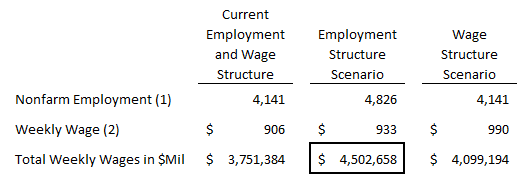
(2) Wages based on 2013 Michigan average year.
That’s not to say that the erosion of Michigan’s wage position relative to the national average hasn’t has a significant impact on total average weekly wages in the state, but it does seem that the wage premium change wasn’t as significant as the shift in the employment structure between sectors when taking total weekly wages for Michigan into consideration.
Footnotes
1 Calculations are based on U.S. Department of Labor’s and include only covered employment.


