Is the Buzz Surrounding STEM Justified?
STEM is an acronym that stands for science, technology, engineering, and math. It is associated with education and is often mentioned in tandem with policymakers’ desire to increase the number of graduates in STEM-related occupations and fields. In recent years, the campaign to increase the number of STEM graduates has become more aggressive—even the White House has shown deep interest in producing more of them1.
STEM education has received such attention because many contend that the U.S. economy will need more STEM experts as time progresses and the economy evolves2. Moreover, STEM has received greater notice of late because it is believed that the analytical and technical skills required to work in a STEM-related field provide opportunities for workers to merit higher wages and salaries than those who work in non-STEM-related fields.
In this blog entry, I will compare STEM-related versus non-STEM-related employment and wages in Michigan, the neighboring states of Indiana and Ohio, and the U.S. as a whole over the period 2003–13. This period was chosen because it captures Michigan’s one-state recession that lasted from 2003 through 2009, the nation’s Great Recession (which lasted from the end of 2007 through mid-2009), and the subsequent recovery from them3. The data come from the U.S. the Bureau of Labor Statistics’ (BLS) Occupational Employment Statistics (OES) database4. The criteria to define STEM- and non-STEM-related occupations were taken from the U.S. Census Bureau5. All calculations were done using the annual May releases of the OES data by state6.
Employment
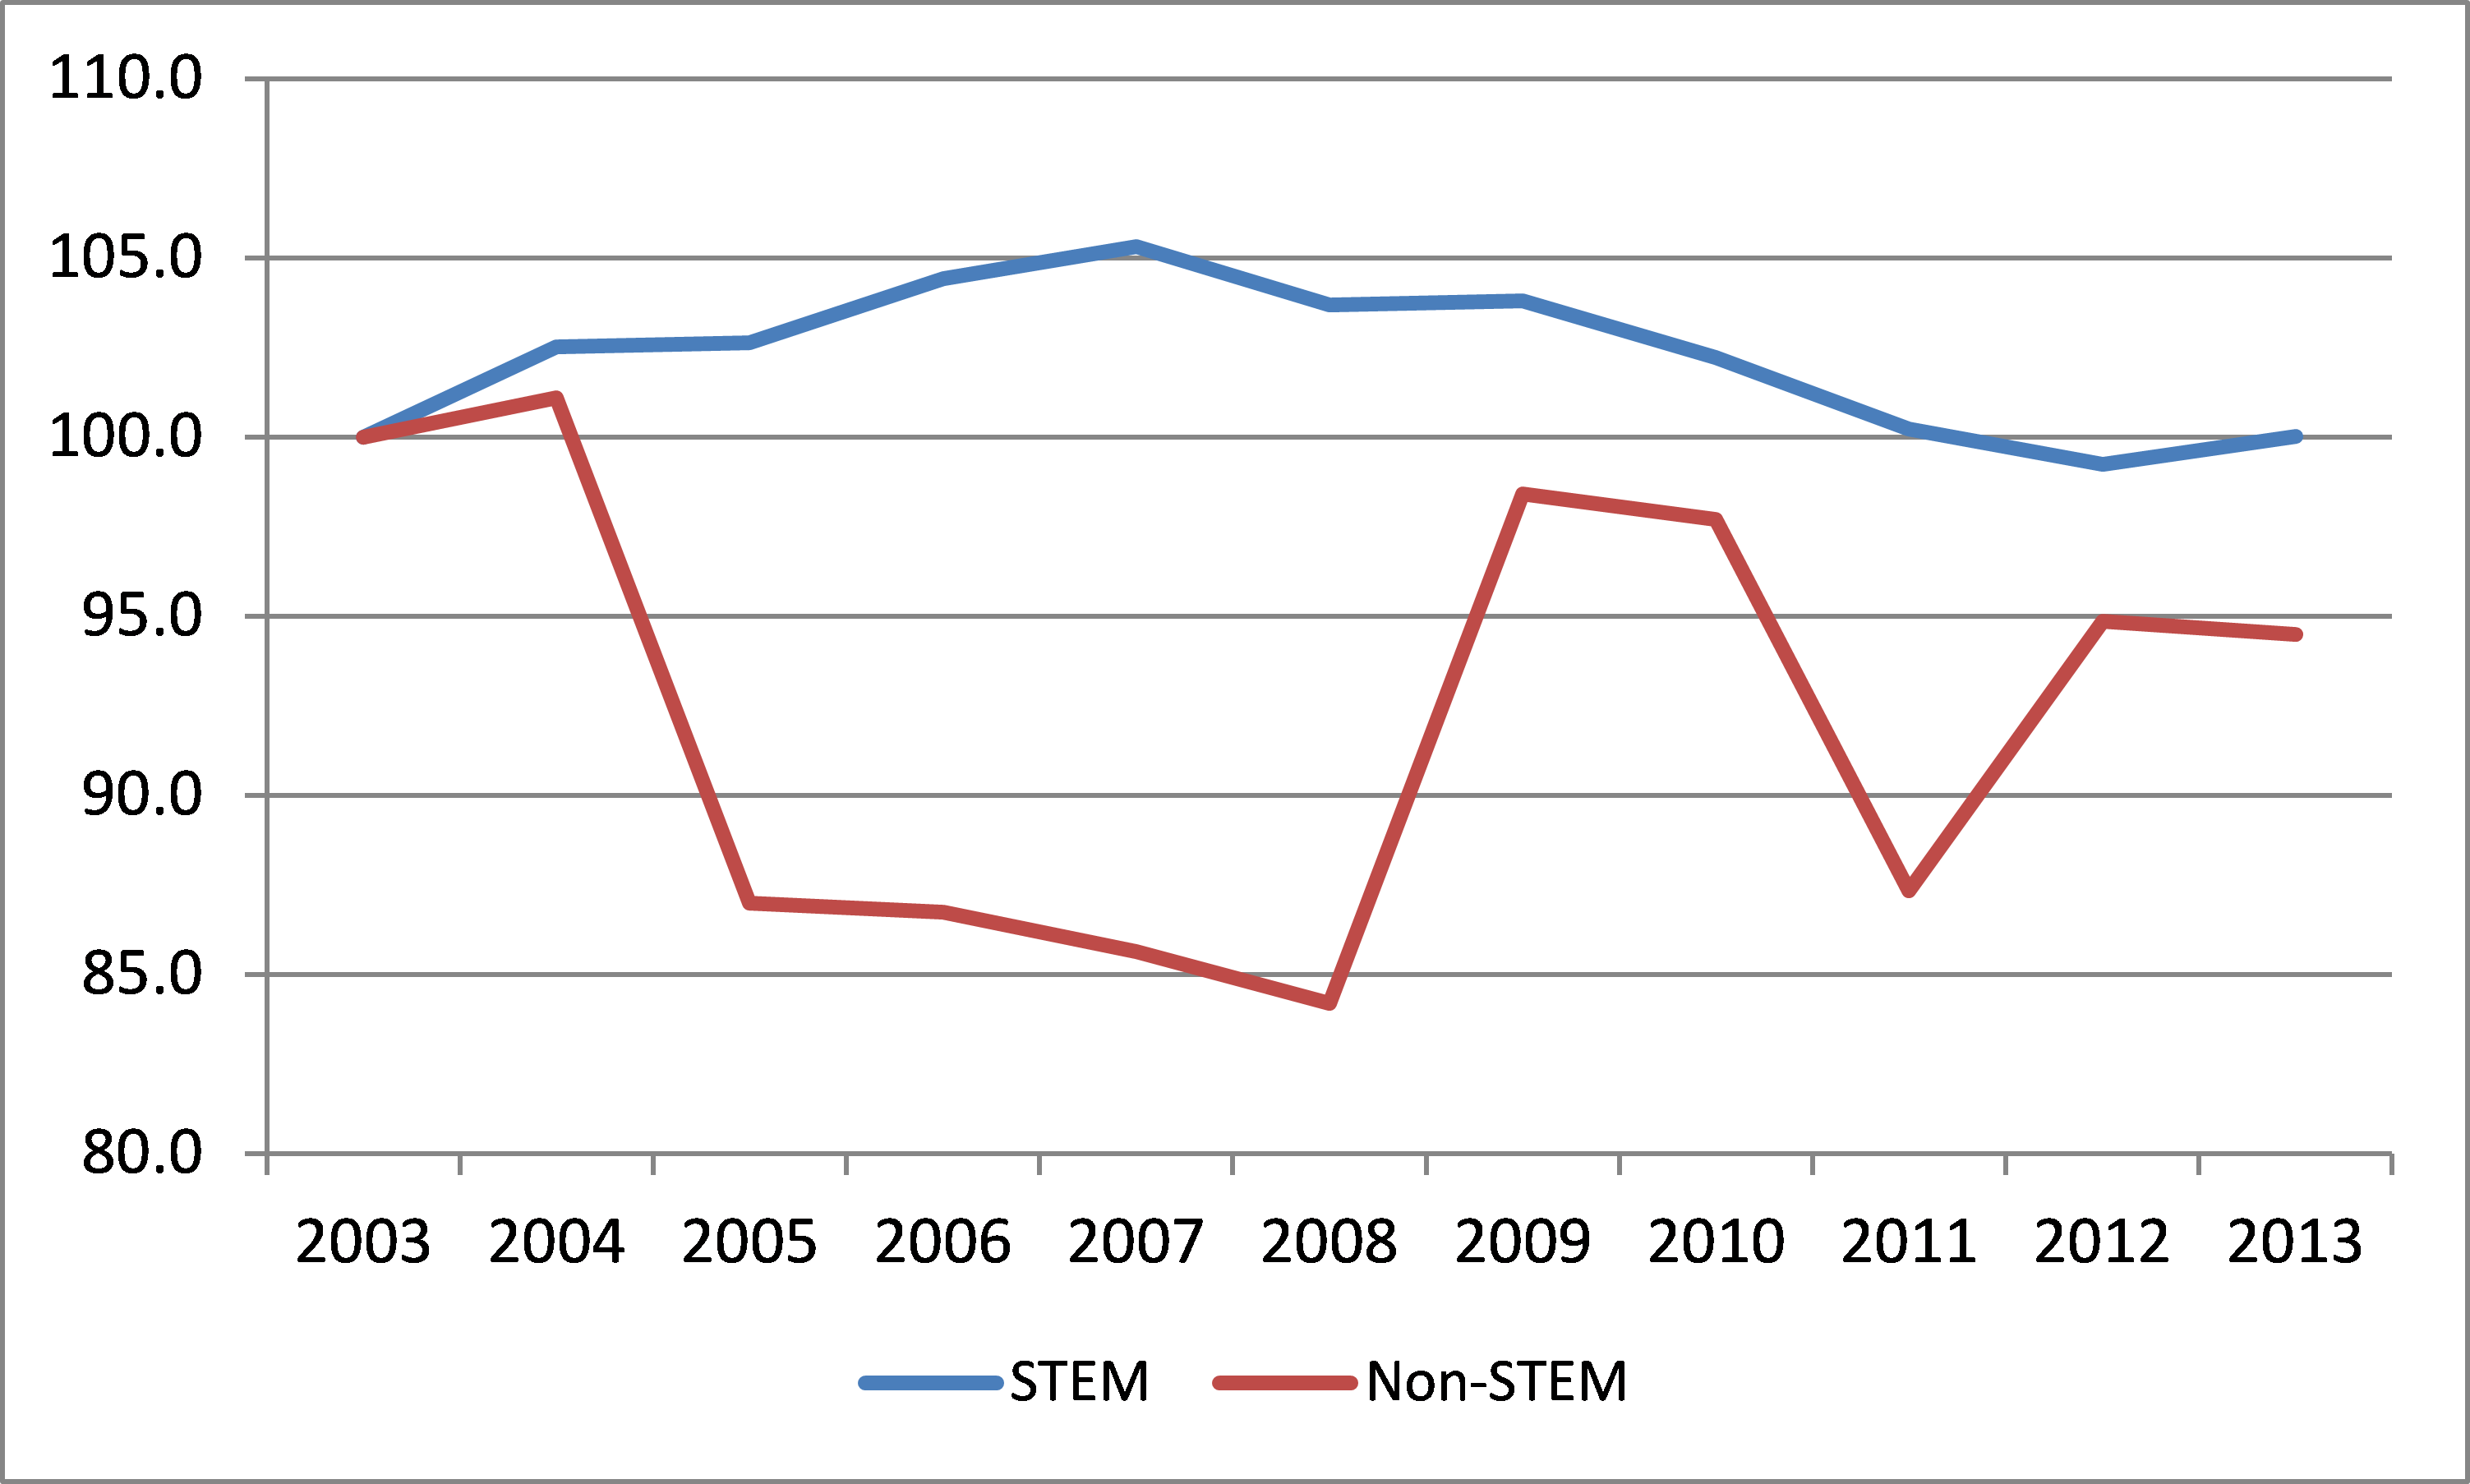
Over the period 2003–13, Michigan’s total employment fell by 7.8%, according to the state’s OES data. After splitting up the period into recessionary (2003–09) and post-recessionary (2009–13) periods, one can see that employment decreased by 10.2% during Michigan’s one-state recession but rebounded afterward, going up by 2.7%. By separating STEM- and non-STEM-related employment growth, one will note that STEM employment grew at a faster pace. Figure 1 shows employment in STEM-related fields increased (on net) by 9.7% in Michigan during the 2003–13 period. In sharp contrast, employment in non-STEM-related fields decreased (on net) by 10.1% in Michigan over that span.
Figure 1. STEM- versus non-STEM-related employment growth in Michigan, 2003–13
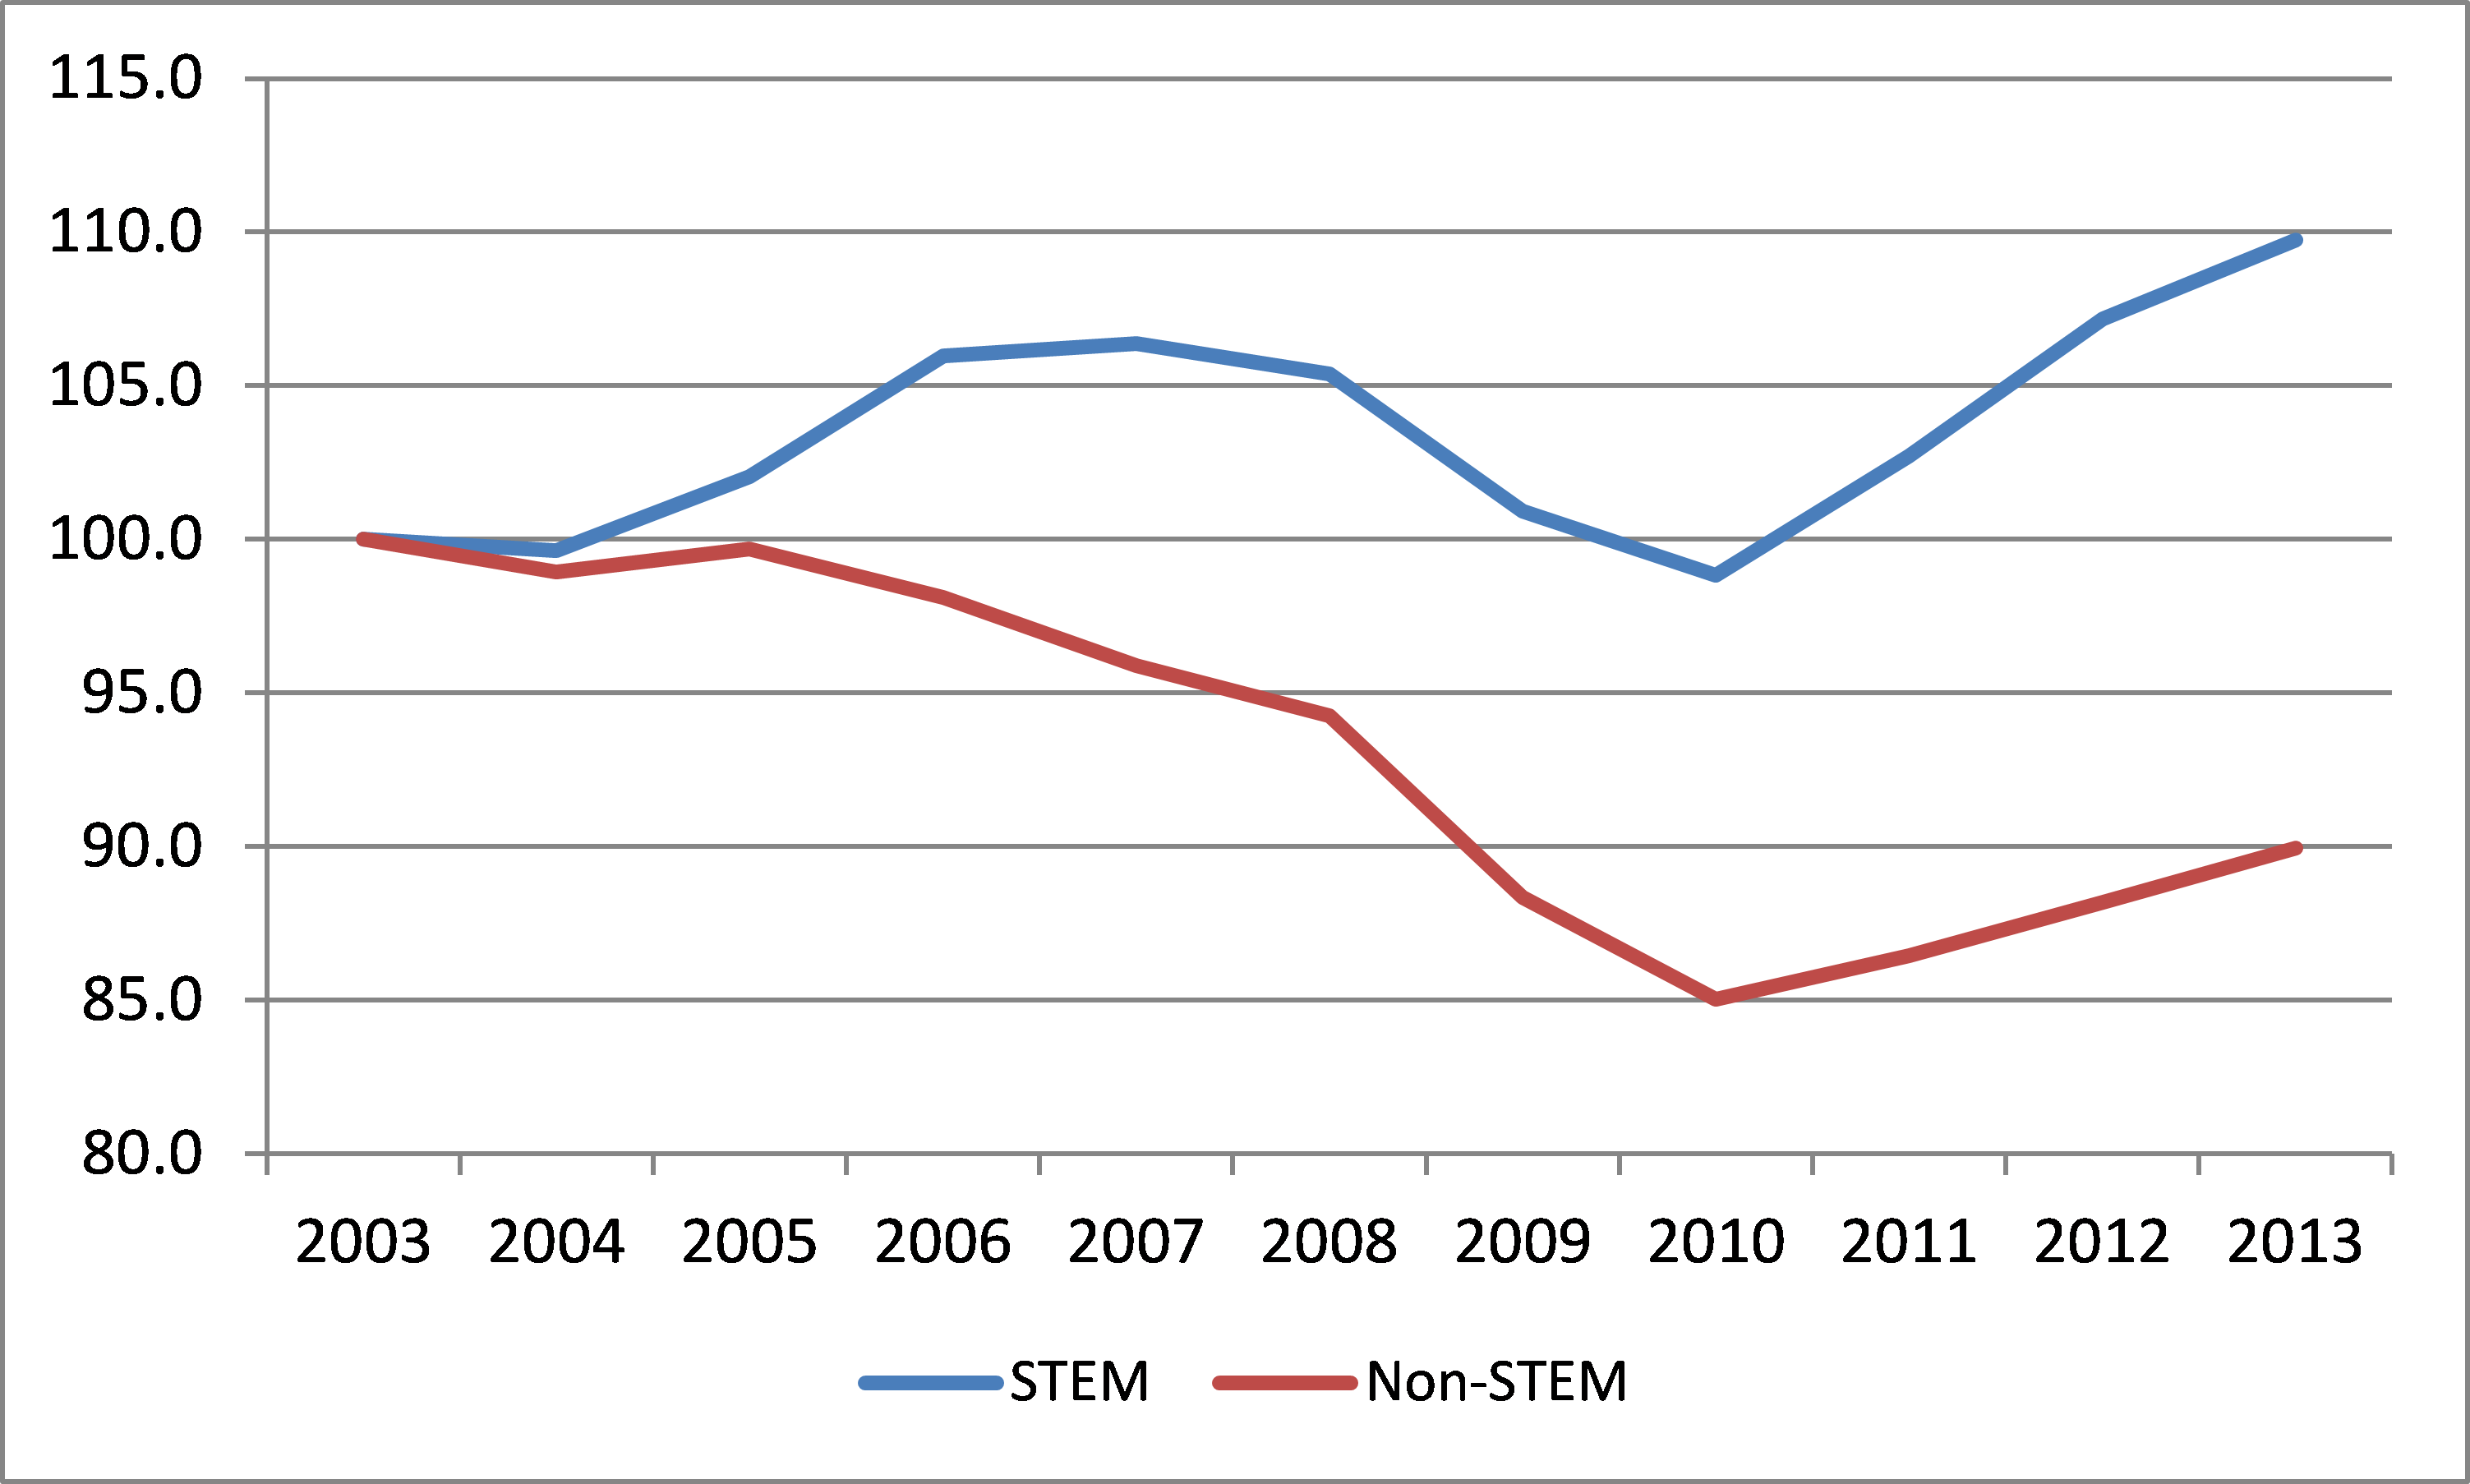
Source: Author’s calculations based on data from the U.S. Bureau of Labor Statistics, Occupational Employment Statistics database, available online.
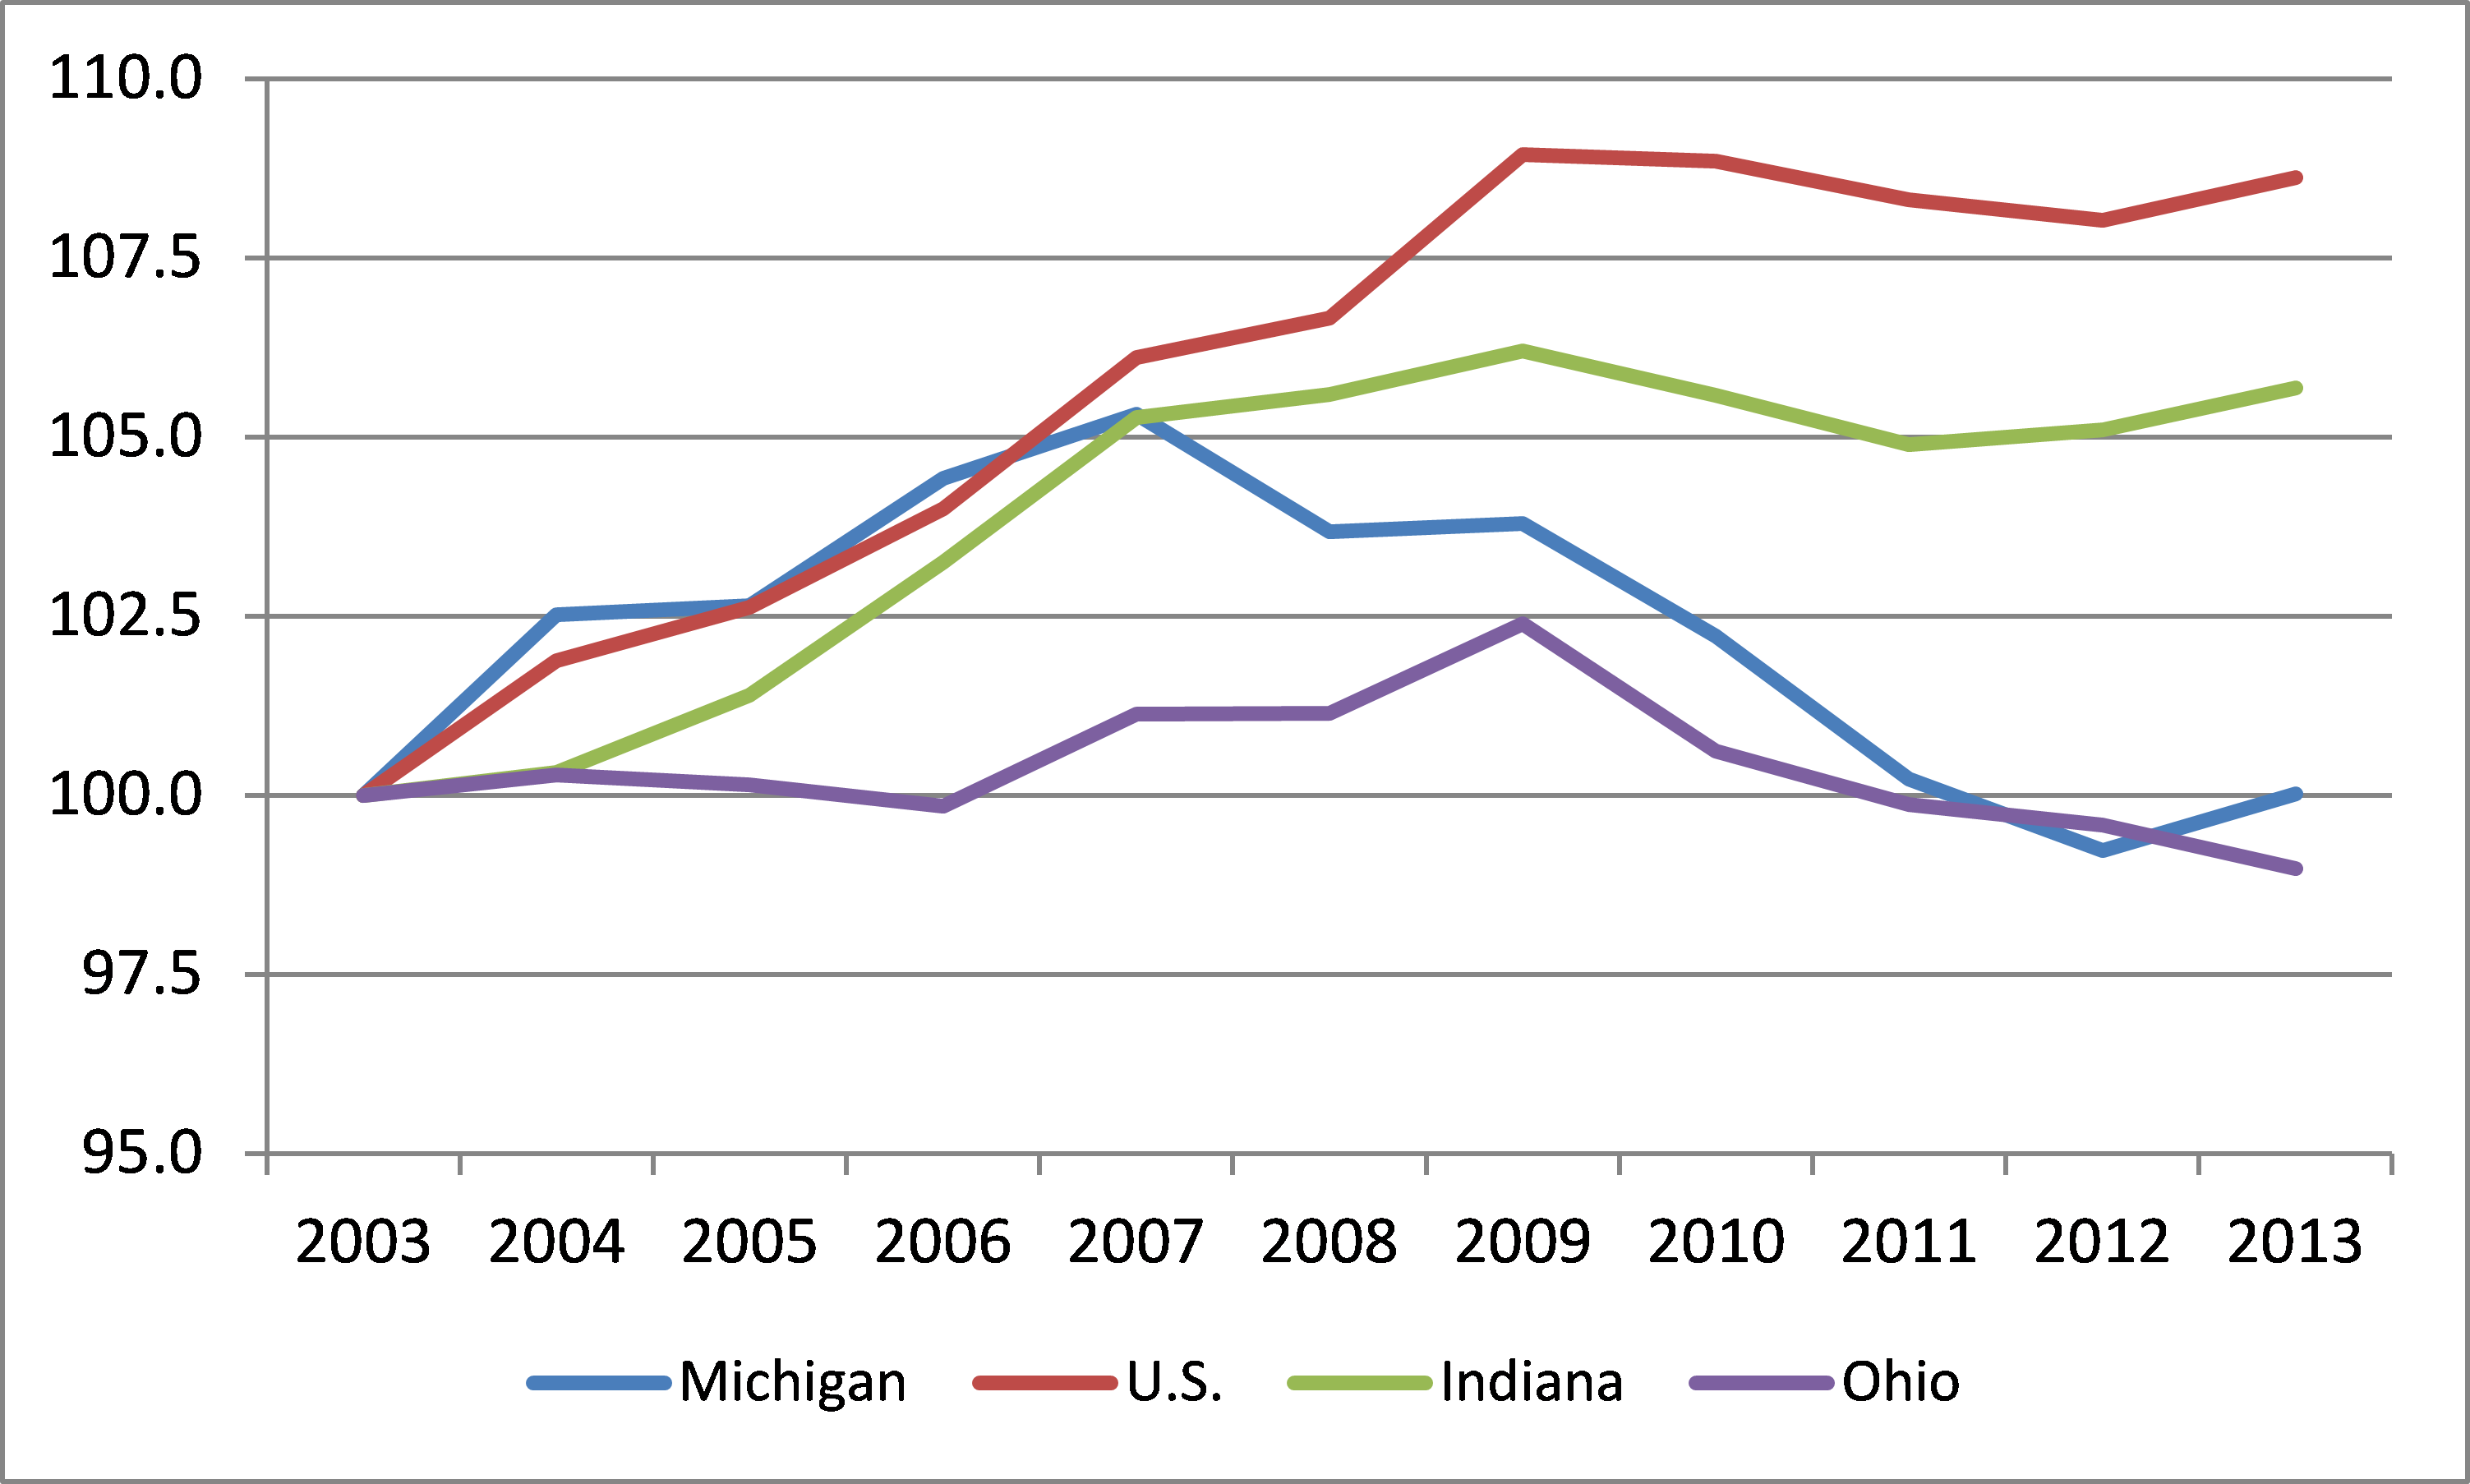
Michigan’s STEM employment growth is striking when compared with the STEM employment growth of its neighbors Indiana and Ohio, as well as the nation as a whole. Figure 2 compares STEM employment growth in these three Midwest states and the U.S. In 2003–09, STEM employment (on net) increased just under or moderately above 10% in Indiana, Ohio, and the U.S., while Michigan STEM employment decreased slightly. Since 2009, Michigan’s STEM employment growth increased at a faster rate than that of Ohio and the U.S., but at a slower rate than that of Indiana.
Figure 2. STEM employment growth in Michigan, Indiana, Ohio, and U.S., 2003–13
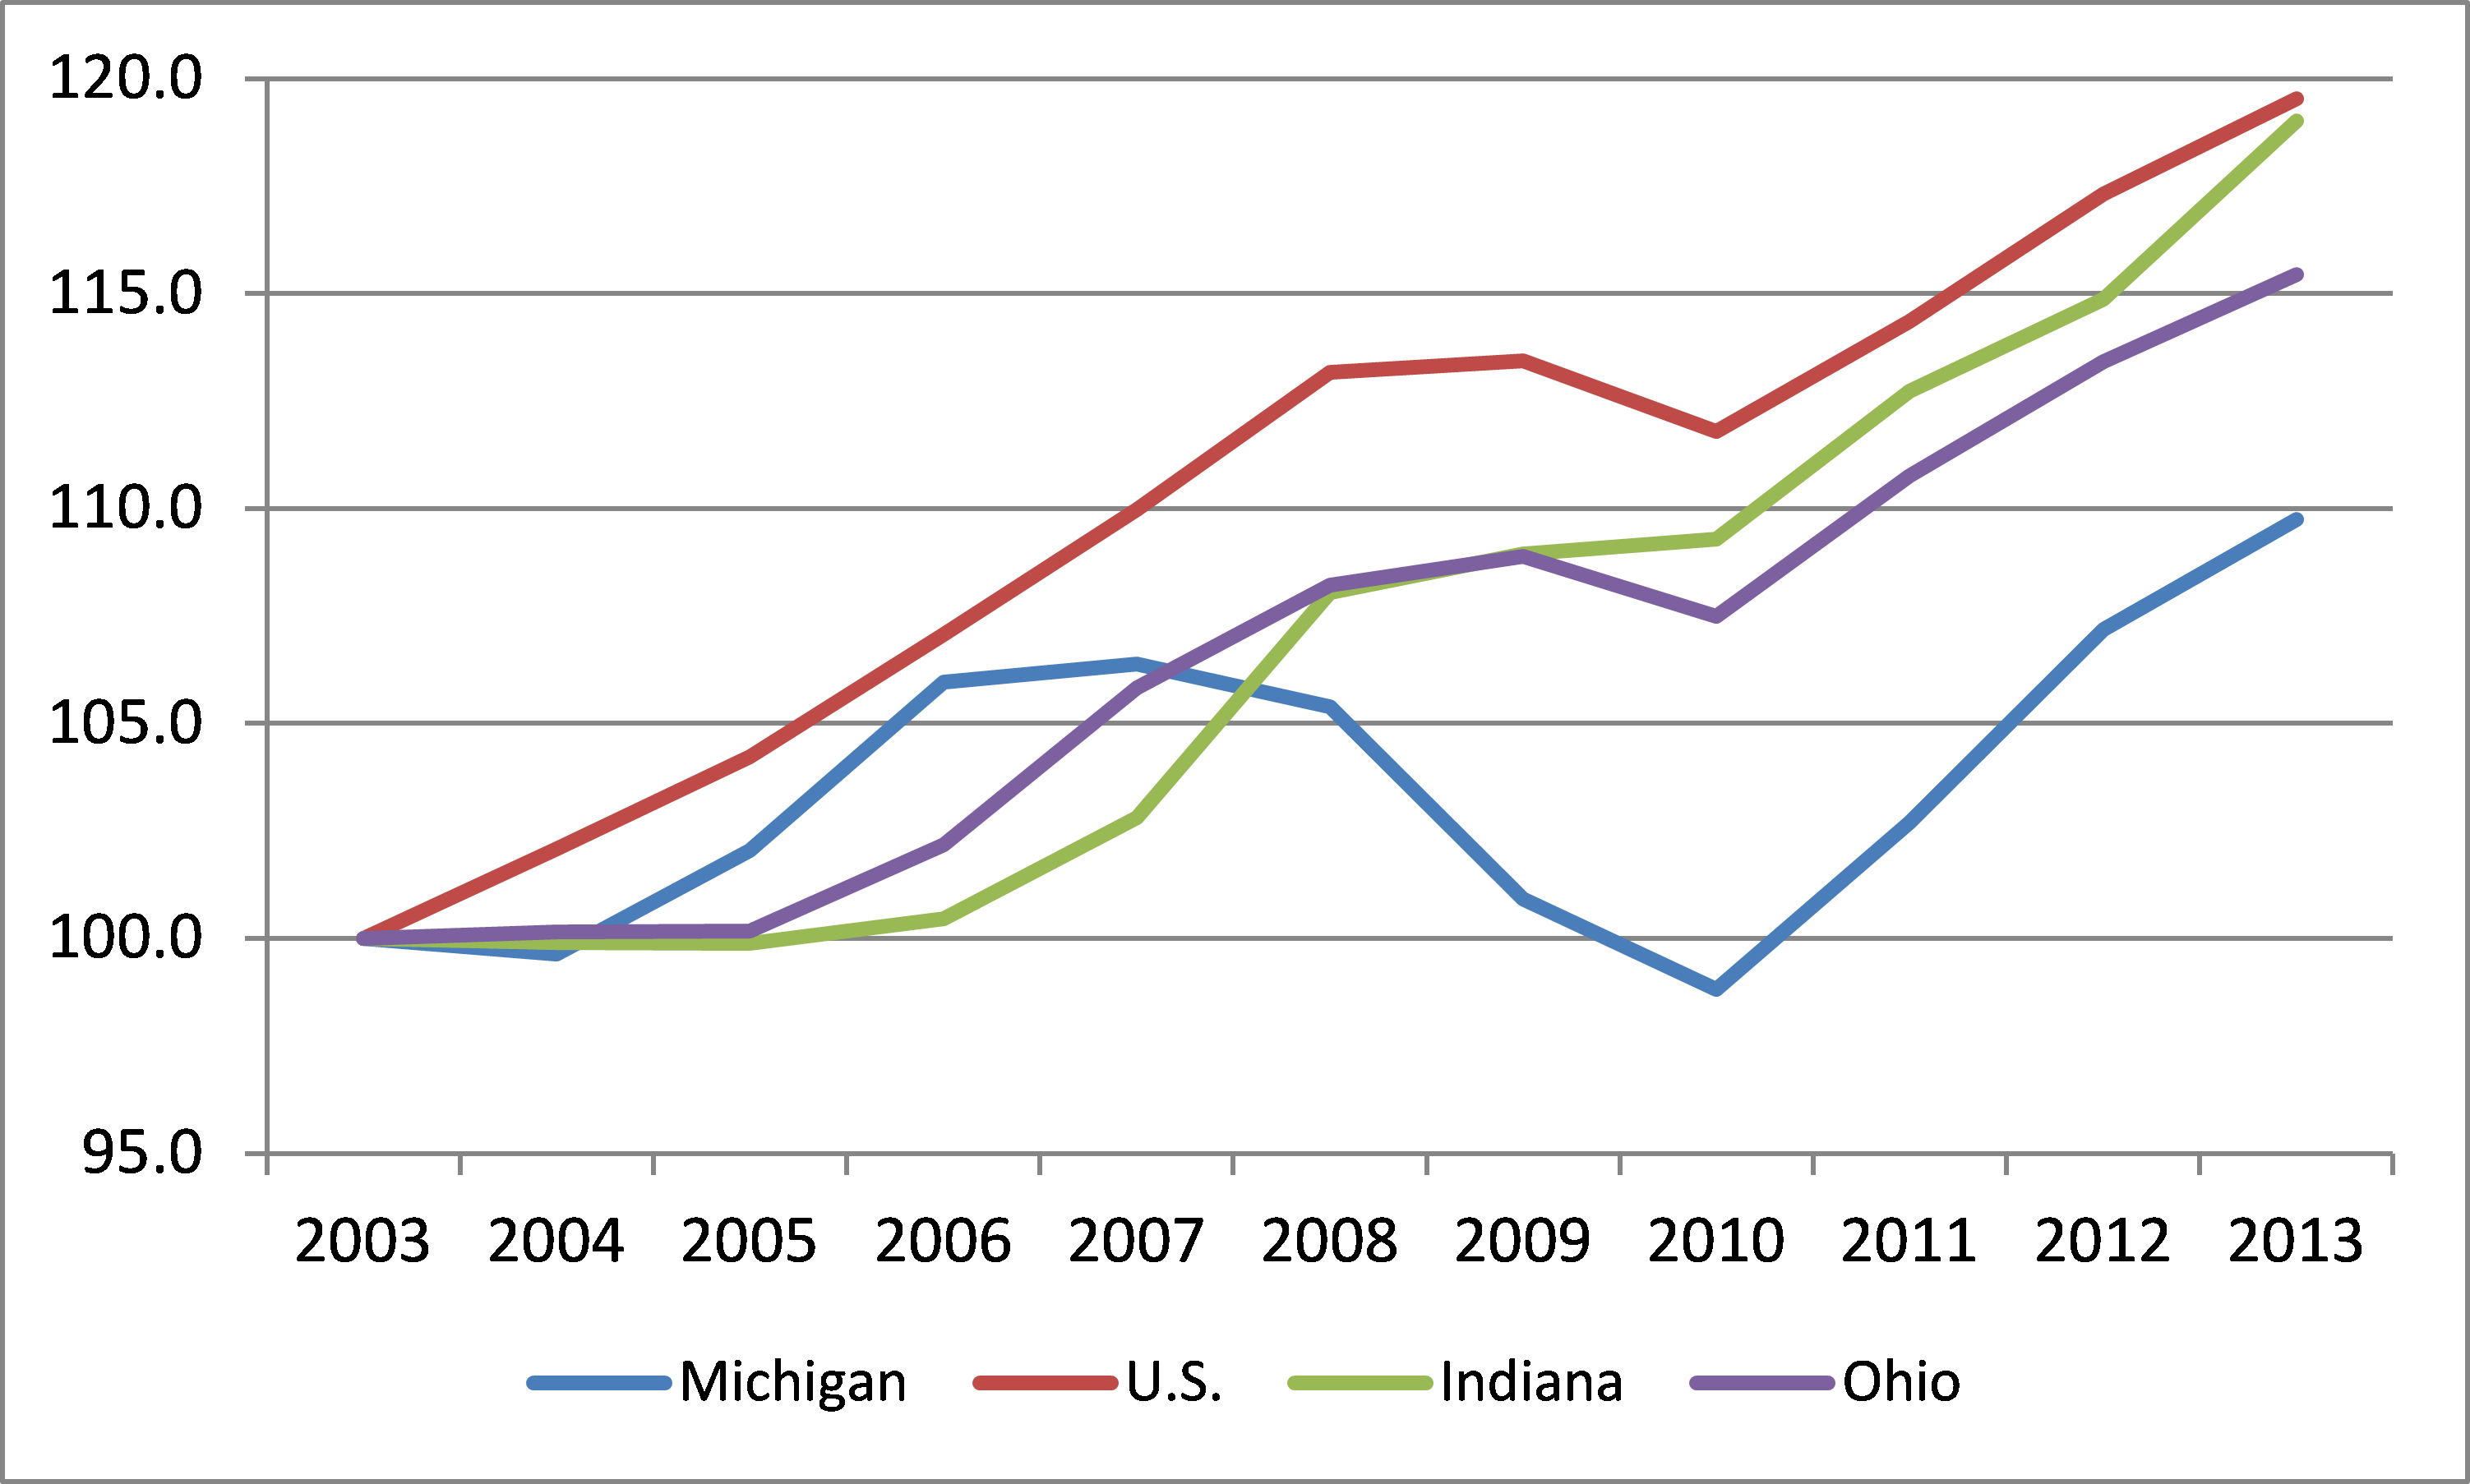
Sources: Author’s calculations based on data from Haver Analytics and the U.S. Bureau of Labor Statistics, Occupational Employment Statistics database, available online.
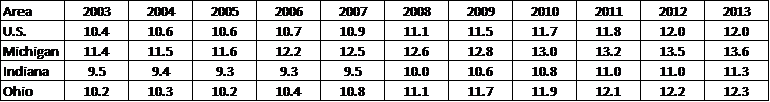
During 2003–13, the percentage of workers in STEM-related fields as a share of total Michigan employment increased from 11.4% to 13.6%. Remarkably, STEM-related employment grew as a share of total employment in Michigan during a period when the state’s overall employment decreased. Similar increases in the proportion of STEM employment were seen in Indiana, Ohio, and the U.S. The areas listed in table 1 experienced a 1.5 to 2 percentage point increase in their respective shares of STEM-related employment.
Table 1. STEM-related employment as a share of total nonfarm employment in U.S., Michigan, Indiana, and Ohio
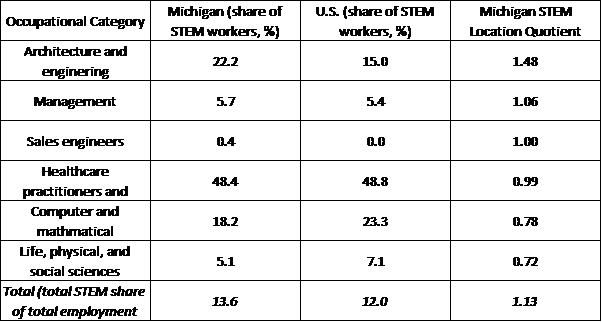
Using 2013 data from the final column of table 1, I determine that Michigan’s total work force is 13% more concentrated in STEM occupations than the nation’s by calculating Michigan’s STEM location quotient (see third column, last row of table 2). Comparing the composition of Michigan’s STEM workers with that of the nation’s helps explain this difference in concentration. To a large degree, the higher concentration in STEM employment among Michigan’s work force is due to the state’s much higher concentration of jobs in architectural and engineering occupations relative to the nation’s: The state’s STEM work force is 48% more concentrated in this occupational category than that of the nation when calculating the category’s STEM location quotient7. In contrast, Michigan’s concentrations of employment in life, physical, and social sciences occupations and computer and mathematical occupations are moderately lower than the nation’s.
Table 2. Distribution and concentration of STEM workers by occupational category in Michigan and U.S., 2013
Sources: Author’s calculations based on data from Haver Analytics and the U.S. Bureau of Labor Statistics, Occupational Employment Statistics database, available online.
Wages and income
In order to compare the wages of STEM- and non-STEM-related occupations, I divided each occupation’s STEM (or non-STEM) employment level by the total STEM (or non-STEM) employment level, calculating each occupational category’s weight. I took that weight, multiplied it by the occupation’s annual median income, and then deflated that with the Personal Consumption Expenditures Price Index from the U.S. Bureau of Economic Analysis8. Using the weighted averages, I determine the average real annual median wage for a STEM-related occupation in Michigan barely increased during 2003–13. Meanwhile, the average annual median wage for a non-STEM-related occupation decreased 5.5% over that span. Figure 4 below depicts two noteworthy trends. First, the average annual median wage of a worker in a STEM-related field increased at a faster rate during Michigan’s one-state recession (2003 through 2009) than during the Great Recession (end of 2007 through mid-2009). After 2009, annual median wages of all workers, in STEM or non-STEM occupations, remained below 2009 levels.
Figure 3. STEM- versus non-STEM- related real average annual median wage growth in Michigan, 2003–13
Source: Author’s calculations based on data from the U.S. Bureau of Labor Statistics, Occupational Employment Statistics database, available online.
Annual median incomes for STEM-related occupations in Michigan increased at a slower rate relative to those for STEM-related occupations across the entire U.S. during 2003–13, as figure 4 shows. The nation’s STEM-related occupational incomes continued to grow through the end of the national recession, while Michigan’s STEM-related occupational incomes fell during 2007–12 but then rebounded slightly in 2013. Michigan’s STEM-related real income growth performed similarly to Ohio’s, especially from mid-2009 onward; however, it performed worse than Indiana’s STEM-related real income growth over the period of study.
Figure 4: STEM real annual median income growth in Michigan, Indiana, Ohio, and U.S., 2003–13
Source: Author’s calculations based on data from the U.S. Bureau of Labor Statistics, Occupational Employment Statistics database, available online.
Conclusion
Most of Michigan’s employment gains since the end of the Great Recession have come in STEM-related occupations. However, real wage growth for STEM jobs has not rebounded very quickly since mid-2009. Meanwhile, non-STEM-related employment only started rebounding in 2012. Notable decreases in employment for specific occupations (chosen based on size) over the 2003–13 period include those in production (–20.0%), transportation and material moving (–21.8%), and construction and extraction (–38.6%), all of these being non-STEM-related fields.
The data on real wages by occupation, especially for those in STEM-related fields, are quite surprising when viewed more closely. Over the period 2003–13, annual real wages fell for computer and mathematical occupations, veterinarians, electrical engineers, and general pediatricians. But significant real wage gains were made in occupations such as chemical engineers, survey researchers, family and general medical practitioners, and physicists.
If forecasts for STEM job growth come to fruition, STEM-related fields will make up an increasingly larger percentage of total employment9. Most likely this will not be the result of just higher employment levels for STEM-related occupations as currently defined. Rather, a greater number of occupations that are not presently regarded as being affiliated with STEM may adopt STEM-based applications over time, also boosting the share of STEM-related employment. Regardless of what may happen in the future, it’s clear that Michigan workers with expertise in a STEM-related field were well served by it during 2003–13—a period that saw great volatility in Michigan’s economy.
Footnotes
1 More information is available online.
2 More information is available online.
3 More on the Great Recession is available online.
4 More information is available online.
5 More information is available online.
6 More information is available online.
7 By inference, this sharp engineering concentration is not surprising given that much of the state’s research and development strengths can be found in the automotive industries (see this blog post).
8 More information is available online.
9 More information is available online.


