Michigan’s Populated Regions Driving the State’s Unemployment Rate Lower
Michigan’s unemployment rate fell in 2017 to 4.6% for the eighth consecutive year since peaking at 13.7%1 in 2009. The drop from the peak–over 9 percentage points—is the largest recorded in any state during that time. The state’s labor market has arguably strengthened each year of its economic recovery from the Great Recession. And the size of the labor force and labor force participation rate have trended higher since 2013, after falling in each of the eight years prior to 2013.
In this blog, I look at Michigan’s household employment by county. See map and table for details of Michigan’s counties and regions2.
Map 1. Michigan counties by region
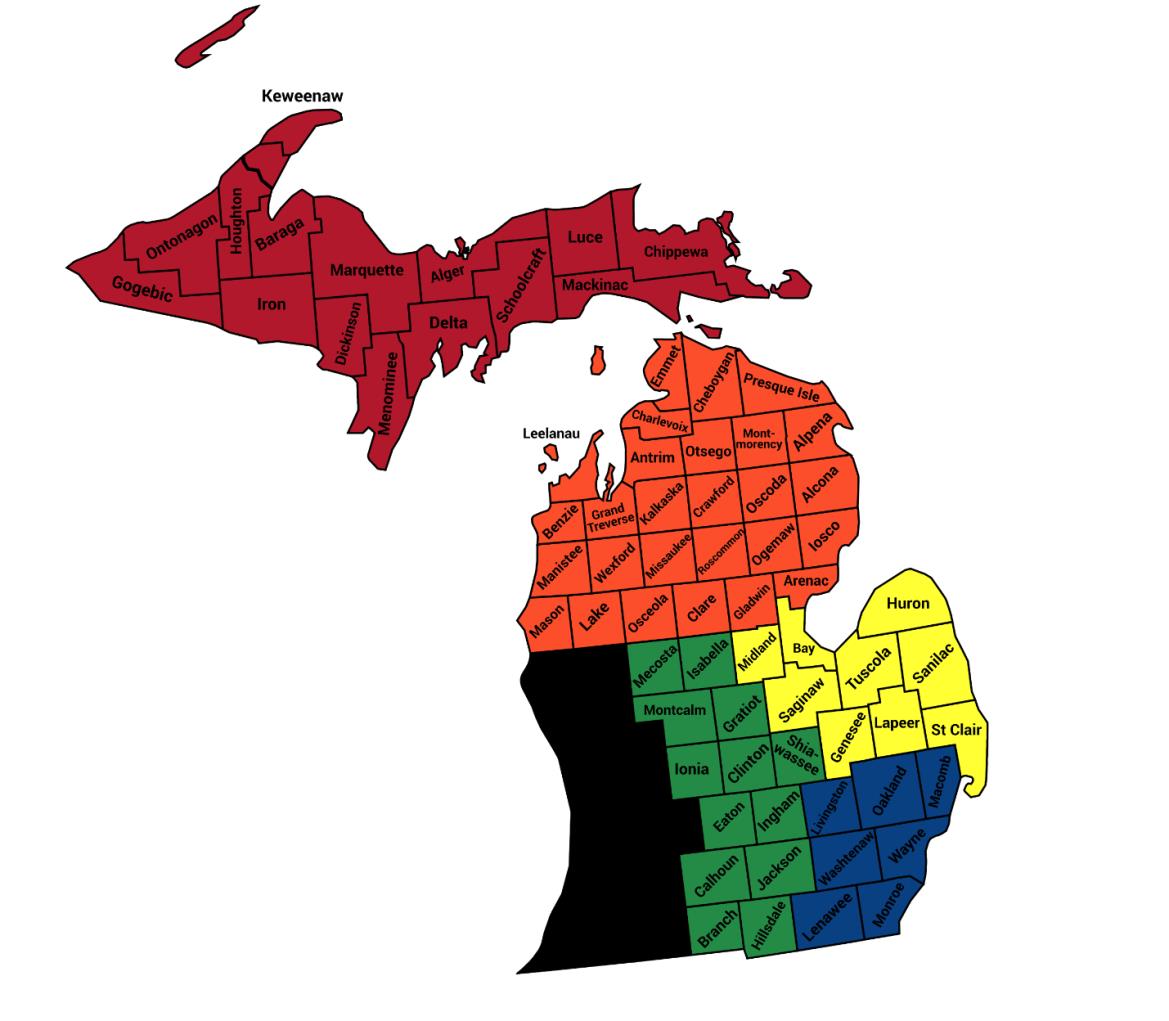
Table 1. Counties and their Michigan region

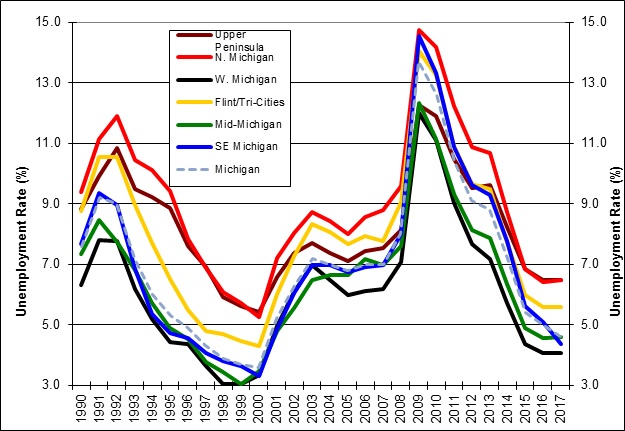
The chart shows unemployment rates by region in Michigan.
Chart 1. Unemployment Rate by Michigan Region, 1990-2017
Analysis
Looking at the chart, we can see that Michigan unemployment rates end up in the same order at the beginning (1990) and end points (2017), respectively, with some variation. Not surprisingly, the state unemployment rate tracks the unemployment rate of the most populated region, Southeast Michigan, over the period. Also, every region’s unemployment rate has failed to hit its previous low that came during the last cyclical peak in 1999-2000. But where does the tight labor market that is currently occurring in Michigan originate?
The stronger, tighter labor market in Michigan has resulted primarily from improvements in the state’s most populated regions: Southeast Michigan and Western Michigan. Southeast Michigan includes Detroit and Ann Arbor; Western Michigan includes Grand Rapids and Kalamazoo. Southeast and Western Michigan comprise almost 70% of the state’s total labor force. This has remained consistent going back to 1990. From 2009 through 2017, Southeast Michigan’s unemployment rate fell almost 10 percentage points, while Western Michigan’s unemployment rate fell almost 8 percentage points.
Michigan’s recent labor force rebound can be largely attributed to Southeast Michigan. Southeast Michigan’s labor force peaked in 2000 and started on a downward trend that finally reversed itself in 2016, though it remains at levels seen during the early 1990s. Before 2016, the increase in Michigan’s labor force came from the Western and Mid-Michigan regions, respectively.
While other regions in Michigan have seen their labor markets improve at a similar pace as Southeast and Western Michigan, the overall strength of their labor markets doesn’t match up in some areas. Mid-Michigan, the region that includes the state capital, Lansing, has seen its unemployment rate stall at 4.6% in the past two years. Immediately northeast of Mid-Michigan, the Flint/Tri-Cities Region (Bay City, Midland, Saginaw) has also seen the drop in its unemployment rate pause and it has done so at a higher rate than in the other higher populated regions in Lower Michigan. In addition, labor force levels in the Flint/Tri-Cities Region have continued to trend downward.
However, the starkest difference in unemployment rates is that between the predominantly rural regions of Michigan and their urban counterparts. Even though Northern Michigan’s unemployment rate fell more than 8 percentage points from its peak, it ticked up to 6.5% in 2017, almost 2 percentage points above the state-wide unemployment rate. Meanwhile, the Upper Peninsula saw the lowest drop in its unemployment rate relative to the other regions, falling almost 6 percentage points to 6.5% in 2017. While labor force levels in Northern Michigan have ticked up in the past couple of years, they have fallen below 1990 levels in the Upper Peninsula.
Michigan’s regional labor force participation rates provide additional context for the relative changes in regional labor market strength. The table below compares labor force participation rates in different years since the turn of the century.
Table 2. Labor force participation rates by Michigan region: 2000, 2010, and 2017
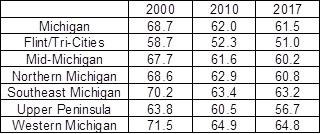
Given that Michigan has one of the older state populations3, it’s no surprise that the state’s labor force participation rate has fallen since 2000. However, Michigan’s post-2009 economic rebound helped stabilize the state’s labor force participation rate. Regionally, this has occurred in the state’s two most populous regions: Southeast and Western Michigan. However, the northern regions have continued to see drops in their respective labor force participation rates, even though the civilian labor force populations have slightly increased in Northern Michigan and stayed flat in the Upper Peninsula.
County private payroll employment data corroborate the household survey data in showing which Michigan regions have been relatively stronger or weaker than the others since 2001. The table below compares changes in employment levels by region in the major private employment sectors4 between 2001 and 2017.
Table 3. Changes in employment by Michigan region and major private employment sector, 2001-2017
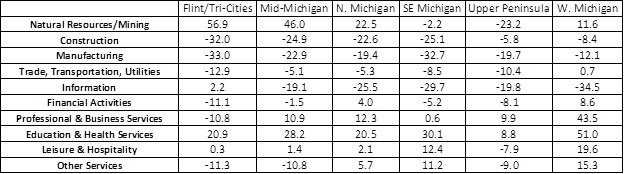
Comparing 2017 employment levels by sector with 2001 levels (the earliest data available) shows that the Flint/Tri-Cities region has the largest percentage drop for six of the sectors. Some of the percentage changes in each sector by county are astounding. Genesee County, where Flint is located, lost 56.5% of its 2001 manufacturing employment. In the same region, Bay and St. Clair counties each lost more than 40% of their respective construction base. In contrast, the Western Michigan region has the greatest percentage change in seven of the ten sectors, six of which have higher levels than 2001. As remarkably negative as some of the county-wide data in the Flint/Tri-Cities region are, the opposite is true in the Western Michigan region. Kent County, where Grand Rapids is located, experienced a 74% increase in its Education & Health Services sector and a 60% increase in its Professional & Business Services sector. Allegan County, situated in between Kent and Kalamazoo Counties, saw an 85% increase in its Professional & Business Services sector. St. Joseph County’s Education & Health Services sector almost doubled in employment. Van Buren County, which is on Lake Michigan, saw its Professional & Business Sector increase in employment 71%.
Conclusion
The large drop in Michigan’s unemployment rate mainly came from the significant decreases in the unemployment rates of its two most populated regions: Southeast and Western Michigan. Michigan’s unemployment rate has fallen for eight straight years and hasn’t been lower since the late-1990s. In addition, the state’s labor force level has rebounded, and the labor force participation rate has held steady against aging demographics. Naturally, there is cause for concern in the regions where labor force levels have continued to contract, especially where labor force participation rates have fallen despite slight to modest rises in the civilian labor force population, signs that those labor markets may have weakened structurally.
Footnotes
1 All unemployment rates are annual averages of not seasonally adjusted data.
2 Placing of counties into regions based on author’s analysis
3 See Statista.com.
4 Major private employment sectors: Natural Resources/Mining, Construction, Manufacturing, Trade/Transportation/Utilities, Information, Financial Activities, Professional & Business Services, Education & Health Services, Leisure & Hospitality, Other Services


