Has Targeting Specific Detroit Neighborhoods for Public Investment Resulted in Higher Home Values?
In this blog entry, I look at whether targeted public investments in certain Detroit neighborhoods has helped produce higher homes values in those parts of the city. Before going over the results of such efforts, first let me explain why some have considered targeted investments to be a worthwhile approach to addressing some of the city’s problems.
In 1950, Detroit’s population reached its peak of 1.8 million.1 At that time, Detroit’s land area of 140 square miles seemed appropriate for its population. Since then, Detroit has suffered a significant loss of population (a well-documented long-term trend). The U.S. Census Bureau’s 2016 estimate put Detroit’s population at 672,795.2 Detroit’s population hasn’t been that low since the 1910s (over that decade, it more than doubled from 466,000 in 1910 to 994,000 in 1920).3 Nowadays, Detroit’s footprint seems to be far too large for its number of residents. Moreover, dense clusters of population can be hard to find in Detroit’s 100-plus neighborhoods.
Over the past decade, the Detroit city government has undertaken many efforts to promote population density in the city’s neighborhoods. In 2010, then-Mayor Dave Bing announced the start of the Detroit Works Project—an effort to come up with both short- and long-term plans to improve the city. Included in this project was the provision of financial incentives for residents to relocate to more stable neighborhoods in order to deliver city services more efficiently.4 After that part of the initiative was vociferously opposed by city residents, Mayor Bing decided in 2011 to focus on a couple of smaller initiatives. First, Detroit police officers were provided financial incentives to relocate to the Boston–Edison and East English Village neighborhoods.5 Second, later in the year, Mayor Bing designated three Detroit neighborhoods as Detroit Works “demonstration areas,” which would receive increased city services. Those three demonstration areas were Bagley, Boston–Edison, and Hubbard Farms.6
So, for over six years now, the four neighborhoods of Bagley, Boston–Edison, East English Village, and Hubbard Farms have received increased investments from the city government. Arguably, the increased government service delivery and/or police presence should have made those neighborhoods more desirable places to live. And the greater desirability of these areas should be reflected in their having higher home values now. In this blog entry, I examine the changes in home sale prices in those four neighborhoods since 2011 (when Mayor Bing began his initiatives). I also explore changes in home sale prices in the neighborhoods adjacent to the four that received investments from the city since 2011 to see if targeted neighborhood funding has made a difference.
Profiles of Detroit demonstration neighborhoods7
For those unfamiliar with Detroit neighborhoods, I provide here brief profiles of the four neighborhoods of interest. For the sake of simplicity, I will refer to all four as “demonstration neighborhoods” (though technically speaking, East English Village was only targeted with incentives to bring in more police residents and not designated by the Bing administration as a “demonstration area”).
Bagley
The Bagley neighborhood is located in northwest Detroit, bordered by 8 Mile Road to the north, McNichols to the south, Wyoming to the west, and Livernois to the east. The neighborhood anchors are Sinai-Grace Hospital, Marygrove College, and the University of Detroit Mercy. Across Livernois Avenue from Bagley are the even more stable, relatively higher-income Sherwood Forest and Palmer Woods neighborhoods, which border the Detroit Golf Club. After targeted by Mayor Bing for demonstration area funding in 2011, the Detroit Future City plan highlighted northwest Detroit and the Bagley neighborhood as a primary employment area with the potential for larger-scale job growth.
Boston–Edison
Boston–Edison is bordered by Woodward Avenue to the east, Linwood Avenue to the west, Glynn Court to the north, and Edison Avenue to the south. This neighborhood was established shortly after the turn of the twentieth century, after Detroit’s elite made the trek north up Woodward Avenue from Brush Park.8 Boston–Edison is situated about halfway between struggling Highland Park and the northern edge of vibrant Midtown. Known for its wide, tree-lined avenues and large green public spaces, the neighborhood includes the Motown Mansion, the property built and lived in by Berry Gordy, Jr., when he ran Motown Records.9
East English Village10
East English Village was originally established in northeast Detroit as five ribbon farms in the 1800s. However, it wasn’t until the 1930s when home construction and migration into the neighborhood accelerated. The neighborhood’s boundaries are those that were laid out in the 1800s: Harper Avenue to the north, Mack Avenue to the south, Outer Drive to the west, and Cadieux Road to the east. East English Village is situated near the Grosse Pointes. A new secondary school, the East English Village High School, was constructed there in 2012.11
Hubbard Farms12
Hubbard Farms is situated in southwest Detroit, and is bordered by Vernor Highway to the north, Interstate 75 to the south, Clark Avenue to the west, and Grand Boulevard to the east. Hubbard Farms is named after Bela Hubbard, a geologist who became a lawyer and real estate developer. The majority of Hubbard Farms was developed in the late nineteenth and early twentieth centuries.13 The early residents of Hubbard Farms were industrial workers who worked in Detroit factories.14
Background
Before diving into the analysis, I want to provide some sense of the state of Detroit’s housing market. To this end, I present details on the types of transactions conducted in the demonstration neighborhoods and outline Detroit’s home assessment process.
Table 1. Summary statistics of home purchases in select Detroit neighborhoods, 2010–15
| Transactions | Resale % | REO Sale % | Cash % | Mortgage % | |
| Bagley | 1225 | 95.5 | 67.1 | 78.0 | 10.9 |
| Fitzgerald | 516 | 97.7 | 83.1 | 7.5 | 6.0 |
| Pembroke | 592 | 96.6 | 85.1 | 74.8 | 4.2 |
| Boston-Edison | 114 | 89.5 | 57.9 | 60.5 | 13.2 |
| LaSalle Gardens | 152 | 96.7 | 80.9 | 65.8 | 5.3 |
| East English Village | 876 | 92.0 | 62.6 | 75.9 | 11.1 |
| Morningside | 1197 | 92.6 | 77.4 | 74.6 | 5.9 |
| Hubbard Farms | 54 | 87.0 | 50.0 | 55.6 | 22.2 |
| Mexicantown | 96 | 96.9 | 62.5 | 66.7 | 17.7 |
Source: Author’s calculations based on data from CoreLogic Real Estate.
Table 1 provides some color on home sales in Detroit. Not surprisingly, all but a few of the transactions involved existing homes. Additionally, the majority of the sales involved foreclosed homes (real estate owned, or REO, sales) and was paid for with cash. Interestingly, a higher percentage of home sales involved mortgages in the demonstration neighborhoods than in the nondemonstration neighborhoods. A further look at the mortgage data reveals that, overall, home sales involving mortgages made up a higher percentage of transactions in the demonstration neighborhoods after the city government filed for bankruptcy (in July 2013) than before it did.15 A greater share of home sales involving mortgages and a lower percentage of foreclosed sales in the demonstration neighborhoods relative to the nondemonstration neighborhoods may show the degree of stability already present in the former before Mayor Bing’s initiatives began in 2011. Also, a deeper dive into the transaction data reveals that sales rose in all but one of the neighborhoods analyzed in the period 2010–15 after Detroit entered into bankruptcy protection in July 2013.
Before sharing my full analysis of the demonstration neighborhoods, I will describe the assessment process that determines the market values of homes and its implementation in Detroit. All Detroit properties are required to be assessed annually. And 30% of Detroit properties require annual on-site visits.16 Each property is assessed a reasonable market value based on local real estate market conditions. The study of housing market includes the inspection of new construction, analysis of market conditions, and observation of neighborhood advantages and disadvantages. Market conditions take into account property, neighborhood, and homeowner characteristics. Property characteristics include the age of the house, total living area, and lot size. Neighborhood characteristics consist of the number of sales, the percentage of nonresidential properties, the percentage of mixed-use properties, and other economic and social characteristics. Homeowner characteristics include whether or not the homeowner is an in-state or out-of-state owner and if the home is the owner’s primary residence.
In recent years, Detroit struggled to conduct assessments consistent with the practices outlined in the previous paragraph. In addition to the inconsistent and/or unsound practices followed by city assessors, the unhealthy local housing market contributed to the recent erratic assessments of Detroit properties. The Detroit city government was slow to react. Finally, in 2012, the Detroit Auditor General indicated layoffs in recent years and the lack of other resources contributed to the overassessments of home values.17 However, it wasn’t until after the Detroit News reported on the overassessments in 2013 that the Michigan Tax Commission opened a probe into Detroit’s assessment process. The probe, which found that the average Detroit property hasn’t been assessed in 30 years,18 resulted in the city’s effort to complete its first city-wide reassessment of property values since the 1950s. The probe finished earlier in 2017. The completion of the citywide assessment will most likely lower most of Detroit home market values further.19
Analysis
Chart 1 shows the median home sale prices in the demonstration neighborhoods versus such prices in the adjacent neighborhoods. The demonstration neighborhoods are depicted by the darker shades of colors in the graph.
Chart 1. Median home sale price, 2015: Detroit and select Detroit neighborhoods
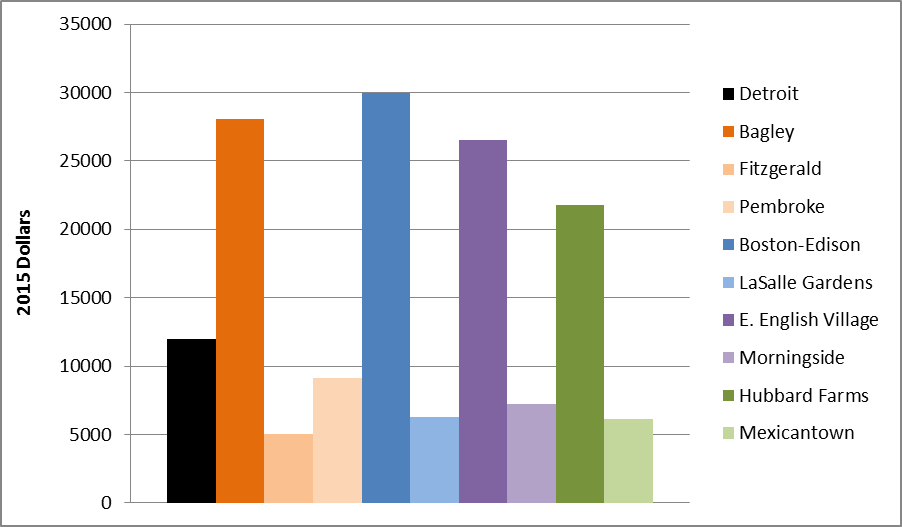
Median home sale prices of the demonstration neighborhoods were not only well above those of the adjacent neighborhoods but that of Detroit as a whole. Not surprisingly, the largest gap in median home sale prices between a demonstration neighborhood and an adjacent neighborhood is for Boston–Edison and LaSalle Gardens. As mentioned earlier, Boston–Edison was a destination for Detroit’s elite in the early twentieth century. Even during Detroit’s tougher times, Boston–Edison was still a desirable neighborhood. Meanwhile, the gap in median home sales prices between Bagley and its two adjacent neighborhoods can be explained by their respective proximity to Bagley’s neighborhood anchors (such as Sinai-Grace Hospital) and the quality of homes in each neighborhood. All four demonstration neighborhoods possess relatively strong homeowners’ associations.
Chart 2 shows the change in median home sales prices between 2010 and 2015. I use 2010 as the starting point because it is the first full year of data available.
Chart 2. Percentage change in median home sale price, 2010–15: Detroit and select Detroit neighborhoods
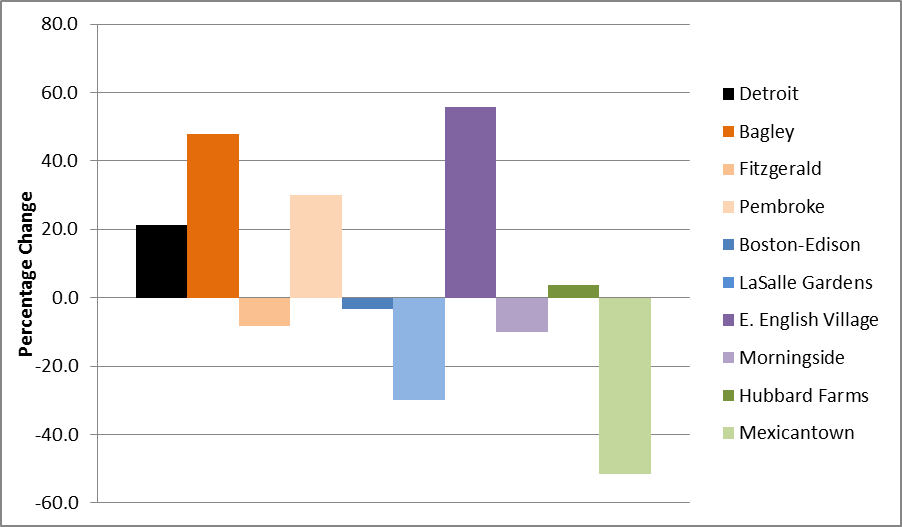
During the period 2010–15, Detroit’s median home sale price rose 21%. Over those years, Bagley and East English Village saw home prices increase more percentage wise than the city as a whole.20 Median home sale prices in all four demonstration neighborhoods outperformed those of their adjacent neighborhoods. Only four neighborhoods saw positive changes in their median home sale prices. Median home sale prices for three of the four demonstration neighborhoods (the exception being Boston–Edison) were higher in 2015 than in 2010 (before Mayor Bing’s initiatives began). The same can only be said of one of the neighborhoods used for comparison, Pembroke, which is south of Bagley in northwest Detroit. Despite these findings, it should be noted that the demonstration neighborhoods began the period with higher home sale prices than the neighborhoods adjacent to them.
Conclusion
The City of Detroit announced in 2011 that specific neighborhoods would be designated as demonstration areas receiving increased city services. That year, the city government also announced certain neighborhoods would be targeted with incentives for police to relocate to them. Following the implementation of both of those initiatives, the median home sale prices in what I’ve referred to as the “demonstration neighborhoods” rose through 2015, outperforming median home sale prices in adjacent neighborhoods. This fact does not necessarily mean that targeted neighborhood funding was entirely successful. The demonstration neighborhoods could still be benefiting substantially from their strong historical roots, which made them desirable before any city investments took place. Also, Detroit’s housing market conditions (e.g., fairly low sales activity with continued prevalence of cash and foreclosure sales) may have slanted the data in favor of the demonstration neighborhoods. However, one could argue these results helped persuade current Detroit mayor, Mike Duggan, to pursue similar initiatives in the Clark Park, Fitzgerald (analyzed above), and West Village neighborhoods.21
Footnotes
1 See this table.
3 See this article.
4 See this article.
5 See this article.
6 See this article.
7 Neighborhood geographic boundaries were determined by the author using information from here, here, and here. The neighborhoods chosen to be compared with the demonstration areas are largely residential and are not separated by a significant natural or man-made (expressway) barrier.
8 See this article.
15 The City of Detroit filed for municipal bankruptcy protection in July 2013 (and officially exited bankruptcy in December 2014).
16 See p. 6 of the Performance Audit of the Finance Department Asssessments Division.
17 See this article.
18 See p. 9 of Performance Audit of the Finance Department Asssessments Division.
19 See this article.
20 When 2016 data are included, Boston-Edison falls into this category as well.
21 See this article.


