Potential Seventh District Contenders for Amazon’s HQ2
In September 2017, Amazon announced its search for a second North American headquarters location. Ultimately, 238 North American metropolitan areas submitted bids within the six-week allotted period, including several in the Seventh District 1. In this blog, I examine the potential Seventh District contenders based on some important criteria relating to logistics, business environment, and labor force.
Amazon’s request for proposals laid out its location preferences:- Metropolitan areas with more than 1 million people
- A stable and business-friendly environment
- Urban or suburban locations with the potential to attract and retain strong technical talent
- Communities that think big and creatively when considering locations and real estate options
In the Seventh District, the metropolitan areas with a population of greater than 1 million are Chicago, Detroit2, Grand Rapids, MI, Indianapolis, and Milwaukee.
Logistics
The table below shows that each of the Seventh District’s metropolitan areas with more than 1 million residents fulfills most or all of Amazon’s other logistical preferences, though to varying extents.
Table 1: Seventh District MSAs and Amazon’s Logistical Requirements3
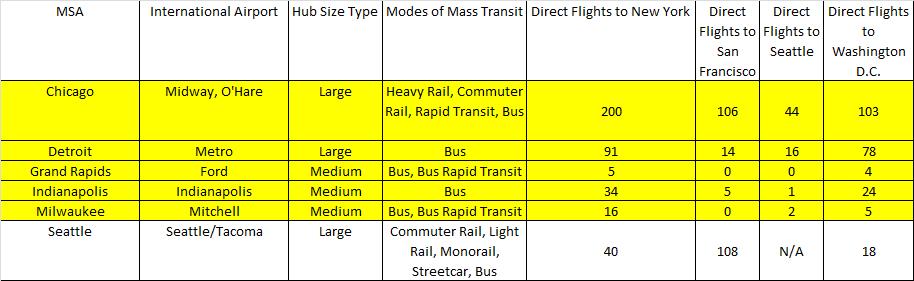
Chicago possesses the flexibility for Amazon to locate anywhere in its metro area because of the various modes of mass transit available to Chicagoland commuters. Milwaukee’s bus rapid transit lines offer some flexibility as well as to potential HQ2 locations. Chicago and Detroit provide an adequate number of air connections to Amazon’s most important North American metropolitan areas. In addition, O’Hare and Detroit Metro Airports are large enough to potentially adjust operations and increase connections.
Logistics also include freeway networks and the ability of employees to navigate freeways. The work/life balance is disrupted the longer one spends stuck in traffic. The table below shows how the Seventh District metropolitan areas with more than 1 million people rank relative to other major North American metropolitan areas with regard to how many hours one spends in congested traffic annually.
Table 2: Select North American Metro Areas by Traffic Congestion4

While it may not seem like it, especially during road construction season, Seventh District metropolitan areas rank favorably on congestion, relative to population size. What Detroit and Indianapolis lack in mass transit, they compensate for with the number of freeway connections. However, according to the 2015 American Community Survey (ACS), Chicago and Detroit have higher drive and total commute times than the national average in each category. Per the ACS, the percentage of Chicago commuters that utilize some mode of mass transit is slightly above 10%, similar to that of Seattle.
Business Environment
Amazon’s second location requirements include a stable and business-friendly environment. States with more business-friendly tax climates tend to use their corporate tax structure as an incentive to attract new business. The table below shows how Seventh District states rank in the 2017 Overall and Corporate Business Tax Climate Index.
Table 3: Ranking of Select U.S. States in the 2018 Overall and Corporate Business Tax Climate Index5
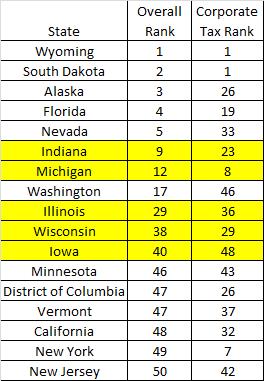
The overall rankings of the Seventh District states compare favorably relative to some states with sites that are considered top contenders for Amazon HQ2 such as Minneapolis, MN and Washington D.C., which are included in the above and remaining tables. Indiana and Michigan rate in the top half, helped by the fact they have the lowest flat individual income and corporate income tax rates among the Seventh District states6. Illinois fell out of the top half in the most recent annual update to the rankings. Meanwhile, Michigan has moved into the top 10 overall.
Theoretically, business activity levels should increase if the state is relatively friendlier to business. One could surmise that a greater number of businesses would place their corporate headquarters in a state that ranks as more accommodating to business. The chart below plots a state’s corporate tax climate ranking versus the number of Fortune 500 companies headquartered in that particular state.
Chart 1: Corporate Business Tax Climate Index Ranking vs. Actual and Predicted Fortune 500 Headquarters
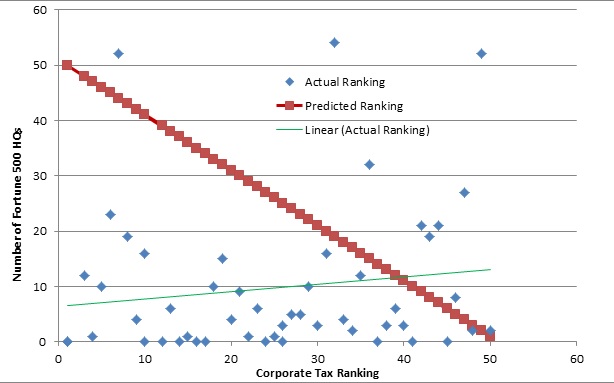
As shown by the green trend line on the chart, there’s actually a slight positive relationship between a state’s corporate tax climate index ranking and the number of Fortune 500 companies headquartered there. The lower the state is ranked, the greater the number of corporate headquarters located in that particular state. That’s the opposite of what one would expect, which is the red dotted line on the chart above.
So if a state’s overall business tax climate doesn’t impact where a corporation will locate its head offices, what variable does influence those decisions? Another example of a state with a business-friendly environment is one that offers incentives to help influence companies’ location decisions. The table below displays how the Seventh District states with eligible metropolitan areas compare with others in that dimension.
Table 4: Annual Business Incentives Per Employee
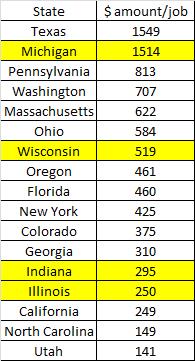
By this measure, Michigan ranks highly relative to sites in states that many analysts think have major contenders to land Amazon’s HQ2 such as Austin, TX; Philadelphia, PA; Boston, MA; Portland, OR; Denver, CO; Atlanta, GA, San Francisco, CA; Raleigh, NC; and Salt Lake City, UT. Michigan is noticeably more generous with incentives than other Seventh District states. A major reason companies seek incentives is to offset tax liabilities. The Upjohn Institute created a database with national tax and incentive data, as well as state tax and incentive data for 33 states across 45 industries over the past 26 years. From the database, one can determine the magnitude of a state’s tax liability and incentive for a given industry as a percentage of that industry’s economic value-added. Then, by taking the incentive percentage (of its value-added) for a given state and dividing that by its tax percentage (of its value-added), one can determine to what extent a state’s incentives offset an industry’s tax liabilities in that specific state. The table below compares state tax liabilities and incentive offerings as a percentage of their respective value-added, along with the percentage of state tax liabilities covered by incentive offerings for some of the Amazon HQ2 contenders and the U.S. overall.
Table 5: Incentives and Taxes by U.S. and Select State, 20157.
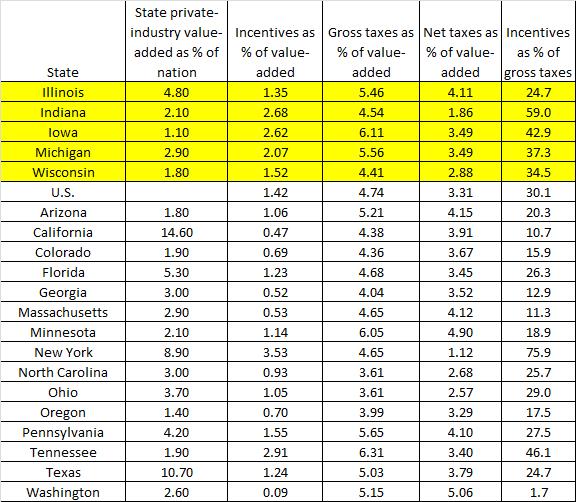
Except for Illinois, the Seventh District states rank favorably relative to other states when looking at incentives as a percentage of state’s value-added and as a percentage of a state’s gross taxes. Having a greater percentage of its gross tax liabilities offset by incentive offerings would likely make a state more attractive to a business. Another takeaway from the table is that it doesn’t follow the previous table that showed incentives per job. Texas may have the highest incentive per job, but its incentive offerings constitute a relatively low percentage of its value-added. Conversely, Indiana possesses a relatively low incentive amount per job, but incentives offset almost 60% of its gross taxes. Lastly, Washington stands out for being a relatively high tax, low incentive state that lags significantly behind the other contending states.
Talent
Amazon has stated that it “will hire as many as 50,000 new full-time employees with an average annual total compensation exceeding $100,000 over the next 10-15 years, following the commencement of operations.”8 In order to fill that many positions, Amazon will need to attract and retain highly skilled workers. That requires access to a college-educated population, including a substantial number with degrees in science, technology, engineering, or math (STEM) fields. The table below compares the Seventh District candidate metropolitan areas with other contenders on the relative education level of the adult population, as well as the percentage with a science or engineering background.
Table 6: College-educated Population in Select U.S. Metropolitan Areas
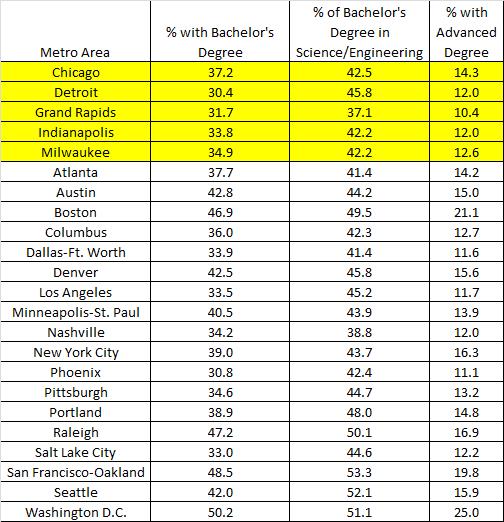
Among the group above, the Seventh District metropolitan areas don’t match up well. The Michigan metros don’t rank well when looking at the percentage of the population that possesses a bachelor’s degree. Grand Rapids ranks last when looking at the percentage of population with an advanced degree. Some of the areas known for their ability to retain and attract talent stand out in the table above. Washington D.C., San Francisco-Oakland, Raleigh, and Boston have world-class universities and globally renowned employers that require and need the best and the brightest.
Of course, not all STEM fields require a bachelor’s degree. Certain occupations in manufacturing and information technology only require a two-year degrees or specific certification. The table below shows the Seventh District candidate cities’ STEM employment relative the same group of U.S. cities listed in the previous table.
Table 7: Percentage of Employees in STEM9 Occupations; Seventh District and Select U.S. Metropolitan Areas
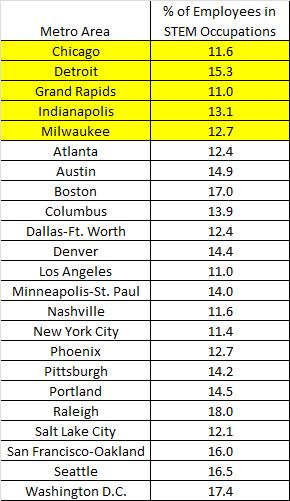
By this broader measure, the Seventh District metropolitan areas compare more favorably with their peers. Detroit, Indianapolis, and Milwaukee have higher percentages of employees in STEM occupations than the U.S. average. Of the group of metro areas listed above, Detroit ranks behind just five of them.
An important factor in attracting talent is a relatively low cost of living. The next table examines the gross median rent in the Seventh District metro areas and select U.S. metros. Also, the table lists the gross median rent as a percentage of median household income in each metro area.
Table 10: Median Rent and its Percentage of Median Household Income
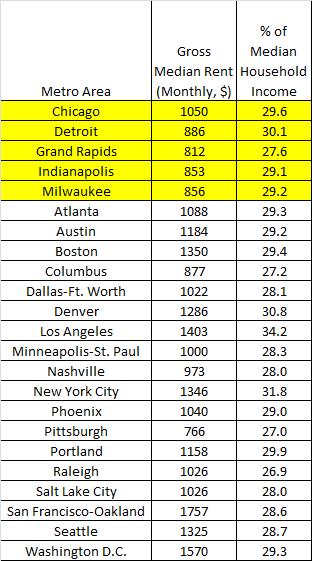
While there’s a noticeable disparity in the monthly rents among the metro areas, the range considerably tightens when looking at the percentage of household income that is devoted to rent. Detroit has one of the lowest monthly rents, but it comprises a relatively high percentage of household income because of Detroit’s relatively low median household income. Meanwhile, the Washington D.C. metro area, known for its relatively high housing costs, has a median rent almost twice that of Detroit, but it comprises a lower percentage of the metro’s median household income because the metro area has a higher median household income. Among the Seventh District metro areas, rents in Grand Rapids make up the lowest percentage of household income.
Potential Amazon Sites in the Seventh District Cities
Do you have an eight million square foot piece of land to spare in your metro area? That’s what Amazon is asking for their HQ2 site. Amazon requires an initial space of 500,000 square feet that can expand to as large as eight million square feet in order to accommodate the number of employees they plan to have working at their HQ2. Where would Amazon place their HQ2 in each of the Seventh District’s large metro areas? Potential Seventh District contenders have suggested particular sites that could accommodate Amazon’s HQ2.
Chicago
Chicago proposed ten sites that could accommodate Amazon’s new headquarters. They were revealed to the public and can be viewed here. A couple of the sites stand out for different reasons. The Downtown Gateway District site, which includes the old Post Office building, contains move-in-ready buildings, but would also allow Amazon to design its own headquarters. Outside of Downtown, the River District site would also give Amazon some autonomy in designing its headquarters without having to undertake the kind of massive redevelopment effort that some of the other proposed sites would require.
Detroit
The executive summary of Detroit’s Amazon proposal offers few surprises. Dan Gilbert, Chairman and Founder of Rock Ventures and Quicken Loans, was appointed to lead Detroit’s bid for Amazon, which includes Windsor, Ontario, Canada, just across the Detroit River. Gilbert owns 95 Downtown Detroit buildings, giving Downtown Detroit flexibility to move things around if it were to be chosen by Amazon. One potential complex is the now open space that was supposed to have Wayne County’s new jail, and then was bought by Gilbert with much talk surrounding a soccer stadium. With the old jail site on one end and Gilbert’s proposed skyscraper on the old Hudson’s department store site on the other, this location could be attractive. Of course, Detroit doesn’t have a shortage of vacant space that Amazon could build to use. However, Detroit doesn’t have the extensive mass transit system that would allow relatively easy access to some of the larger vacant sites.
Grand Rapids
Grand Rapids hasn’t given any clues publicly as to where it has proposed Amazon would locate within the area. However, the relatively small size of the metro area means it only takes 15-20 minutes to drive from any corner of Greater Grand Rapids into downtown. The metro area includes plenty of space around Holland, only a 35 minute drive from Downtown Grand Rapids, and Grand Valley State University in between.
Indianapolis
Indianapolis didn’t make their Amazon bid public either. Indianapolis may arguably have the most shovel-ready location that would not just fulfill Amazon’s initial 500,000 square foot requirement, but go a long way toward hitting the eight million square foot target. The site used to have a General Motors stamping plant, which it was demolished in 2013. It is located in Downtown Indianapolis on the White River, just across from the central business district and IUPUI, and has relatively easy access to the city’s freeway system. The old GM site has been talked about publicly by city stakeholders.10 As with Detroit, in Indianapolis, a less extensive mass transit system limits where Amazon could go.
Milwaukee
Milwaukee’s bidding group didn’t reveal its Amazon bid publicly. However, according to the local press, two sites in Walkers Point were included.11 Walkers Point lies immediately south of Milwaukee’s central business district, contains old industrial sites, and provides access to freeways and Milwaukee’s bus rapid transit system. In addition, one would expect potential locations to be identified in the vicinity of Milwaukee’s airport, which is south of the central business district.
Conclusion
If Amazon were to choose a Seventh District location for HQ2, where would it be? Looking at all of the variables, the most likely Seventh District metro area to attract Amazon would seem to be Chicago. However, if Amazon wanted to transform a community, then Detroit or Milwaukee might be more appealing. If Amazon preferred the most shovel-ready site, then Indianapolis could merit greater consideration. Grand Rapids could emerge as a candidate if Amazon were to place greater weight on its ability to work with local stakeholders, as well as having their employees enjoy a relatively low cost of living. Amazon plans to make an announcement sometime in 2018.12
Footnotes
1 The Seventh Federal Reserve District serves a five-state region, comprising all of Iowa and most of Illinois, Indiana, Michigan and Wisconsin.
2 Although Detroit submitted a joint regional bid with Windsor, Ontario, Canada, the statistics I cite here are for the Detroit MSA.
3 See Information on Airport Hub Size Type from the FAA, number of Direct Flights from October 24, 2017 using the By Route tab at this website. Airport data includes all commercial metropolitan airports, i.e., New York consists of Kennedy, La Guardia, and Newark airports. Seventh District locations are highlighted.
4 Population data from the U.S. Census Bureau, Traffic data from INRIX. Seventh District locations are highlighted.
5 The overall ranking of the State Business Tax Climate Index is derived from five components: state income tax, sales tax, corporate tax, property tax, and unemployment insurance tax. The corporate tax has the third heaviest weight of the five components at 19%. The corporate tax subindex is divided into three of its own subindexes. The first subindex revolves around the structure of a state’s corporate tax rate, its level, and how many brackets and how quickly does a corporation’s tax liability reach the highest bracket. The second subindex examines variables related to the corporate tax base, such as the caps and number of years allowed for carryback and carryforward, gross receipts tax deductions, and whether or not the state has an alternative minimum tax. The final subindex studies the size and effectiveness of tax credits. Seventh District locations are highlighted.
6 See p. 59 and p. 64 of the 2018 State Business Tax Climate Index.
7 Table reports present value of incentives, gross state and local business taxes, and net business taxes after incentives, all calculated as percent of present value of value-added. All incentive and taxes are weighted average, using value-added weights, across all 31 export-base industries, for a new facility starting up in 2015. Table also reports the state’s share of private value-added, which is used to create national averages across these states. Incentives as a percent of gross taxes are simply ratio of the two other columns. All present value calculations use 12 percent real discount rate, and consider facility with life of 20 years. The U.S. incentive percentage is weighted by a state’s gross state product. Seventh District locations are highlighted.
8 See p. 2 of the Amazon HQ2 RFP.
9 The criteria to define STEM- and non-STEM-related occupations were taken from the U.S. Census Bureau. Available online.
10 See this article.
11 See this article.
12 See p.1 of the Amazon HQ2 RFP.


