Detroit Economic Growth Fell Below Trend in March, According to Chicago Fed Index
The Chicago Fed’s Detroit Economic Activity Index (DEAI) was –0.38 in March, down from +0.13 in February. The index averaged +0.55 over the past year, which is above its long-run average. An index value greater than zero points to the city of Detroit’s economic activity growing faster than trend, while an index value less than zero points to the city’s economic activity growing slower than trend. The complete history of the index through March 2019 is shown below (chart 1). Despite the below-trend monthly value, a comparison of the three- and 12-month averages of the DEAI in March implies that growth in Detroit’s economic activity over 2019:Q1 was better than over the past year.
Chart 1. Detroit Economic Activity Index (standard deviations from trend)
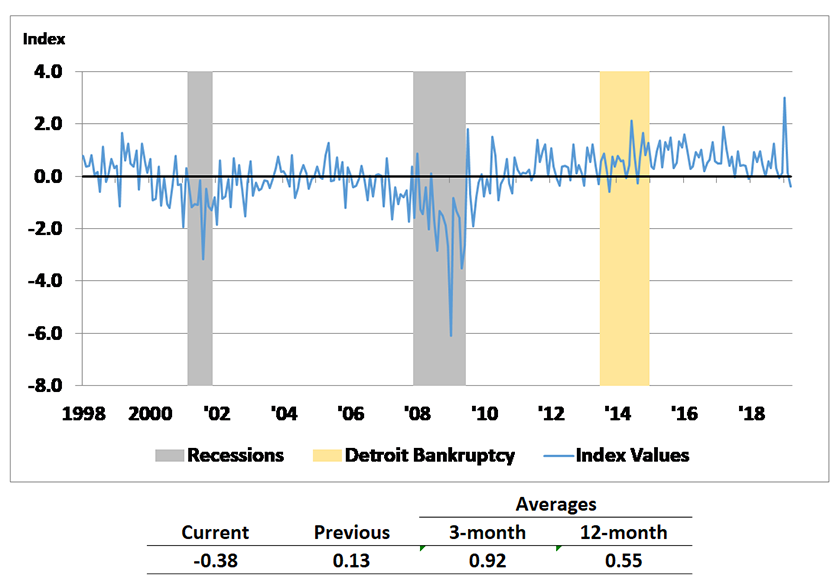
Table 1 shows the contribution to the DEAI from each of the index’s four major categories (income, labor, real estate, and trade), as well as the contribution(s) of the monthly series making the largest contribution(s) under each category in March. The real estate category was the only category providing a positive contribution to the index in March. Real estate’s positive contribution was based chiefly on increases in median home and condo prices, as well as a rise in nonoffice rents, in March. The largest contributor to the real estate category in March was the median home price, which increased a whopping 17% compared with February on an inflation-adjusted seasonal basis. The positive contribution to the index from real estate was more than offset by the negative contribution from the labor category—largely due to a rise in the seasonally adjusted unemployment rate to 9.1% in March from 8.2% in February (a jump of nearly 1 percentage point).
Table 1. Contributions to the DEAI
| March 2019 | February 2019 | Change from February to March | |
|---|---|---|---|
| Income | 0.00 | 0.00 | 0.00 |
| – DTE residential customer count | 0.00 | 0.00 | 0.00 |
| Labor | -0.61 | 0.05 | -0.66 |
| – Employment | -0.08 | -0.12 | 0.05 |
| – Unemployment | -0.54 | 0.18 | -0.71 |
| Real estate | 0.23 | 0.11 | 0.12 |
| – Median home price | 0.18 | 0.05 | 0.14 |
| Trade | -0.01 | -0.03 | 0.03 |
| – Exports | -0.02 | 0.00 | -0.02 |
| – Imports | 0.01 | -0.04 | 0.05 |
The monthly rise in the unemployment rate and this rate’s negative contribution to the index in March can be explained by the fact that the labor force grew in March while the number of employed workers was, more or less, unchanged. This caused the number of unemployed workers to grow by 12% from February to March. While an increase in the number of unemployed may be considered a negative development, the fact that more workers are entering the labor force is a good sign.1
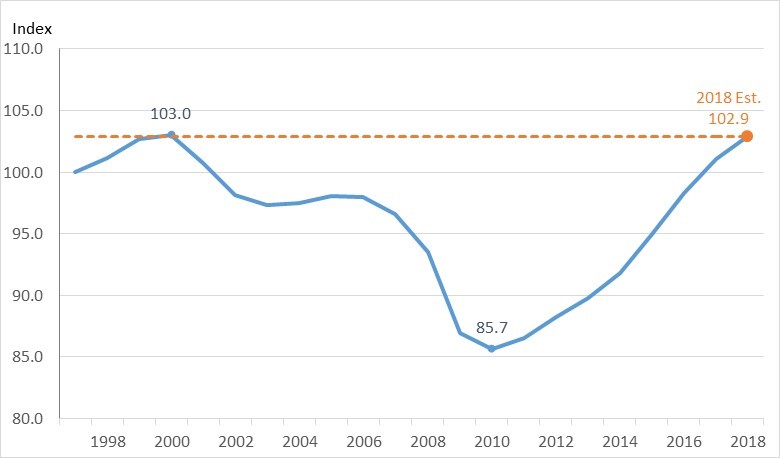
Incorporating the gross metropolitan product (GMP) data for the Detroit–Warren–Dearborn metropolitan statistical area (MSA), the DEAI model estimates that real Detroit gross city product, or GCP (see chart 2), has recovered almost all of what it lost during the 2001 and 2008–09 recessions. In fact, Detroit GCP grew faster than U.S. gross domestic product (GDP) for three consecutive years (2015–17) following the 2008 recession. Based on the latest data for 2018, the DEAI model now projects a 2018 growth rate of 1.9% for the city of Detroit—slightly higher than the 1.8% growth rate for 2018 that the model predicted back in March of 2019. While still above trend, the city’s growth rate for 2018 is estimated to be somewhat slower than the nation’s (2.9%).
Chart 2. Detroit gross city product (index – 1997 = 100)
The June DEAI release (covering the second quarter of 2019) will be posted on September 5, 2019. The release’s data and future release dates can be found on the DEAI page of the Federal Reserve Bank of Chicago website. A copy of the March DEAI release and a summary of each individual component’s contribution to the index can be found here.
Notes
1 The labor-related values referenced in this paragraph have all been seasonally adjusted, and they have also been adjusted for breaks in their time series resulting from the decennial censuses.


