Detroit Economic Growth Decreased Substantially in March to Its Lowest Level Since the Great Recession, According to Chicago Fed Index
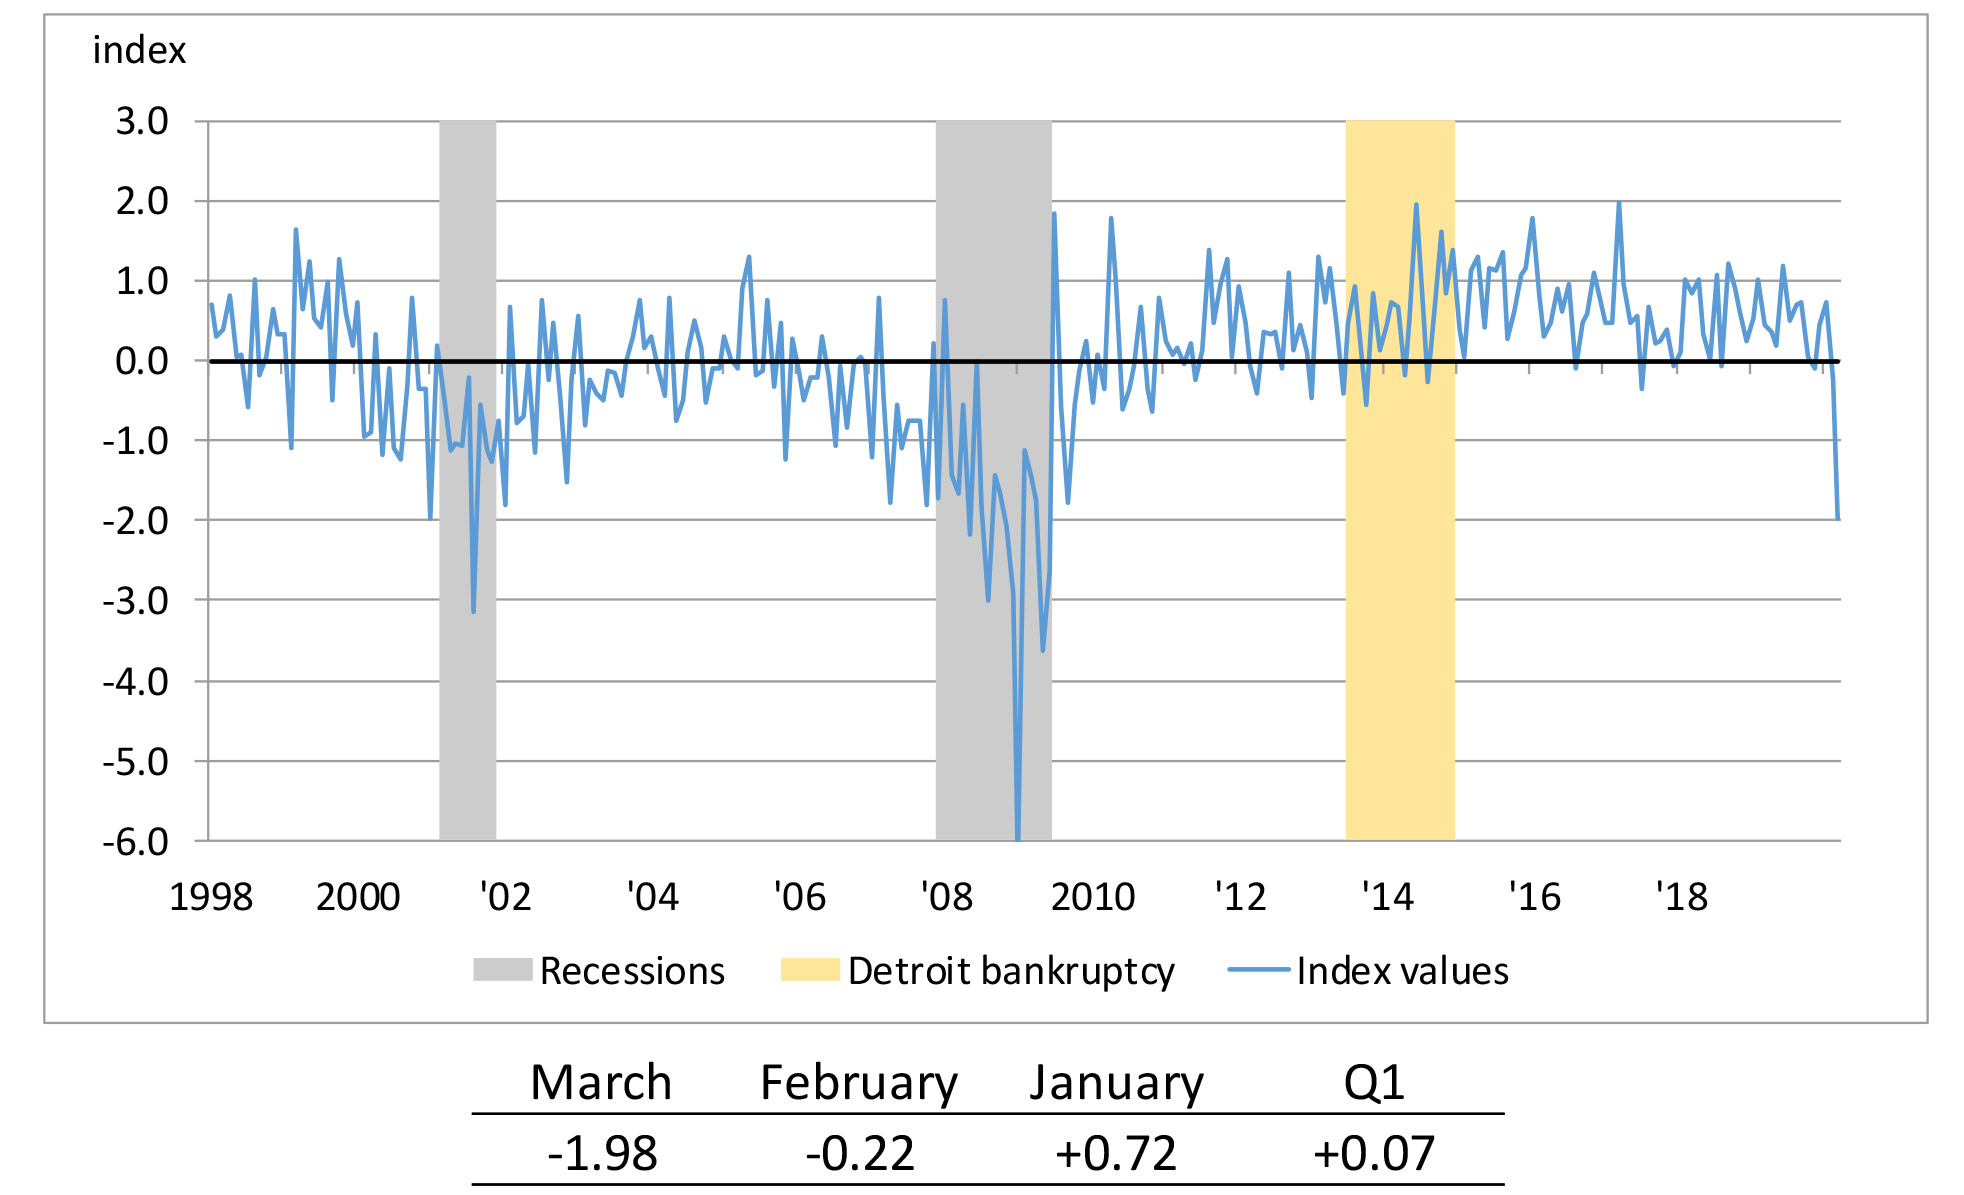
The Chicago Fed’s Detroit Economic Activity Index (DEAI) was –1.98 in March 2020. For the entire first quarter of 2020, the DEAI value was +0.07.1 The DEAI’s value in March reflects the severe impact of the Covid-19 pandemic on the city’s economic activity. While Detroit’s population makes up just 6.7% of Michigan’s total population, Detroit accounts for 19.2% of all confirmed Covid-19 cases and 24.9% of Covid-19-related deaths recorded in the state, according to data collected through June 1, 2020.2 Moreover, the DEAI’s March 2020 value was the lowest monthly reading since June 2009 (–2.63)—the final month of the Great Recession, as defined by the National Bureau of Economic Research. An index value greater than zero points to the city of Detroit’s economic activity growing faster than trend, while an index value less than zero points to the city’s economic activity growing slower than trend. The complete history of the index through March 2020 is shown below (chart 1). Detroit’s economic growth started out strong in 2020, with a high monthly DEAI value in January (+0.72), but the index declined below its long-run trend in February (–0.22) and fell even further in March (–1.98) as the coronavirus spread. That said, the DEAI was still positive for the first quarter of 2020, implying that Detroit’s economic growth stayed above its long-run trend for the quarter as a whole (see note 1 for how the first quarter DEAI is calculated from five monthly growth rates).
Chart 1. Detroit Economic Activity Index (standard deviations from trend)
To explain in more detail what transpired in 2020:Q1, I present in table 1 the contribution to the DEAI from each of the index’s four major categories (income, labor, real estate, and trade).
The income category made a small positive contribution (+0.01) to the DEAI in March. The real estate category also made a positive contribution (+0.08) to the index, mostly because the city’s median single-family home price increased in March from February. The labor category’s negative contribution (–1.72) to the DEAI was the lowest since June 2009 (–2.36), as Detroit’s employment fell and its unemployment rate rose to 9.7% in March from 7.7% in February.3 The trade category made its lowest contribution (–0.35) in the index since May 2009 (–0.37). This is explained by the fact that on a seasonally adjusted basis, total trade (i.e., exports and imports combined) dropped 13.0% in March from February. This was the largest month-over-month decline in total trade since August 2014 (when there was a 14.8% drop). A summary of the 24 individual data series’ contributions to the index’s March 2020 value (and 2020:Q1 value) is available on the DEAI’s current data webpage.
Table 1. Contributions to the Detroit Economic Activity Index
| Categories | March 2020 | February 2020 | January 2020 | 2020:Q1 |
|---|---|---|---|---|
| Income | +0.01 | +0.01 | +0.01 | +0.01 |
| Labor | –1.72 | –0.32 | +0.80 | +0.10 |
| Real estate | +0.08 | +0.15 | –0.10 | +0.04 |
| Trade | –0.35 | –0.06 | +0.01 | –0.08 |
The June DEAI release (covering the second quarter of 2020) will be posted on September 3, 2020. The most recent DEAI results and future release dates can be found on the DEAI page of the Federal Reserve Bank of Chicago website. A copy of the March DEAI release can be found here.
Notes
1 The quarterly and annual averages we report for the DEAI are not “simple” averages, but instead “triangle” averages of the monthly values. For growth rate measures like the DEAI, the triangle average best approximates a quarterly or annual growth rate from monthly growth rates. It gets its name from the tent-line nature of weights applied to current and past values in the averaging process. A simple average weights current and past values equally, while a triangle average has weights that peak in the recent past and are equally spaced going backward and forward in time from the peak (e.g., Q1-20 growth = (1/3)*Mar-20 + (2/3)*Feb-20 + (1)*Jan-20 + (2/3)*Dec-19 + (1/3)*Nov-19 growth rates). The positive quarterly DEAI value implies that Detroit’s economic activity expanded enough in December and January to offset three months of declining activity (November, February, and March).
2 Detroit’s share of Michigan’s total population is an author’s calculation based on 2019 city data from the U.S. Census Bureau and 2019:Q4 state data from the U.S. Bureau of Economic Analysis, both from Haver Analytics. The Covid-19-related shares are author’s calculations based on 2020 data from the State of Michigan, available online, accessed on June 1, 2020.
3 The labor-related values referenced in this paragraph have all been seasonally adjusted, and they have also been adjusted for breaks in their time series resulting from the decennial censuses.


